Hello steemian, This week lecture is about "swing trading" by professor @yohan2on and he has explained to the steemians the background in swing trading.
Here is my understanding on the analysis on swing trading
SWING TRADING
Swing trading has to do with the gain made from short or medium term trading over a period of time it may be few days to few weeks,the swing traders primarily uses
Technical analysis
to look for the best trading opportunities.it also exposed the swing traders to things such as the risks (overnight and weekend risk).
It goals involve knowing how price move and the potential of the price to move and more swing traders uses the opportunity of the price movement to move to the next opportunity depending on the risk and rewards badis involved.
Swing trading primarily uses technical analysis due to the short term nature of trades.and it involved using technical indicators,chart patterns, candlestick patterns and multi-time frame.
Swing trading also has pros and cons which are
| Pros | Cons |
|---|---|
| Here it requires involve less time of trading than day trading | it is subjected to overnight and weekend market risk |
| Traders here can rely on technical analysis | traders often miss longer term trend in favour of short term market move |
A crypto asset pair
For this lecture purpose
I choose the bitcoin because of it market relevance in the past weeks. It is ranked 1th on the coin market cap. It has a 30% market dominance. Bitcoin has high volume in the market .
I'll be using the https://www.tradingview.com/ for the analysis.
Below is the trade view of BTCUSDT On the chart
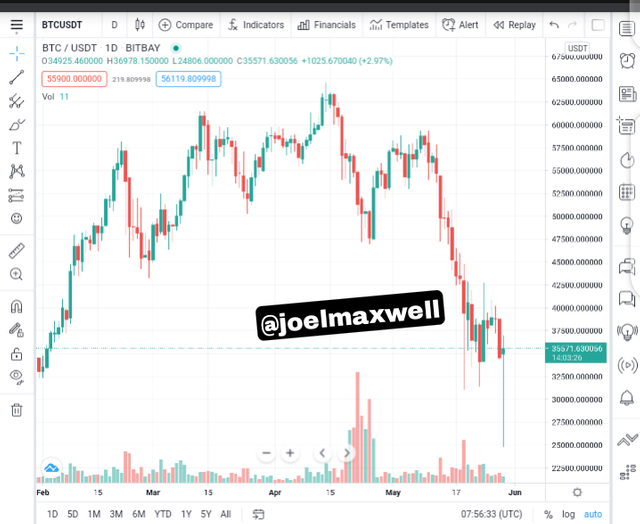
What's your Entry and your exit strategy?
it is very important and necessary to understand and learn the strategy to use in the crypto market for traders. And the understanding of this strategy means that the trader understands the trend Pattern of the chart, that is the upward and downward movement of the chart.
Here I will be using the systematic trade pattern analysis method.
Therefore an understanding of this will help set your entry and exit into the market perfectly.
Multiple time Frame analysis
Multiple time frame analysis is just the act were a trader analysis the same crypto asset pair but on a different time frame. The swing trader does this most often so to take advantage of the profits involved in this different time frame zones. Below I'll be technically analysing the time frames for a day, 4hours and weekly which is what a swing trader is known for.
For Day
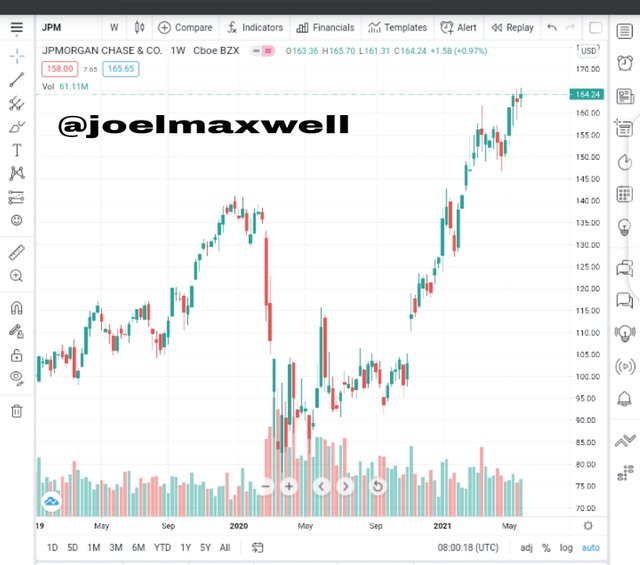
Above is the day trade for BTCUSDT pair.
For weekly
Above is the trade pattern for Bitcoin weekly trend. This gives a wider view of how the market is doing, unlike the day trade that is concentrative.
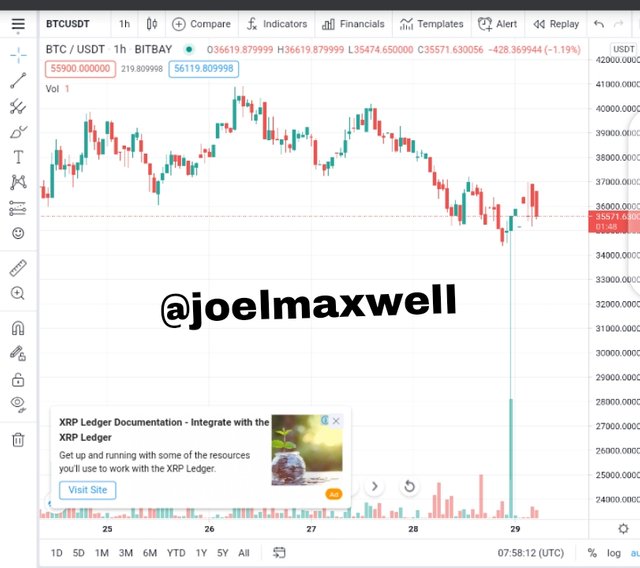
1 hours

Now the above trend of 1hours will help check the support, resistance, oversold and overbought so to enter and exit the trade c.
Candlestick analysis and use of other relevant supporting indicators for your trade decision.
Candlestick analysis for weekly trend
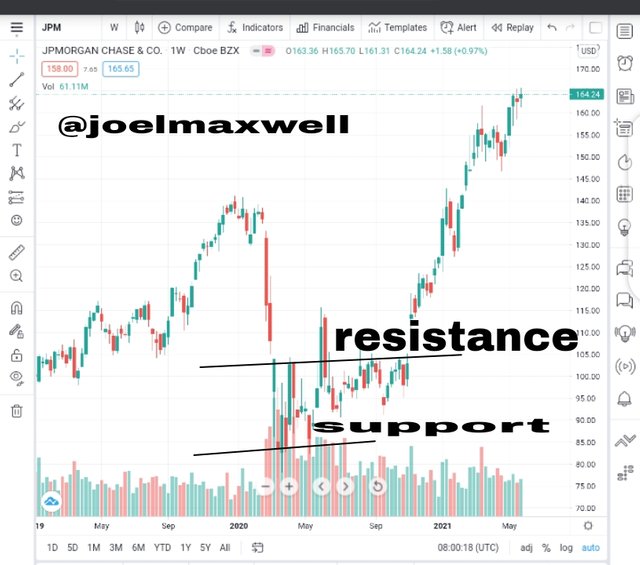
Above is a weekly trade pattern of the BTCUSDT pair. Looking at this chart I moved as far back to 2020. Notice the market towards december 2020 the market had a significant fall, and from 2020 towards 2021 an uptrend began.
Candlestick analysis for daily trend
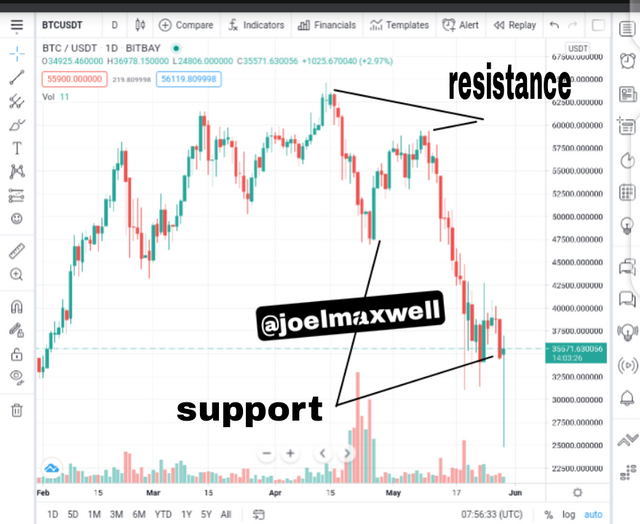
Now analysing for a day. It shows a more clearer view of the trade pattern, were we can spot our daily trade support and resistance. Notice our first resistant point at 62500usdt before it proceeded for a bear to a 47500 point. And then repeated the same process were hit 6000 at May and then beared again to 35571 the current price.
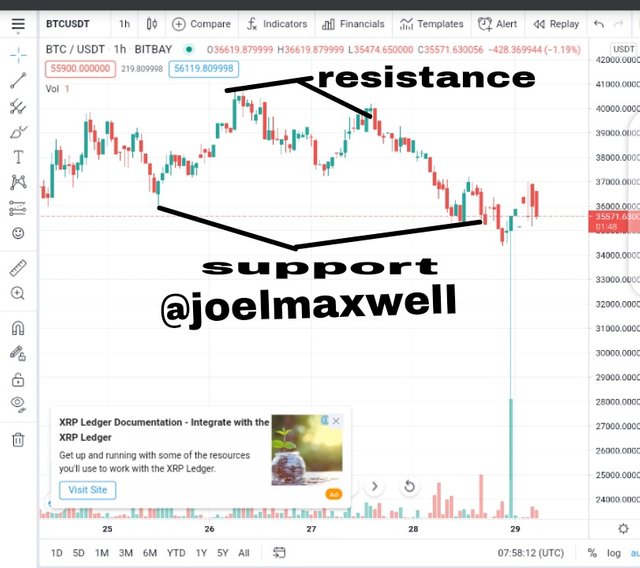
Now this is were I'll enter my trade, after analysing the trade for the daily and weekly trend pattern, now I have had a good knowledge of the market. And this will help me maximize profit.
Now looking at the market trend it followed almost the same pattern as the daily trend and this is good to build confidence.
Other Indicators
RSI (Relative Strength Index)
The RSI serves as a correcting tool in view of over sold and overbought
Now we will be carrying out an RSI analysis on our 1hours trade
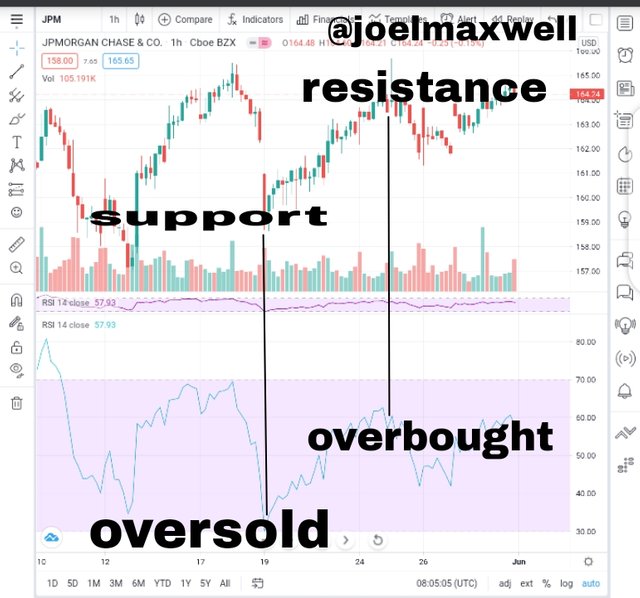
In view of this RSI(relative strength index),my RsI analysis tally with chart,and that gives me the much needed confidence to proceed with the trading
Conclusion
Swing trading gives me a wider coverage of my trade it is worthy of note that CRYPTOCURRENCY is not gambling as people will refer to it but a careful study will lead to higher profit taking.
My stop loss = 35564usdt
Take profit = 45631usdt
Trailing stop loss = 38471usdt.
Hello @joelmaxwell,
Thank you for participating in the 7th Week Crypto Course in its second season and for your efforts to complete the suggested tasks, you deserve a 5/10 rating, according to the following scale:
My review :
An article with medium content that lacks accuracy in some aspects of the topic due to the fact that indicators are not used for technical analysis or are misused, for example:
For the RSI, the overbought area is above the 70 line while the oversold is not above the 30 line.
Thanks again for your effort, and we look forward to reading your next work.
Sincerely,@kouba01
Downvoting a post can decrease pending rewards and make it less visible. Common reasons:
Submit