
Hello steemians welcome to this article where i explain a lot of candlestick patterns and how as a trader it is better to know them so that you can maximize your profit and reduce your loses, in his lecture the professor posted 3 questions in the homework post, the 3 questions read, 1. In your own words, explain the psychology behind the formation of the following candlestick patterns. • Bullish engulfing Candlestick pattern • Doji Candlestick pattern • The Hammer candlestick pattern • The morning and evening Star candlestick pattern. >2. Identify these candlestick patterns listed in question one on any cryptocurrency pair chart and explain how price reacted after the formation. (Screenshot your own chart for this exercise) >3. Using a demo account, open a trade using any of the Candlestick pattern on any cryptocurrency pair. You can use a lower timeframe for this exercise.(Screenshot your own chart for this exercise).
So I will be explaining these questions one after the other.
Question number 1. In your own words, explain the psychology behind the formation of the following candlestick patterns.
• Doji Candlestick pattern
• The Hammer candlestick pattern
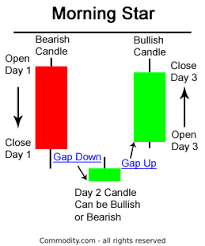
• The morning star candlestick pattern
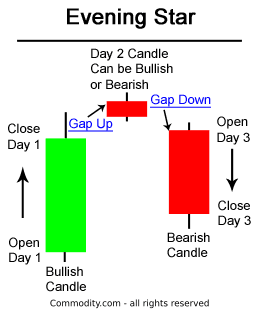
• The evening star candlestick pattern.
.png)
Bullish Engulfing Candlestick Pattern
When this pattern occur in any asset chart it means at that particular time frame the sellers are running out of juice meaning they have been exhausted but the buyers in the market
The candlestick pattern forms when the bullish candle that forms engulf, cover up the last bearish candle.
Let's see the image of bullish engulfing candlestick pattern below.
If this candle pattern form on a support line then the direction of that market will reverse either short term or long term, the last bearish pattern that forms must be smaller in size to the previous red candles in the downtrend, that will indicate that the sellers have been overpowered because of the low amount of volume in the downside, the next green candle after the smaller red candle have to be big enough that it engulf the whole red candle, if that happens it means the buyers have gained momentum and that the price may reverse.
It is pertinent to know that the bullish candle that forms must close above the opening of the bearish candle. If that doesn't not happen, it means the candle doesn't engulf and may continue down or go sideways.
Doji Candlestick pattern
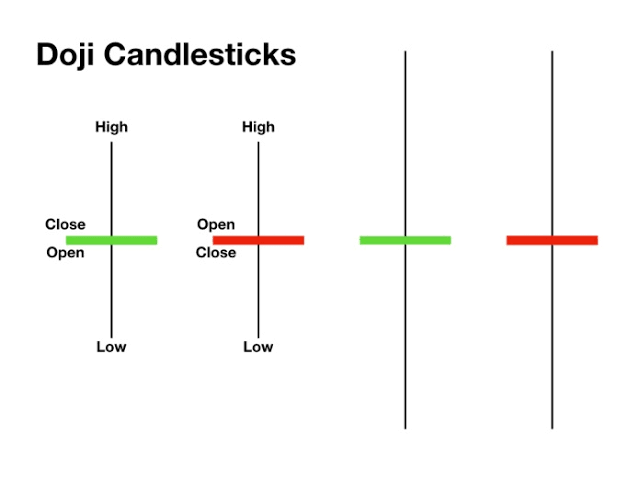
This is another candle stick pattern which is widely used by traders, I call it the decision pattern because if this pattern displays on the chart it means there is a possibility we continue the trend or we get a change of direction, The Doji candlestick pattern forms when bears and bulls are dragging price between each other. The sellers want to push the price down and buyers want to push the price up. This period, where there is no clear way, that is whether the odd will favor sellers or buyers, is often called indecision period. Let's see the image of a Doji candlestick pattern below
It is because of the indecision that is why the price usually close in a tight candle of two shadows, a professional trader will advice you a newbie in trading to wait then after the Doji has decided the direction you can go ahead with your trade, many inexperienced traders always loose money because they see a doji but don't know what it is then they enter a long thinking the price will go up but the price goes down and the loose their money.
Hammer Candlestick Pattern
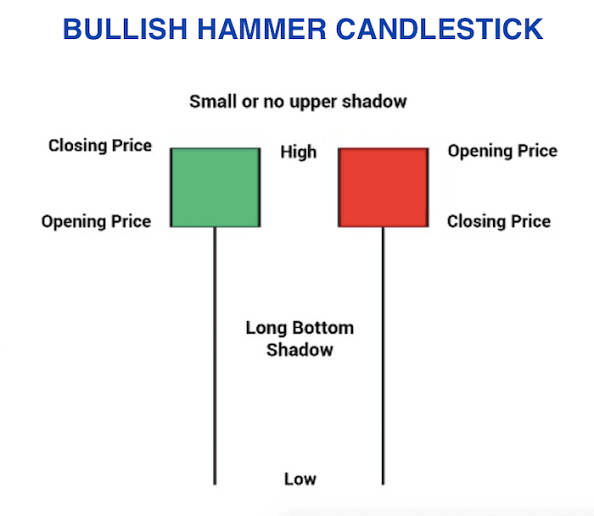
The reason it is called hammer it's because it looks like a hammer when it forms but it depends on the time frame it forms in because it will look different in different time frames, When this downward momentum is about to shift to upward momentum, the hammer Candlestick pattern forms. In essence, this pattern forms after the sellers are exhausted and because the buyers came in to the market with a very strong momentum which greater than that of the sellers, they draw the price up significantly to the extent that it leaves a long tail. This long tail signifies support.
Let's look at the image of the hammer Candlestick pattern below:
Do you Notice that in the image above, the color of the candles is green and red. The color doesn't matter as long as this pattern forms on a support level and after a very bearish trend. All these pattern when form on higher time frame like 1hr and 4hr, they are strong.
The Morning Star
This is the type of pattern which forms after the price of that asset has been in a downtrend for a long period of time, it is known as a reversal pattern, if it forms a support level on higher time frames like 1hr or 4hr then the price will go bullish fast.
Let's see the image of the morning star below
When the bears are exhausted then expect to see a morning star, the morning star comprises of a large bearish candle, follows by an indecision candle, a small candle and a large bullish candle. The bullish candle forms in the direction of the upward trend which must engulf the small indecision candle.
The Evening Star
If the morning star forms at the support level then the evening star forms at the resistance level, It is a bearish reversal pattern. When it is displayed on higher time frame, traders do take advantage of it to ride on the bearish trend.
Let's see the image of the evening star below.
When you see a large bullish candle, and indecision candle which signifies exhaustion and follows by a large bearish candle which engulfs the indecision candle then that is a evening star and it is about to go down.
.png)
Question number 2. Identify these candlestick patterns listed in question one on any cryptocurrency pair chart and explain how price reacted after the formation. (Screenshot your own chart for this exercise)
.png)
For the identification of these candlestick patterns on the chart, I am going to use ETHUSDT pair and binance platform.
Indicating Bullish Engulfing Candlestick Pattern
Now let's start by identifying bullish engulfing candlestick pattern on the chart.
Below is the screenshot of the bullish engulfing candlestick pattern.
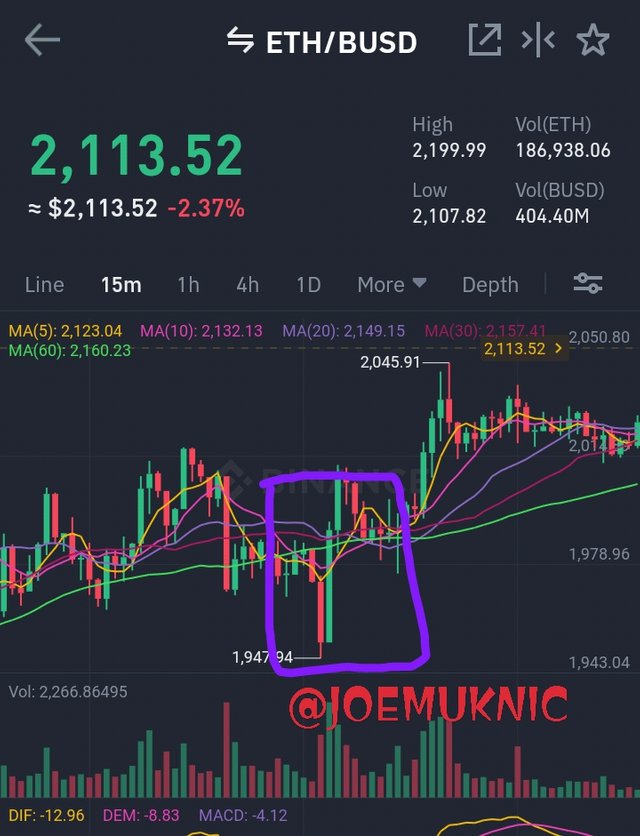
As you can see in the image above, there was a downtrend going on but was bullish engulfed by the green candle that followed and from there the price started going on an uptrend, therefore can be seen that bullish engulfing candle pattern is a reversal pattern when formed on a support level.
Indicating of Doji candlestick pattern
Now, after indicating bullish engulfing, let's try to see doji candlestick pattern on the chart. See the screenshot below
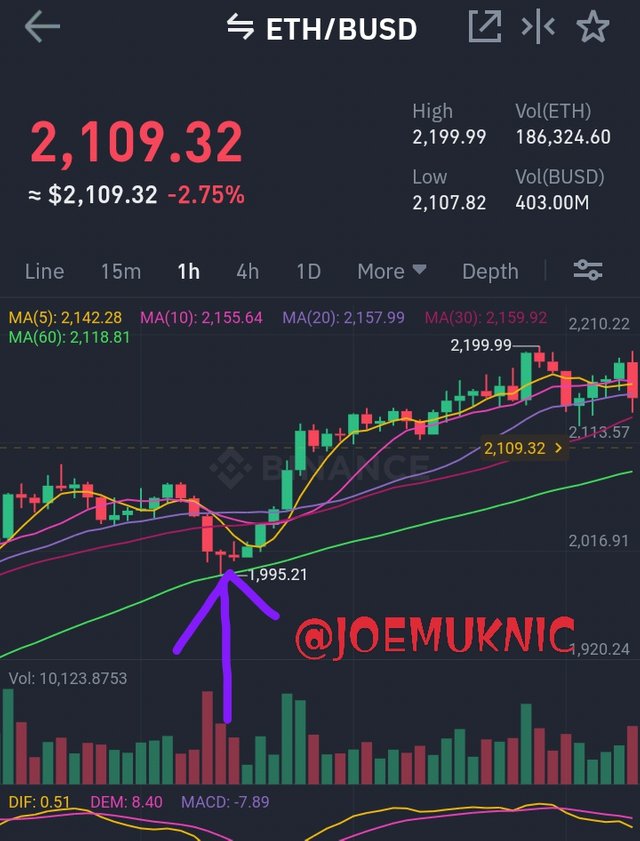
In the image above you can see the doji i identified with a purple angle, doji candlestick pattern can be a continuation pattern and a reversal pattern. The ones that formed in the image above of the bearish trend in a purple circle is a reversal pattern, which drove the the price upward.
Indicating of Hammer Candlestick Pattern
This is another candle stick pattern which is common and will be talking about it, Below is the screenshot of the hammer candlestick pattern on H4 time frame.
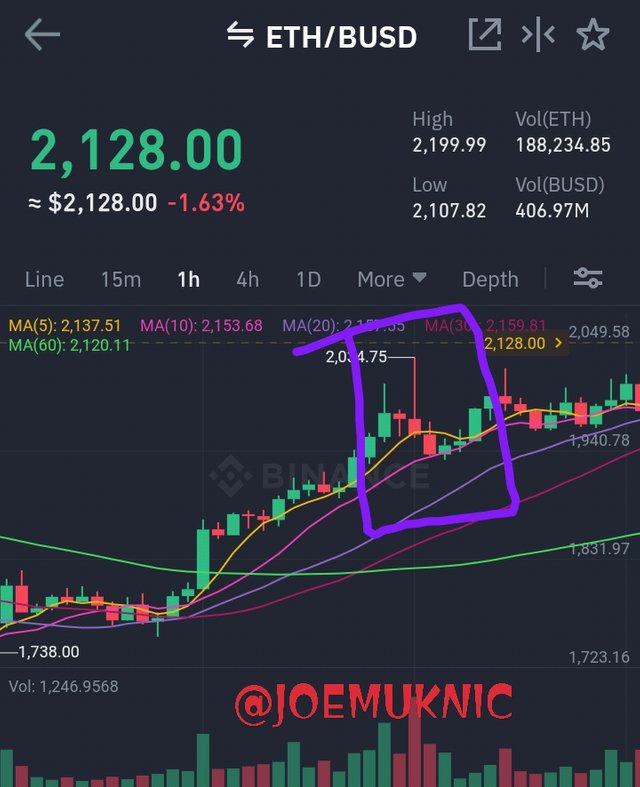
Like I said above, hammer candlestick pattern is a reversal pattern. In the screenshot, hammer candlestick pattern formed after the market has been on up trend. After the formation of this pattern, the price fell down for a moment, about 8 hrs and retrace back, From there the price fell down with a very great momentum.
Identification of the Morning Star
Let's see this screenshot below for an example of the morning star on the chart.
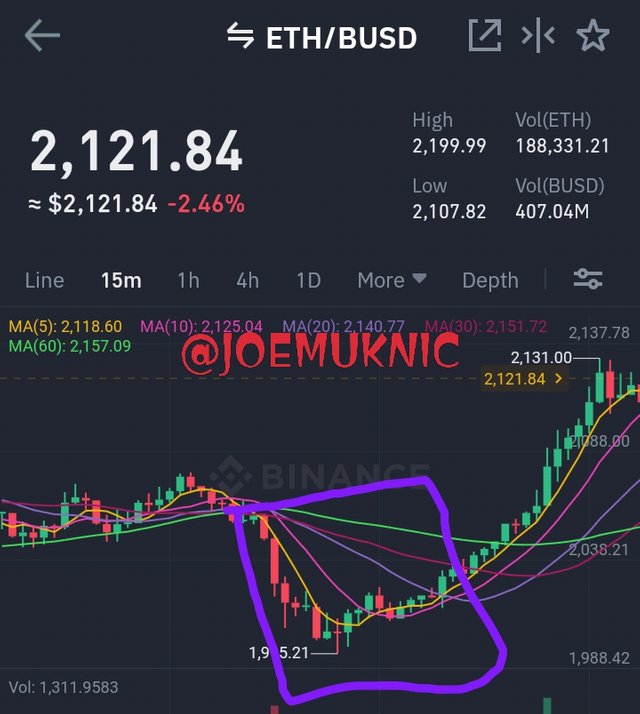
The price has been moving in a upward trend on M30 timeframe ETHUSDT chart. After the price broke the structure up, the price retraced downward and needed to reverse to continue it's uptrend. The morning star formed and then the price went upward.
Identification of the Evening Star
Lastly on this part, i am going to indicate the evening star on the chart. See the screenshot of evening star below.
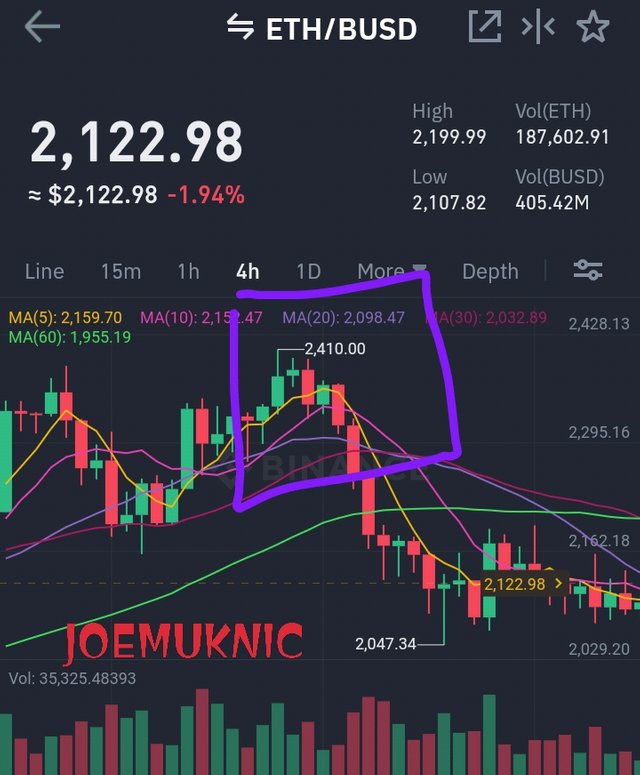
The evening star formed at a resistance level. After the formation of this pattern, price fell down. This pattern is a reversal pattern that when spotted, the traders can take advantage and short the market.

Question number 3. Using a demo account, open a trade using any of the Candlestick pattern on any cryptocurrency pair. You can use a lower timeframe for this exercise.(Screenshot your own chart for this exercise).

In using one of these cand lestick pattern. I will use evening star candlestick pattern on eth/usdt chart.
I spotted a evening star. Below is the the screenshot.

Then, knowing that the market has retraced and formed at a key resistance level based on the time frame 4hr , I placed the trade with 6x leverage.
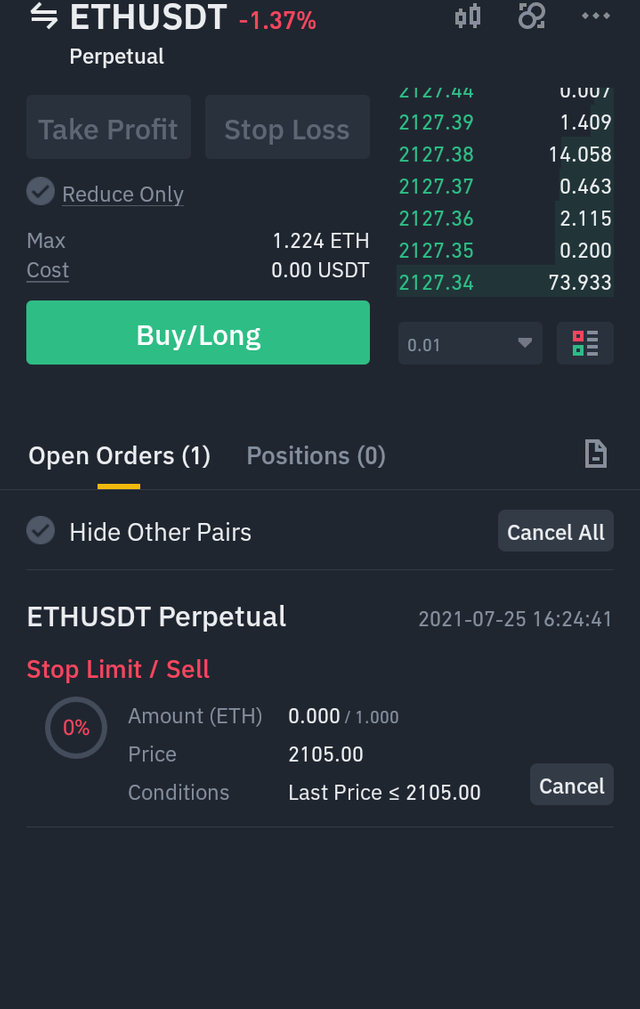
I am still waiting for the trade to start but until then this image above is the screenshot of the trade i took.
.png)
CONCLUSION

Candlestick patterns are used by traders to know when the reversal or continuation of the trend will happen. These patterns are very useful as they display important turning points in the market. These patterns are formed as a result of behavior of bulls and bears in the market.
Thanks you @reminiscence01 for this good lecture
Written by @joemuknic

.png)
.png)
.png)
.png)