
Hello Crypto friends,
I warmly welcome you to my assignment post for season6 week4.
I believe we have all been enjoying the assignment given by our respective professor.
I will be submitting my entry now, please follow along.
EXPLAIN YOUR UNDERSTANDING WITH THE MEDIAN INDICATOR.
In the cryptomarket, the first thing a trader needs to understand before he can enter the market is the current, previous and overall trend of the market. And the median Indicator plays a major role in the Identification of this trend.
The median Indicator can be explained to be a trend based Indicator as it helps to show the direction of the market trend.
With the use of the median Indicator, a trader can confidently enter the market, as it's trend has been identified.
This Indicator is comprised of an ATR Indicator which alongside with the median line forms a channel seen below and above it.
The Median Indicator also plays a major role in the measurement of the volatility in the market.
The Median Indicator helps to detect the median value between the extreme high and extreme low and when compared to an EMA of equal period, it produces a difference which is represented with a coloured cloud.
The colored cloud formed from the difference between the EMA and the median Indicator helps in the Identification of the market trend, thus giving traders confidence as they enter the market.
Whenever a green coloured cloud is formed, it is signaling that the market is in a bullish move, forming higher highs and higher lows, thus showing a good buying opportunity.
Likewise when a purple coloured cloud is formed, it indicates that the market is in a bearish move, thus forming lower lows and lower highs, and giving a good selling opportunity signal.
The median Indicator helps to detect trend reversals condition, for example, whenever the EMA is crossed below the median line, a purple coloured cloud will be formed, signaling a bearish trend reversal.
And when the median line intersects above the EMA, a green coloured cloud will be formed, thus signaling a bullish trend reversal.
PARAMETERS AND CALCULATIONS OF MEDIAN INDICATOR. (SCREENSHOT REQUIRED)
PARAMETERS AND CALCULATIONS OF MEDIAN INDICATOR. (SCREENSHOT REQUIRED)
Inorder to perform this task and get access to the parameters of the median Indicator, a trader has to visit any trading platform that encourages the use of Median Indicator.
For my part, I will be making use of trading view, and to do this, I visited my trading view and the below appeared
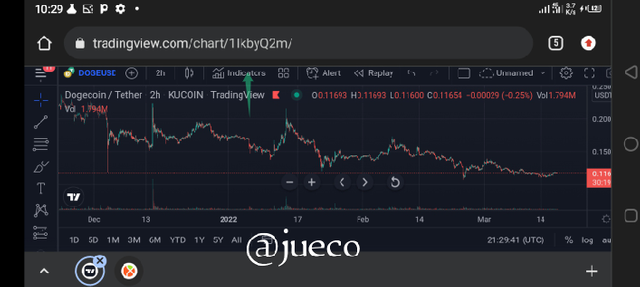
SCREENSHOT FROM TRADING VIEW
- I then clicked on the Indicator icon as seen above inorder for the median Indicator to be added, of which I later clicked on the search botton inorder to search for the median Indicator
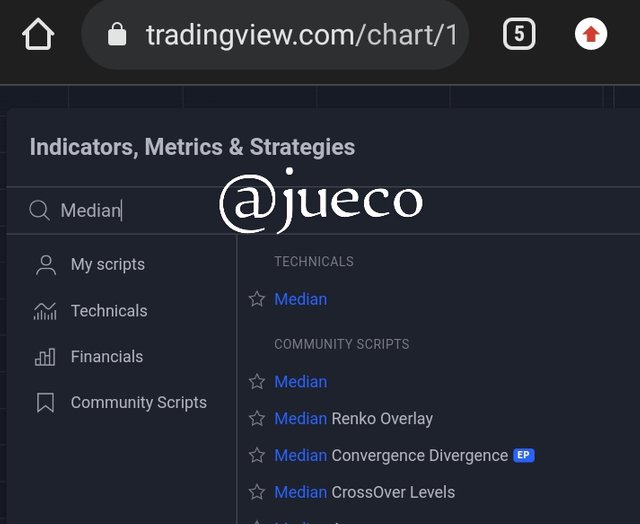
SCREENSHOT FROM TRADING VIEW
- I then clicked on the median Indicator and it was successfully added to the price chart
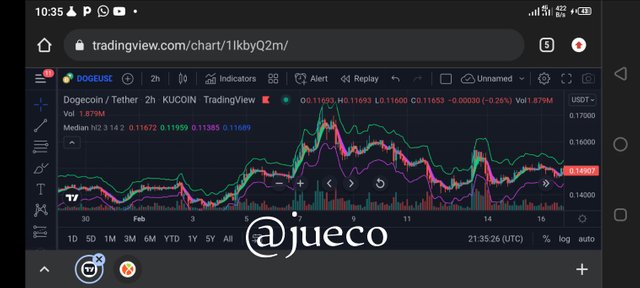
SCREENSHOT FROM TRADING VIEW
- I then attempted to configure it, by clicking on the Indicator, and the settings icon appeared, of which I clicked on settings.
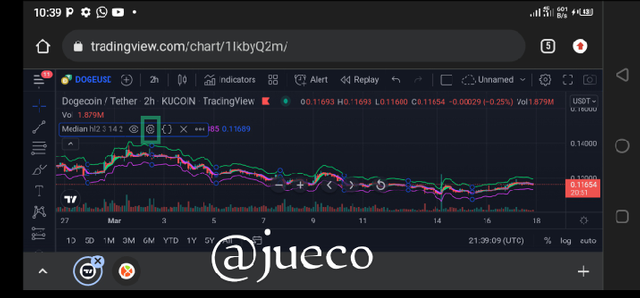
SCREENSHOT FROM TRADING VIEW
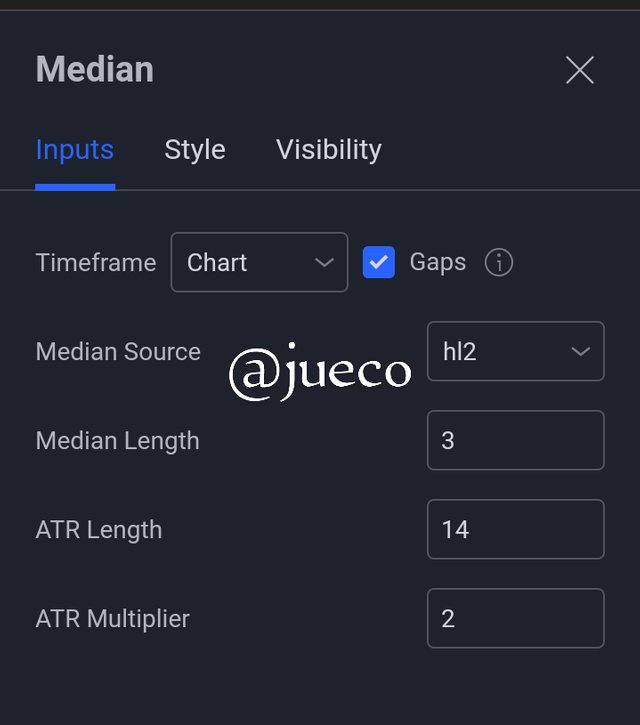
- After clicking on settings, a new display appeared with three major icons, which are; input, style and visibility.
SCREENSHOT FROM TRADING VIEW
From the input icon, we can see that the features of the median Indicator can be changed.
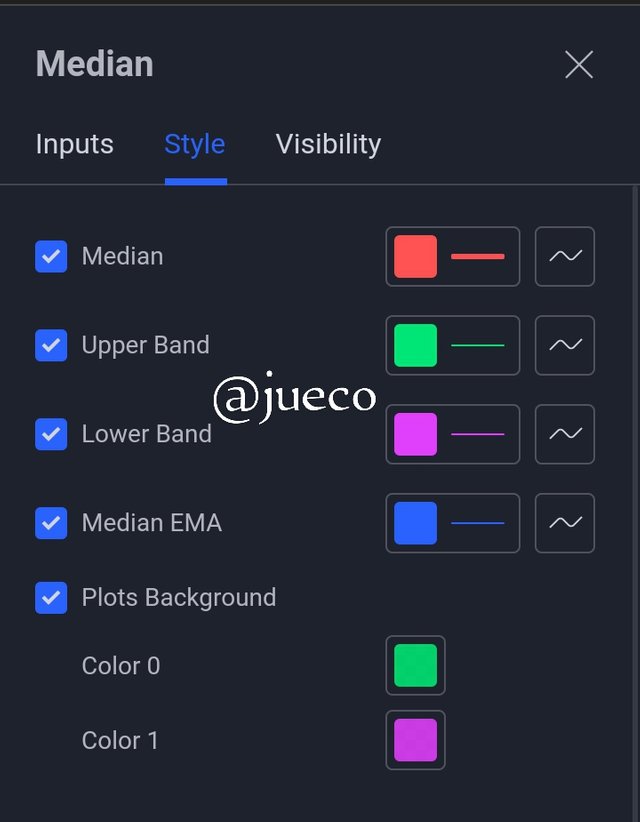
For example, the length of the median Indicator can be changed from it's default of 3 and it's ATR length can be changed from it's default of 14 and the Atr multiplier can also be changed from the default of 2.Moving to the "style" icon, here the color of the median Indicator can be changed alongside the color of it's upperband, lower band and median EMA.
SCREENSHOT FROM TRADING VIEW
The calculation for the median Indicator is the combined calculation of the median value and the EMA value, and they shall be calculated separately.
Median value = (lowest price + highest price)/2
EMA value = Multiplier × closing price + EMA (previous day) × (1-multiplier).
So therefore;
Median Indicator= %change of Atr {EMA value, Median value}.
Now,
If the median percentage change greater than or equal to EMA value, the cloud will be green.
And if the median percentage change is less than or equal to median value, the cloud will be purple.
Other important parameters include:
Upper band = 2ATR + Median Length
Lower band = Median Length - 2ATR
Median Length = Period of observation.
The median Indicator helps to detect the difference between the EMA and the median value, which inturn helps in trend Identification.
UPTREND FROM MEDIAN INDICATOR (SCREENSHOT REQUIRED)
UPTREND FROM MEDIAN INDICATOR (SCREENSHOT REQUIRED)
As earlier explained, the median Indicator is a trend based Indicator as it helps to determine the trends of the market, thus assisting traders to detect the best period to enter the market.
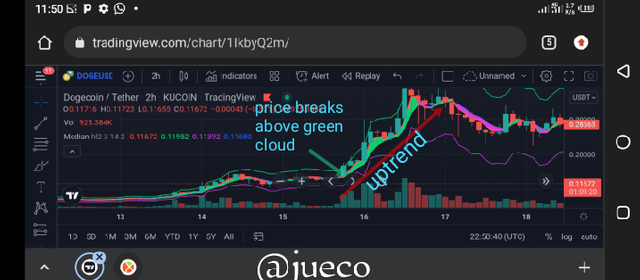
For an uptrend to be confirmed using the median Indicator, the cloud of the median Indicator has to be transformed into green, thus indicating that the median value is higher than the EMA value.
Whenever a green coloured cloud is noticed, it indicates that there are more buyers than sellers in the market, and this sometimes attracts buyers to the market.
A buy signal is usually detected when the price crosses above the green coloured cloud.
SCREENSHOT FROM MT4
The screenshot above is that of DOGEUSD, and as seen above, there was the creation of a green coloured cloud which indicated an uptrend.
And also, the price crossed above the green coloured cloud, thus indicating a good buy opportunity
DOWNTREND FROM MEDIAN INDICATOR (SCREENSHOT REQUIRED)
DOWNTREND FROM MEDIAN INDICATOR (SCREENSHOT REQUIRED)
A bearish trend is usually signaled by the median Indicator when it's coloured cloud turns purple, which is as a result of the fact that the EMA value is higher than the median value.
A bearish trend is always a good opportunity for traders to place a sell order as the market indicates that the bears are in control, by itas formation of lower lows and lower highs.
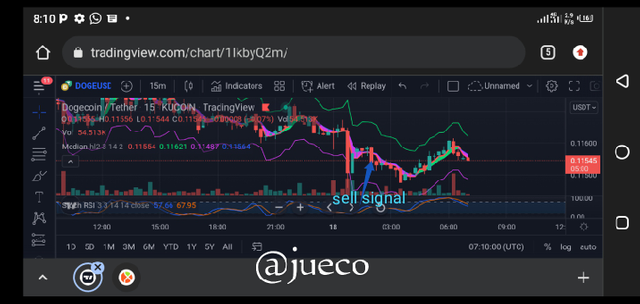
Whenever the purple cloud is formed, it indicates that the market is in a downtrend but whenever the price strikes below the purple cloud, it is signaling a good selling opportunity.
SCREENSHOT FROM TRADING VIEW
As seen above, there were several formation of purple cloud which is a good signal for a downtrend.
And if checked carefully, there are some instances where the median Indicator signals a good selling opportunity by crossing below the purple coloured cloud.
IDENTIFYING FAKE SIGNALS WITH MEDIAN INDICATOR(SCREENSHOT REQUIRED)
IDENTIFYING FAKE SIGNALS WITH MEDIAN INDICATOR(SCREENSHOT REQUIRED)
Well as it is known, that due to the high volatility of the market, a 100% trading accuracy is not guaranteed.
The same is true with the median Indicator, even though it acts as a good trend based Indicator, there are some instances where it gives false signals and manipulate traders into the market.
As an experience trader, we know that it is not advisable to use an indicator as a standalone technical analysis tool, as it is prone to the volatility of the market and in turn gives false signals.
It is most times best to make use of two or more technical Indicators when trading as it will help to increase the success rate of every trade.
For the sake of this assignment, I will be making use of stochastic RSI to help filter out false signals from the median Indicator and also filter out unnecessary noise from the market.
The stochastic Indicator as we know is an oscillating Indicator that helps to detect overbought and oversold regions in the market.
From the stochastic Indicator, whenever the price is seen above the upper band of 80, it indicates that the market is in an overbought region and there is a high probability for a bearish trend reversal.
In a like manner, when the price falls below the lower band of 20, it indicates that the market is in an oversold region, thus serving as a good bullish trend reversal signal.
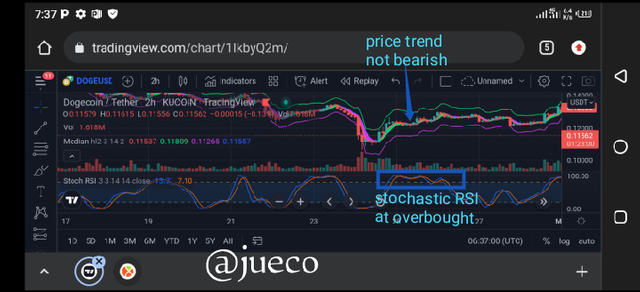
Inorder to place a buy order using the median Indicator, the stochastic Indicator should be in an oversold region and inorder to place a sell order, the stochastic Indicator should be in an overbought region. This is illustrated below
SCREENSHOT FROM TRADING VIEW
As seen above, although there are some situation where the stochastic and the median Indicator gives same signal, then a trader can confidently enter the market.
When checked properly from the above screenshot, we can also notice that the RSI is in an overbought region, which is a bearish trend reversal signal but the median Indicator, on the other hand, was still forming a green coloured cloud, which is a bullish signal.
At this situation where the two Indicators are giving conflicting signals, it will be best to stay out of the market, inorder not to fall prey to false signals.
-Open two demo trades, long and short, with the help of a median indicator or combination that includes a median indicator (screenshot required)
-Open two demo trades, long and short, with the help of a median indicator or combination that includes a median indicator (screenshot required)
SELL ORDER
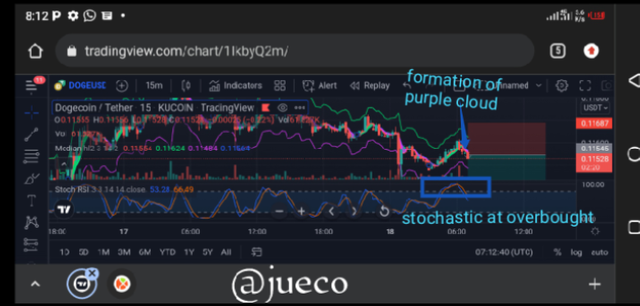
To place a sell order on my mt4 using a demo account, I visited trading view for proper technical analysis
SCREENSHOT FROM TRADING VIEW
I picked the pair DOGEUSD and during my analysis, I discovered that the market was initially in a bullish move, by forming a green colored cloud, and making consecutive higher highs and higher lows, then the price failed to form a new high but instead, I noticed the formation of a purple coloured cloud which is a sign for a bearish move.
As I watched for further confirmation, I noticed that the price broke below the purple coloured cloud which is a good sell position.
Before entering the trade, I decided to confirm the sell signal using a stochastic RSI indicator.
As I checked the stochastic indicator, I noticed that the market was in an overbought region, thus signaling a good sell position.
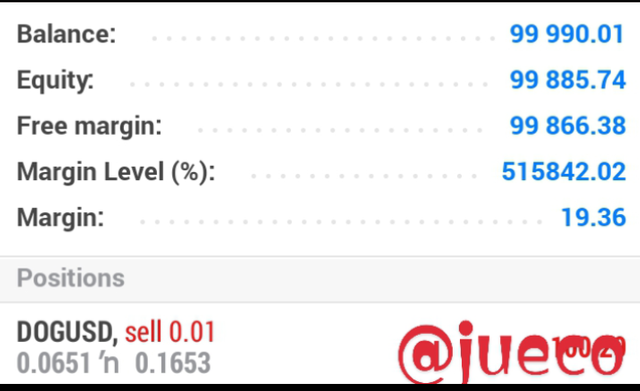
With these two sell confirmation, I entered the market and placed a sell order on the pair DOGEUSD.
I placed my stop loss above the resistance level and my take profit was placed to give a risk reward ratio of 1:2.
Below is the proof of my position from mt4
SCREENSHOT FROM MT4
BUY ORDER
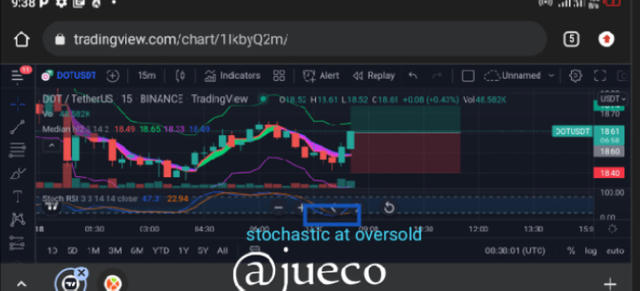
To carryout a buy order on my demo account, the first thing I did was to pick a unique crypto pair, DOTUSD, and I did my analysis on trading view
SCREENSHOT FROM TRADING VIEW
Getting to my trading view, I noticed that the market was initially in a downtrend by forming series of bullish candles, and the formation of a purple coloured cloud.
Then as I watched, I noticed that the price could no longer form new lows and the purple coloured cloud faded away.
As I watched, I noticed that the price began forming bullish candles.
I then proceeded to check the stochastic RSI indicator for a confirmation signal.
As I checked, I noticed that the stochastic RSI indicator was in an oversold region, which is a good buying signal.
With these confirmations, I went ahead to place a buy signal on my demo account.
I placed my stop loss below the support of the price, and I set my take profit in a way that I achieved a risk reward ratio of 1:2.
Below is the screenshot of my order.
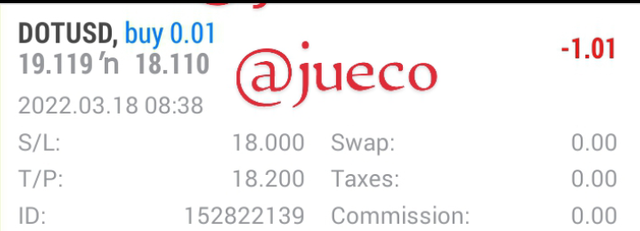
SCREENSHOT FROM MT4
CONCLUSION
CONCLUSION
The median Indicator is indeed another very important trend based Indicator, as it helps to identify the trend of the market.
The formation of green cloud on the chart indicates an uptrend while the formation of purple cloud indicates a downtrend.
I appreciate professor @abdu.navi03 for his lecture, I really enjoyed it.