QUESTIONS
What is your understanding of Triple Exponential Moving Average (TEMA)?
How is TEMA calculated? Add TEMA to the crypto chart and explain its settings. (Screenshots required).
Compare TEMA with other Moving Averages. You can use one or two Moving Averages for in-depth comparison with TEMA.
Explain the Trend Identification/Confirmation in both bearish and bullish trends with TEMA (Use separate charts). Explain Support & Resistance with TEMA (On separate charts). (Screenshots required).
Explain the combination of two TEMAs at different periods and several signals that can be extracted from it. Note: Use another period combination other than the one used in the lecture, explain your choice of the period. (Screenshots required).
What are the Trade Entry and Exit criteria using TEMA? Explain with Charts. (Screenshots required).
Use an indicator of choice in addition with crossovers between two TEMAs to place at least one demo trade and a real margin trade on an exchange (as little as $1 would do). Ideally, buy and sell positions (Apply proper trade management). Use only 5 - 15 mins time frame. (Screenshots required).
What are the advantages and disadvantages of TEMA?

WHAT IS YOUR UNDERSTANDING OF TRIPLE EXPONENTIAL MOVING AVERAGE (TEMA)?
To really understand TEMA, it is only fitting that we get to briefly explain what a ‘Moving average’ (MA) and exponential moving average’ (EMA) is.
MOVING AVERAGE (MA)
The moving average is a technical indicator and what it does is that it used to show the general trend direction of the market be it cryptocurrency or the forex market.
To that note, the EMA was developed sometime after. EMA meaning ‘Exponential moving average’ which is designed in a way that it's purpose is to straighten out the effects of price fluctuation of cryptocurrencies.
More purposely, the EMA unlike the moving average focuses more on the most recent price data of cryptocurrencies i.e the most recent trend direction of a market. Thus bring us to the subject matter TEMA

TRIPLE EXPONENTIAL MOVING AVERAGE (TEMA)
A TEMA which is called ‘triple exponential moving average’ is designed to smoothen out price fluctuation i.e filter out noise/lag and price volatility from cryptocurrency charts, so that it becomes relatively easier to denote trends without the association of lags.
A TEMA makes use of multiple EMAs( Three EMAs; simple EMA, double EMA and the triple EMA). The TEMA is very effective and mostly used by traders in trading trends sustained over a long period of time. Analysts can easily filter out and disregard periods of volatility.

HOW IS TEMA CALCULATED? ADD TEMA TO THE CRYPTO CHART AND EXPLAIN ITS SETTINGS. (SCREENSHOTS REQUIRED)
Mathematically, the TEMA is calculated in a market trend. Once a time period has been selected the TEMA can be calculated using the formula below:-
TEMA = (3×EMA1) - (3×EMA2) + EMA3
Where :
EMA1 = Exponential moving average
EMA2 = EMA of EMA1
EMA3 = EMA of EMA2
Most times traders find calculating TEMA to be quite confusing as it involves mathematical approach , so basically TEMA can be gotten when you use the 30 length on the 5 minutes chart.

HOW TO ADD TEMA TO TRADEVIEW
To add TEMA, firstly go to a chart in your trading view and click on indicator
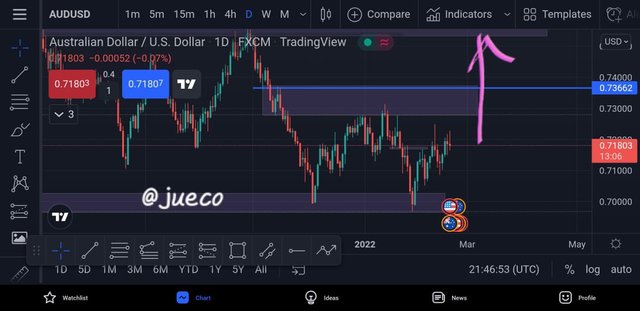
Then in the search bar, type in TEMA and the TEMA indicator will be searched out
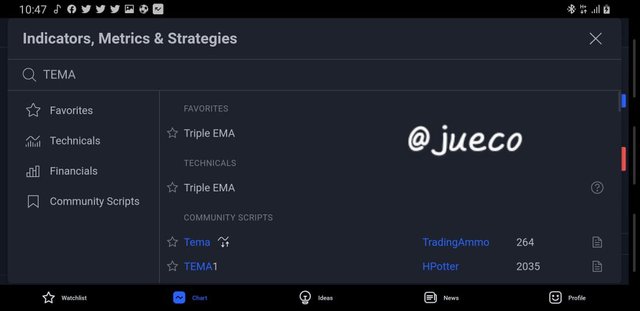
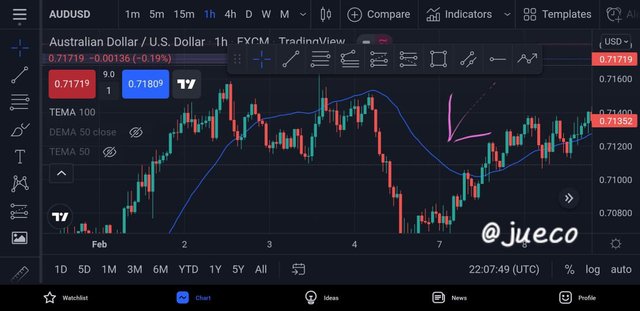
Click on the indicator to add it to your chart. There in your chart the indicator should have successfully in been added a thin blue line should be displayed in your chart.

COMPARE TEMA WITH OTHER MOVING AVERAGES. YOU CAN USE ONE OR TWO MOVING AVERAGES FOR IN-DEPTH COMPARISON WITH TEMA
The TEMA has been explained to a certain extent from the beginning of this course. Therefore to compare it with the double exponential moving average and the simple moving average.

Comparison between a TEMA and DEMA
The TEMA has been explained to a certain extent from the beginning of this course. Therefore to compare the TEMA with the double exponential moving average(DEMA);
The TEMA is quite similar to the DEMA but most notably in DEMA, just two EMAs are used in calculating values while in TEMA, 3 EMAs are required for the calculation which results in a faster EMA with lesser lag therefore apparently the TEMA is faster than DEMA.

Comparison between a TEMA and SMA
Unlike the TEMA the SMA is a lagging indicator meaning that it takes time for it to give signals on recent price data which does not do anything to help traders because they would have missed out on potential trade entries. Compared to the TEMA which is a fast indicator, the SMA is relatively slow.

EXPLAIN THE TREND IDENTIFICATION/CONFIRMATION IN BOTH BEARISH AND BULLISH TRENDS WITH TEMA (USE SEPARATE CHARTS). EXPLAIN SUPPORT & RESISTANCE WITH TEMA (ON SEPARATE CHARTS). (SCREENSHOTS REQUIRED)
For trend Identification of trends using TEMA, it is quite important to note that price action and TEMA line moves in the same direction which is something that makes the TEMA simple to use and more effective compared to other EMAs.
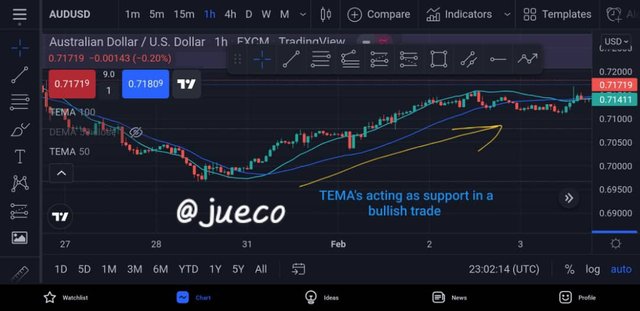
Therefore, in case of a bullish market, price action and the TEMA line will move upwards in an uptrend direction.
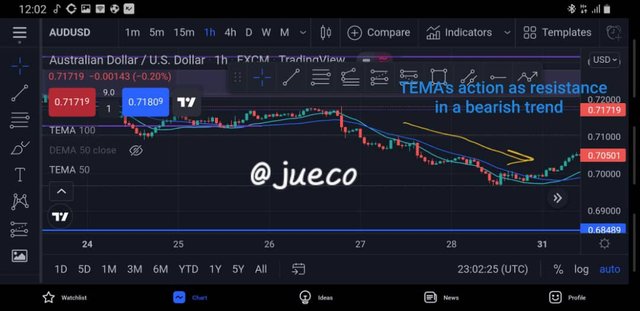
In a bearish market, price action and the TEMA line will move downwards in a downtrend direction.
For TEMA confirmation, in a bullish market,the TEMA line and the price action moves upwards therefore in a bullish trend,we see that price action. trades above the TEMA line, thus the TEMA acts a guidance/resistance to the price
Whilst in a bear trend, since the price action and the TEMA line moves downwards, thus we get to see that price action trades below the TEMA line therefore making the TEMA act as a support to the price.

EXPLAIN THE COMBINATION OF TWO TEMAs AT DIFFERENT PERIODS AND SEVERAL SIGNALS THAT CAN BE EXTRACTED FROM IT. NOTE: USE ANOTHER PERIOD COMBINATION OTHER THAN THE ONE USED IN THE LECTURE, EXPLAIN YOUR CHOICE OF THE PERIOD. (SCREENSHOTS REQUIRED)
Making use of 2 TEMAs at different periods with one at a higher period and the other at a lower period say; TEMA1 at 100 period and TEMA2 at 50 period for a normal stand point moving average.
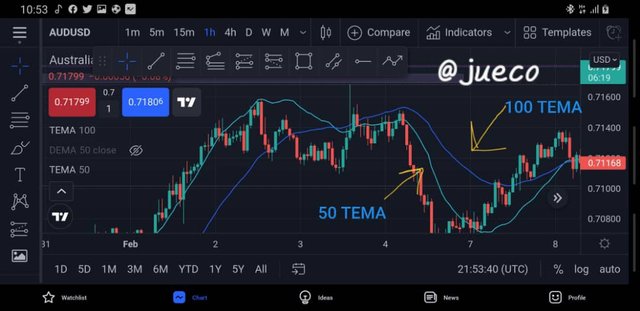
With the aid of the 2 TEMAs as a trading strategy helps in identifying next trends as well as crossovers that can be used as an entry/exit points to either take a trade or leave one.
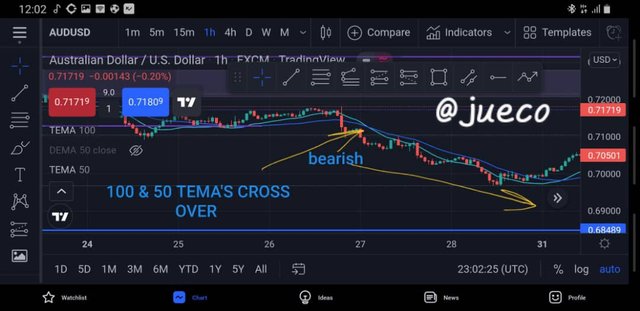
Therefore, once the TEMA with the higher period(100) passes over/crosses the lower period (50), it signifies a downward trend which means that it is best to enter the trade and place a sell order. Subsequently, if the TEMA with a lower period passes over/cross the higher period, it signifies an upward trend in the market which means it is best to enter the trade and place a buy order.
For graphical illustration, in the screenshot below;
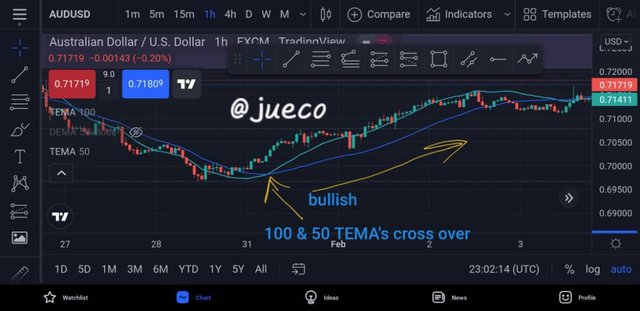
Using the AUD/USD chart and adding both TEMAs at different periods, here we see a significant downtrend after the 100 period TEMA line crosses over the 50 period TEMA line
Likewise using the AUD/USD chart, we see a significant uptrend after the lower period TEMA(50) crosses over the higher period TEMA line (100).

WHAT ARE THE TRADE ENTRY AND EXIT CRITERIA USING TEMA? EXPLAIN WITH CHARTS. (SCREENSHOTS REQUIRED)
For trade entries and exits using 2 TEMA as a trading strategy. Thus the criteria for trading are as follows;

To trade entry and exit for a buy order includes
Be sure to add the 2 TEMA indicators to the chart, with one at a higher period and the other at a lower period.
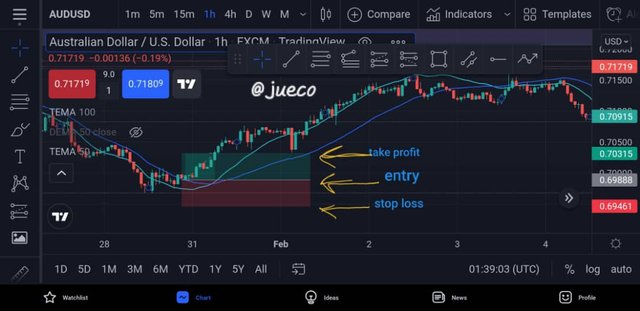
For a buy order, keep a look out for where the lower TEMA period crosses over the higher TEMA period.
Depending on your trading strategy though it's quite advisable to wait for two or three candle confirmation before you begin your trade I.e a buy order.
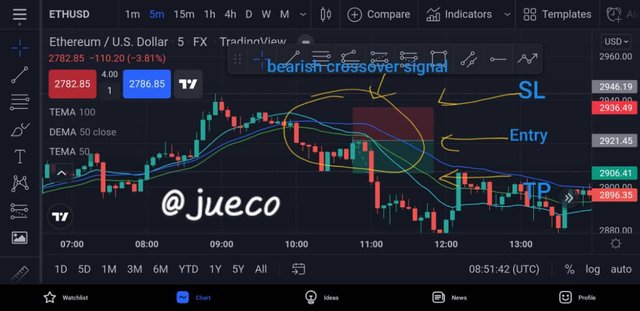
For when to exit trade, place your take profit and stop loss below the TEMA crossover and depending on your trading strategy, you can choose any risk to reward ratio of your choice. For example I use a risk to reward ratio of 1:1. Check screenshot below.

To trade entry and exit for a sell order includes
Be sure to add the 2 TEMA indicators to the chart, with one at a higher period and the other at a lower period
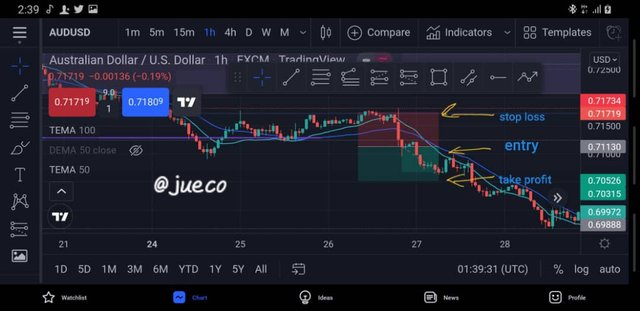
For a sell order, keep a look out for where the higher TEMA period crosses over the lower TEMA period.
Depending on your trading strategy though it's quite advisable to wait for at most two or three candle confirmation before you begin your trade I.e a sell order.
For when to exit trade, place your take profit and stop loss below the TEMA crossover and depending on your trading strategy with a risk you can choose any risk to reward ratio of your choice. For example I use a risk to reward ratio of 1:1. Check screenshot below.

USE AN INDICATOR OF CHOICE IN ADDITION WITH CROSSOVERS BETWEEN TWO TEMAs TO PLACE AT LEAST ONE DEMO TRADE AND A REAL MARGIN TRADE ON AN EXCHANGE (AS LITTLE AS $1 WOULD DO). IDEALLY, BUY AND SELL POSITIONS (APPLY PROPER TRADE MANAGEMENT). USE ONLY 5 - 15 MINS TIME FRAME. (SCREENSHOTS REQUIRED)
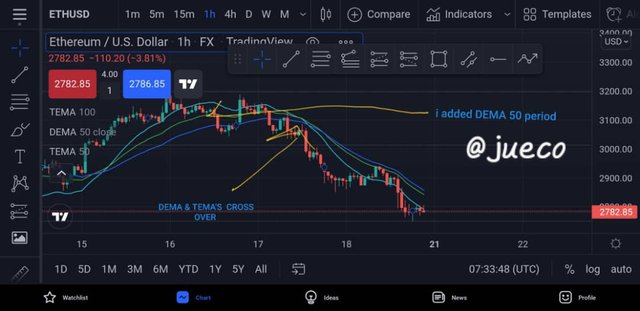
Making use of the 2 TEMA crossover strategy and a single DEMA to place this trade.
Applying both TEMAs at different periods 50 and 100 as well as the DEMA on the ETH/USD demo trade
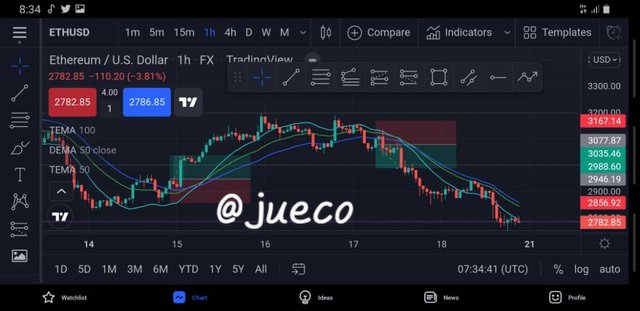
After keeping a keen eye on the chart, I observed as the 100 period TEMA line crossed below the 50 period TEMA line. Still waiting on a confirmation from the DEMA indicator which came by seconds after, thus signaling a downward movement of prices. I waited for another candlestick confirmation.
After which I took my entry trade and set my stop loss and take profit with a risk to reward ratio of 1:1.
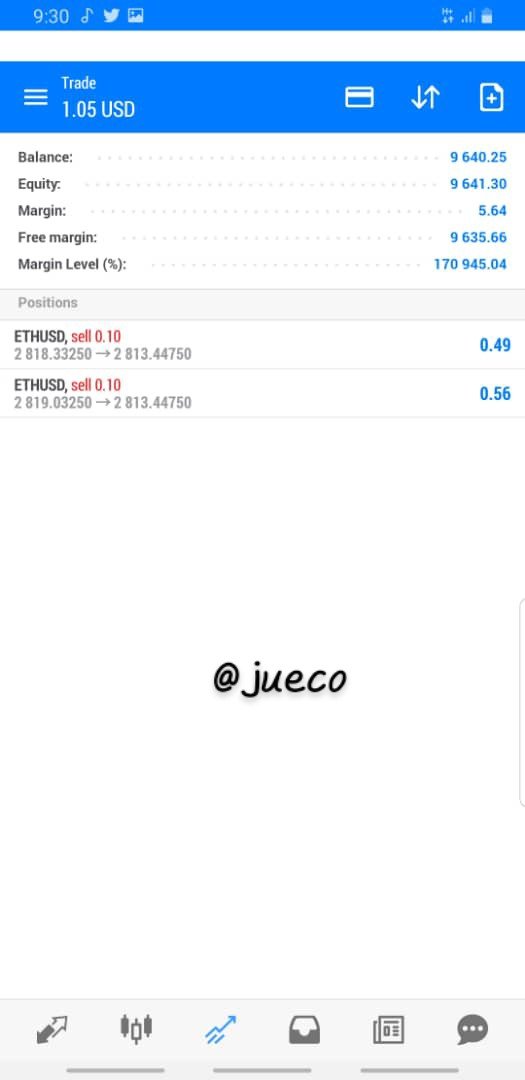
After all these considered I made the Sell profits of 0.49 dollars and 0.56 dollars.

WHAT ARE THE ADVANTAGES AND DISADVANTAGES OF TEMA?
The TEMA indicator is a very good indicator, effectively better than its predecessor still even with all its perks it still has some disadvantages. Therefore below are some of its advantages and disadvantages.

Advantages of TEMA indicator
It has a lesser lag compared to other moving averages
The TEMA is mostly good for trending markets
TEMA is quite faster than most moving averages i.e it catches price action faster in any cryptocurrency market
It is quite simple to use i.e buy when a candle closes above the line and sell when a candle closes below the line

Disadvantages of TEMA indicator
It is not suitable for choppy market because it gives out false signals
The TEMA reacts very fast with price change, but depending on trading strategies only significant price changes are required.

CONCLUSION
With the homework given it can be summarize that a TEMA is an indicator that helps to filter out lag/noise thus stabilizing price fluctuation in a cryptocurrency market.
The TEMA in comparison to other moving average is faster and it helps denote price trends thus serving as a good trend Identification indicator
The TEMA also acts and serves as a support and resistance in a bull trend and bear trend respectively
A trading strategy that combines 2 TEMAs can be applied which helps In placing trades by pointing out key entries and exits depending on the signal it provides i.e in an uptrend, place a buy order and in a downtrend place a sell order
The TEMA is a good indicator with lots of advantages over other moving averages though it has a few hiccups pertaining it's inability to send good signals in sideways market. Still no indicator is 100% efficient.
Thank you for reading;
Professor @fredquantum