Hello Crypto friends,
With humility of heart, I happily submit my entry to the interesting assignment given to me by my amiable Prof @reminiscence01
EXPLAIN MY UNDERSTANDING OF PRICE ACTION
Before I begin, in the world of trading as a whole whether forex ,stock or crypto the market in general is majorly determined by 3factors which we use to predict the possible next movement of the market and they are;
fundamental analysis , technical analysis and sentimental analysis, all this I would briefly discuss for easier understanding
FUNDAMENTAL ANALYSIS, fundamental analysis (FA) comprises of financial news reading be it rise and drop in unemployment rate of a country , inflation news natural and human disaster such as wars storms pandemic earthquake etc all of these determine the next movement of price of currency , crypto or stock over a long period of time.
TECHNICAL ANALYSIS , 90% OF Traders who trade the financial market mainly makes use of technical analysis that is ,we have more technical analysis traders than any other form of trading. Technical analysis is a form of trading that comprises of making use of chart pattern such as double top, flag pattern, head and shoulder pattern. Price action and movement and also the structure of the market at that certain price level, all this or predict the direction of price
SENTIMENTAL ANALYSIS Sentimental analysis is also based on news and this is a process of trading based on opinion expressed by major influence like elon musk attitude toward a particular market be it positive or negative for example ,earlier this month the admin of the Shiba Inu on twitter tweeted a possible rise in the price of their coins by 600% which made alot of buyer and major whales buy their coin.that is a example of sentimental analysis.
Price action on it own is based on technical analysis and it refers to the movement of price of a market over time .price action comprises of chart pattern, trend analysis or trend of market in a market structure without the use of indicator ideas to create trading ideas or strategy in order to predict the next possible move of price ,alot of traders make use of price action to get their trading strategy and idea and they make their analysis based on different chatting tools some which include the Japanese candle stick ,the heikin Ashi,area chart etc all this show chart in different ways .
What is the importance of price action? Will, you chose any other form of technical analysis apart from price action? Give reasons for your answer.
As we already know, price action is the movement of a cryptocurrency price over a given period of time.
Price action serves as the basis for technical analysis of the market, and price action is solely relied upon by traders to enable them make trading decision.
No doubt, price action is very important and below are some of it's importance.
Price action is very important in crypto trading as it helps to ease and make the Identification of trend direction effective
Price action also pays a very big role in the analysis of the market condition. Without the use of price action, it will be nearly impossible to understand the relationship between buyers and sellers in the market.
Price action plays a big role in filtering out false signals given by other technical tools like technical Indicators
Without the help of price action, it will be impossible to filter out noise from the market, and if the noise in the market is left unfiltered, traders are bound to take bad trading decisions.
Price action helps traders to determine the best period to enter the market, the best point to place a stop loss and take profit positions.
In a nutshell, the importance of price action cannot be overemphasize, as it is the foundation on which technical analysis stands.
Explain the Japanese candlestick chart and its importance in technical analysis. Would you prefer any other technical chart apart from the candlestick chart?
As a student of the steemit crypto academy, I have come to understand that there exist many types of charts amongst which are bar chart, line chart, Hollow chart, Japanese candlestick chart, etc.
The Japanese candlestick can be explained as a technical analysis tool used by traders to analyze the price action of cryptocurrency in the market.
It was developed by a Japanese rice trader with the name Munehisa Homma, in the 18th century.
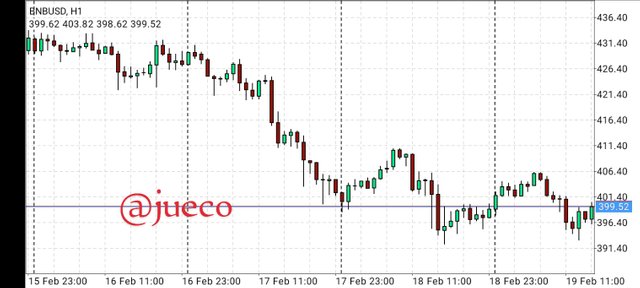
Screenshot from mt4
The above screenshot is a perfect example of a Japanese candlestick of a bearish trend.
As seen above, the Japanese candlestick chart is a chart that consist of several kinds of candles with different colours.
The Japanese candlestick consist of two colors; the green colour and the red colour, which will be explained as we proceed.
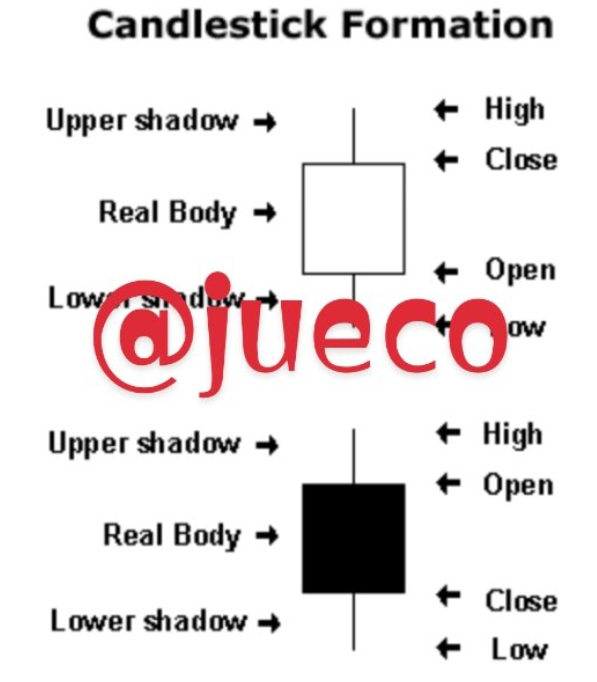
As seen above, every candle posseses a body which happens to be the central part of the Candlestick.
The upper shadow is also a part of the Candlestick and it happens to be the distance between the high and close of the Japanese candlestick.
The Japanese candlestick helps a lot in the Identification of trends in the market.
THE BULLISH CANDLE
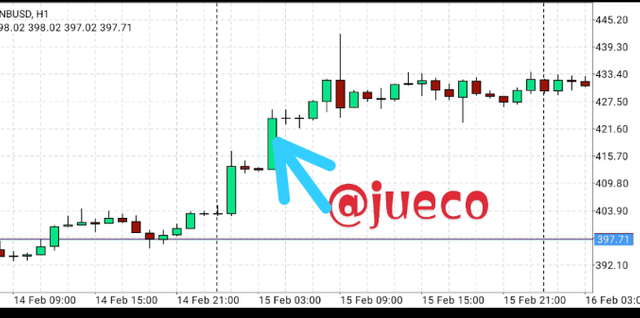
Screenshot from mt4
The bullish candlestick is a candle that appears when the price of a commodity has started increasing.
The formation of a bullish candle is an indication that the bulls are taking control over the market.
The bullish candle appears to be green in colour and this has been illustrated above, with it's opening price appearing before it's closing price.
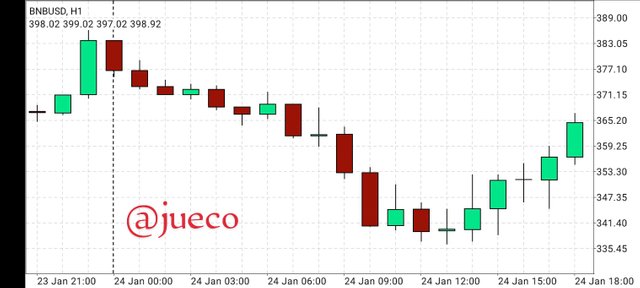
Screenshot from mt4
A bearish candle is a candle that indicates a fall in price of a commodity in the market.
It is usually red in colour and occurs mostly in a downtrend.
The appearance of a bearish candle is an indication that the bears are overpowering the bulls in the market.
And in a bearish candle, the closing price of the commodity appears before it's closing price.
Below is the screenshot of an uptrend and a downtrend of the Japanese candlestick chart.
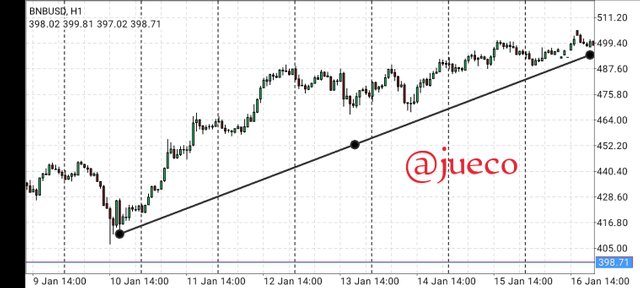
bullish trend from mt4
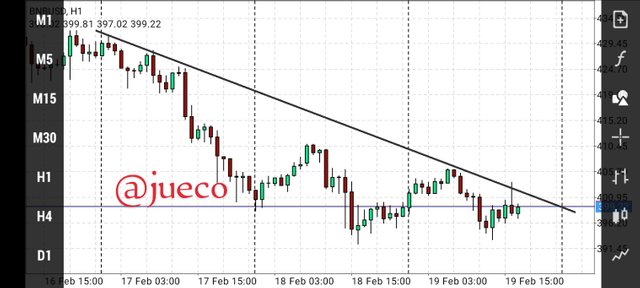
bearish trend from mt4
IMPORTANCE OF JAPANESE CANDLESTICK
The Japanese candlestick is very important in technical analysis as it helps us to easily identify resistance and support line which aid a good trading decisions.
The Japanese candlestick also helps to show the relationship between buyers and sellers in the market
It is highly compatible with other technical Indicator, thus assisting traders to increase their success rate.
The Candlestick helps traders to identify trend reversal and trend continuation, thus influencing their decision making.
Well from my view, I would prefer no chart pattern other than the Candlestick pattern, because, the candlestick pattern helps to show in details all activities going on in the market
What do you understand by multi-timeframe analysis? State the importance of multi-timeframe analysis.
I understand multitime frame analysis to be the act of examining the same currency pair using different time frequencies.
The use of multi time frame analysis is very important as it helps traders to confirm the signal gotten and to filter out noise from the market.
Multiframe analysis assist traders to increase their rate of success while trading, and minimize risk to the least possible.
IMPORTANCE OF MULTIFRAME ANALYSIS
The use of multiframe analysis helps analysts to confirm their signals, and this is done by analysing other time period of the market.
The use of multiframe analysis helps traders to minimize risk and maximize profit, as their signals will be reconfirmed on different time scale.
The use of multiframe helps to filter out noise from the market alongside filtering out false signals.
The use of multiframe analysis helps to make every detail of the market openly exposed, as some details hidden in a particular time frame will be exposed in another time frame
WITH THE AID OF A CRYPTO CHART EXPLAIN HOW WE CAN GET A BETTER ENTRY POSITION AND A TIGHT STOPLOSS USING MULTI-TIME FRAME ANALYSIS YOU CAN USE ANY -TIMEFRAME OF YOUR CHOICE
As an interday trader that I am how I do get better entry position, right STOPLOSS on any crypto pair and is by analysis or looking at the market from higher time frame then going down to lower time frame to look for entry position and confirmation.
For example I picked a pair and analysis the market on the 4hr -TIMEFRAME to look for my possible setup then I went to a lower timeframe such as 1hr to look for further confirmation such as chart pattern or candle stick pattern then I went to a more lower timeframe for entry position and a tight stop loss .
So to carryout this section of this week assignment ,I will be making use of the pair ETHUSD on daily timeframe before I make any trade I make sure I check for the following things
- the overall trend of the market and market structure
- prepare and predict the possible move
- look for confirmation on my smaller timeframe .
So on the chart ETHUSD DAILY I firstly identified the trend of the market as bullish trend because the market first made higher high and higher low respectively as seen in the chart I uploaded then I checked and identified the market structure. the market was seen to breakout from the trendline and then it came back to retest the previous resistance there by forming a double top which is a trend reversal confirmation.
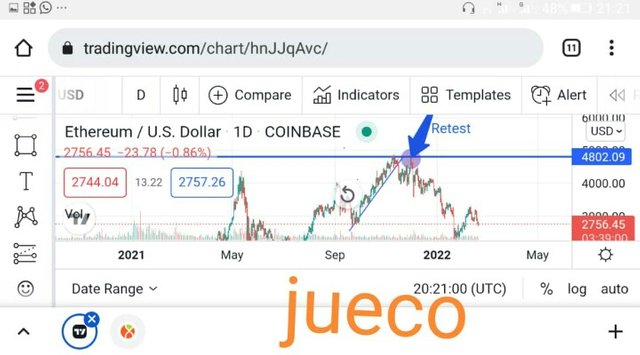
Screenshot taken from my trading view account.
Then i proceed to a lower timeframe one lower from the previous timeframe that is 4hrs time frame to check for more confirmations like a head and shoulder flags or candle stick pattern etc
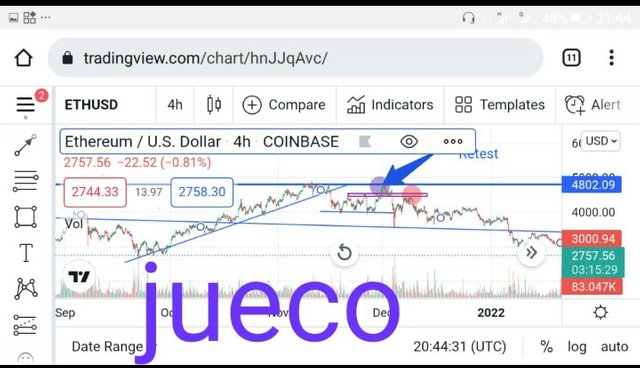
Screenshot taken from my trading view account.
On my chart above we could see a qml (quasimido pattern) which is a reversal pattern for the sell order I want to place.
The criteria for confirming the quasimido pattern ,price first moved to the upside breaking the 4hrs resistance zone by creating a new higher high then we also see price breaking the previous low to form a lower low which is a confirmation for a sell entry once price retest back to 4hrs resistance zone we can then look for sell entry on the lower time frame
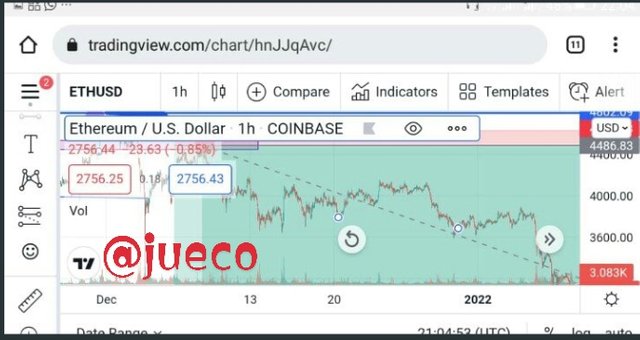
SCREENSHOT FROM TRADING VIEW
Screenshot from my trading view account
I spotted a double top on the resistance zone of 1h then took my sell entry from that zone with a tight STOPLOSS of 4.03% and a take profit of 34% reason for using a lower time frame for entry is because it gives a more defined entry position or sniper entry and tight stoploss
Carry out a multi-timeframe analysis on any crypto pair identifying support and resistance levels. Execute a buy or sell order using any demo account. (Explain your entry and exit strategies. Also, show proof of transaction).
For this assignment sake, I will be making use of multi time frame on DOGEUSD pair, then I'll carryout a trade using a demo account on that pair.
To carryout this assignment, I logged in to my trading view account as usual to carryout my analysis, I then open the pair DOGEUSD on a daily time frame .
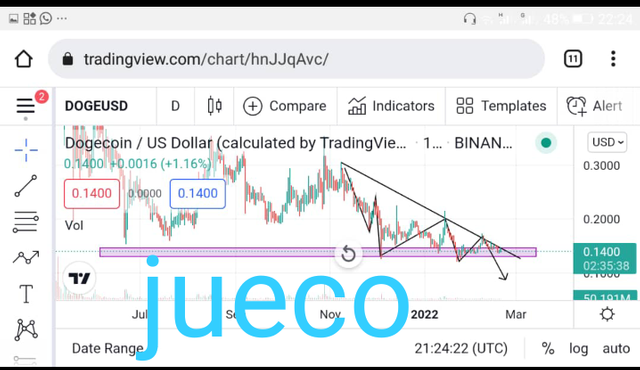
Screenshot from trading view
Currently, the market is on a bearish trend because of the formation of lower lows and lower highs.
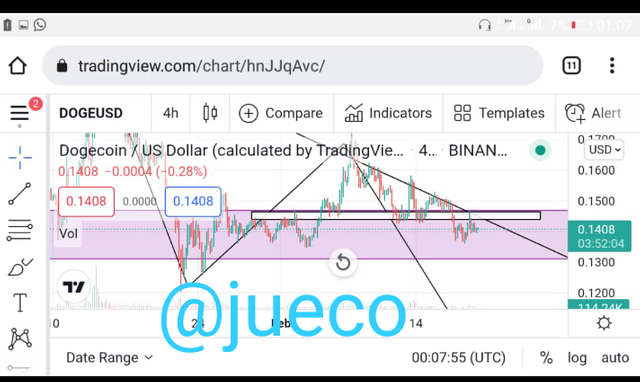
SCREENSHOT FROM TRADING VIEW
Going down to a lower time frame on the 4hr, the market still formed a bearish trend and broke below the support zone, and then retraced to retest the support zone which now acts as a resistance, thus signifying a trend continuation
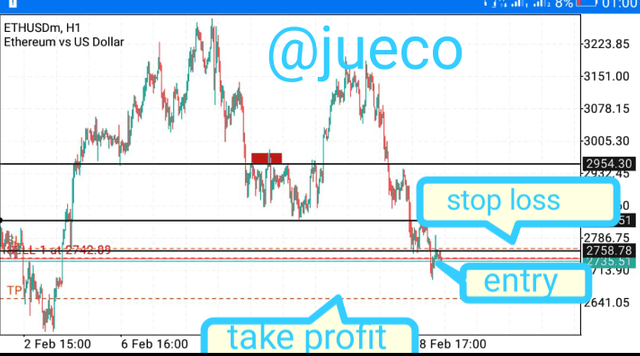
Screenshot from mt4
Screenshot from mt4
Screenshot from mt4
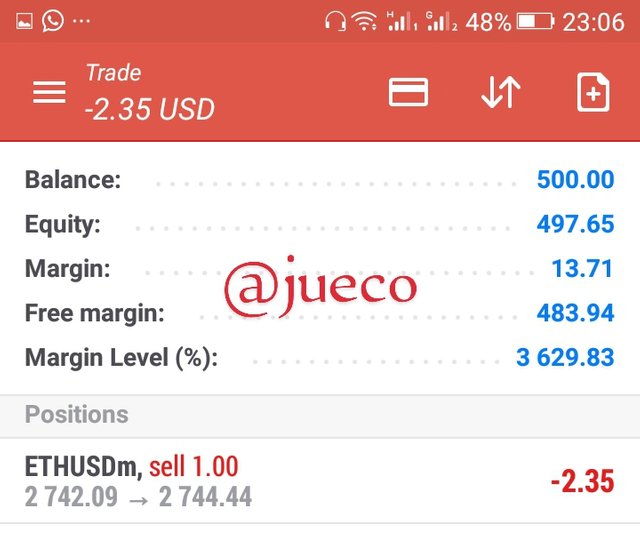
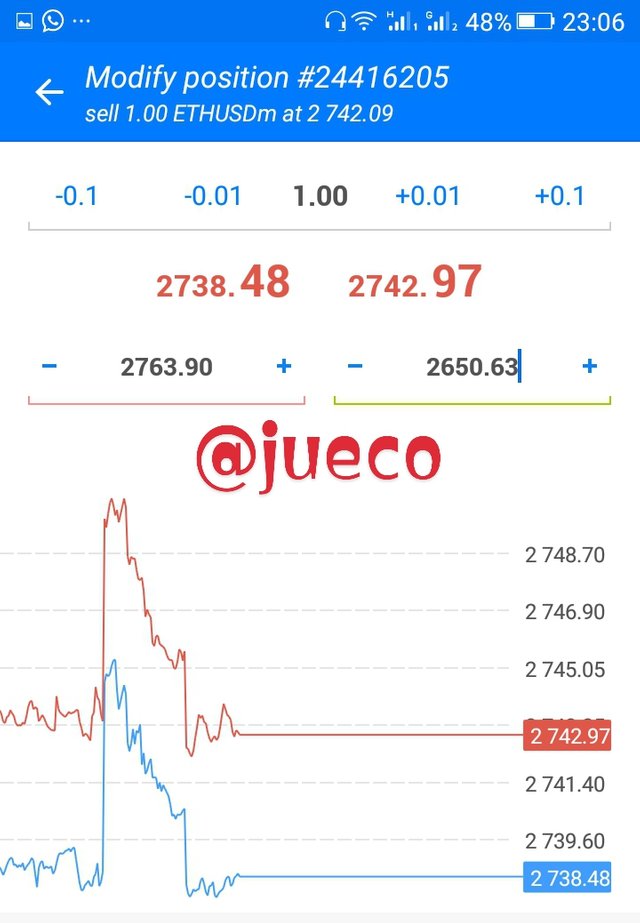
Then I went to my mt4 demo account to initiate a sell order with an entry point and a defined stop loss and also a take profit on the one hour time frame
CONCLUSIONS
Price action is very important in chart analysis, as it is relied on by traders to carryout effective chart analysis.
The Japanese candlestick chart is also another interesting chart analysis to explore, as it happens to be highly compatible with other technical analysis tool to give an effective results
