Hello Crypto friends,
I warmly welcome you to the beginning of Season6 of the steemit crypto academy, and I pray that as we begin this season together, we shall also end it together.
This is the first week of the steemit crypto academy and this week, we shall be learning from Prof @dilchamo on the topic Effective trading strategy using line charts.
Join me as we begin our fruitful adventure.
Define Line charts in your own words and Identify the uses of Line charts.
Define Line charts in your own words and Identify the uses of Line charts.
When we talk about technical analysis, there are diverse of tools and chart patterns that aids the effective study of the crypto market.
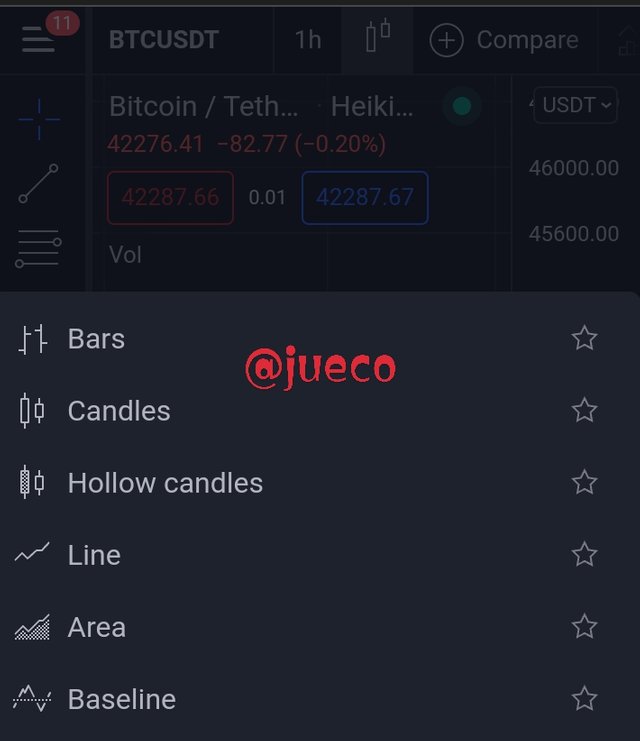
SCREENSHOT FROM TRADING VIEW
We have the Japanese candlestick pattern as seen above, we have the bar charts, hollow candles, line chart etc.
All of the above mentioned are effective tools that can be used to analyze the cryptomarket.
And we shall be discussing on line chart.
SCREENSHOT FROM TRADING VIEW
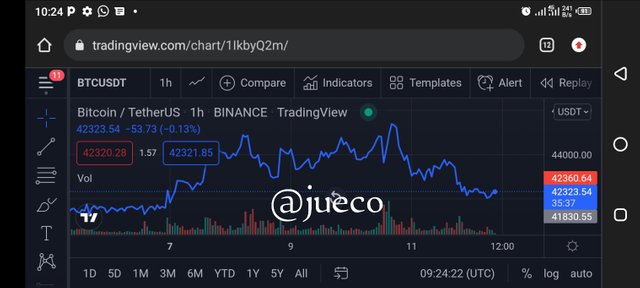
Line chart as seen above can be referred to a chart pattern that makes use of a single line to depict the market information, information such as market trends, resistance line etc.
Line chart can further be explained as a graphical representation of the tradable historical data of a commodity, in which points on it's price chart is connected by a single continuous line.
A line chart happens to be one of the easiest chart used in finance and it helps to show and connect only the closing prices of a commodity over a given period of time.
Due to the simplicity of a line chart by depicting only closing prices, this has help to decrease the noise from the market.
The screenshot displayed earlier is a clear view of a line chart with the crypto pair BTCUSDT, over an hour frame.
From the chart, we can see a line that connects the closing prices of the chart, this shows that it is a line chart.
USES OF LINE CHART
A line chart assist to give a clear Identification of price levels, for example, it helps to spot the key resistance and support levels.
A line chart helps to show an easily recognisable chart pattern as it is not disturbed by wicks, lows, highs, etc.
Due to its simplicity, line chart is used to help beginners develop basic chart reading skills, before they proceed to a more complex chart, like the Japanese candlestick pattern.
Another importance of line chart is that it allows the use of moving averages alongside it's analysis for effective results.
The line chart also have a high compatibility with other technical analysis tools, such as RSI, trend patterns, resistance and support levels, etc.
Line chart operates in a way that makes it easy to recognize it's market trend without the use of trend based Indicators.
How to Identify Support and Resistance levels using Line Charts (Demonstrate with screenshots)
How to Identify Support and Resistance levels using Line Charts (Demonstrate with screenshots)
The Identification of the resistance and support levels is one of the key things all traders needs to know, without the knowledge of resistance and support levels, it will be difficult for a trader to effectively analyse the cryptomarket.
Join me as we learn what the support and resistance line is.
Support line
The support level can be explained to be a price point on the crypto chart where a maximum demand over a commodity is expected.
Whenever the price of a commodity drops to the support level, it is more likely to be rejected and bounce back, that is , the continue in the reverse direction.
The support level is a critical level traders look for in a bearish market, inorder to aid them predict the next price action of the market.
The support level is usually located below the current market price by an horizontal line drawn across the chart.
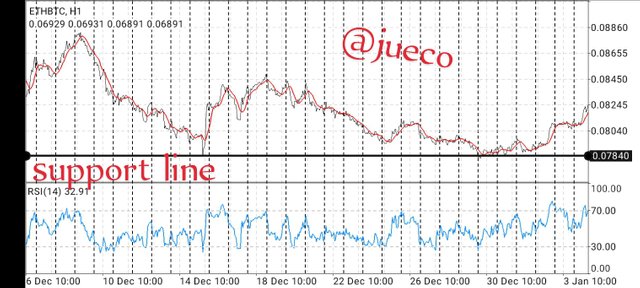
SCREENSHOT FROM MT4
The above screenshot shows an ETHBTC line chart using a 1 hour frame, and as seen above, the support line is clearly indicated just below the current market price.
RESISTANCE LEVEL
The resistance level of a chart can be explained as a point on the line chart where the price of a market has had difficulty in exceeding at a given period of time.
It is a level where a maximum supply of commodity is expected, that is, the point where the effect of more sellers are experienced in the market.
Whenever the price of a commodity climbs to the resistance level, it is more likely to be rejected, since it had an issue exceeding that level previously.
The resistance line is an horizontal line that usually connects the highs of the price chart and it is usually located above the current market price
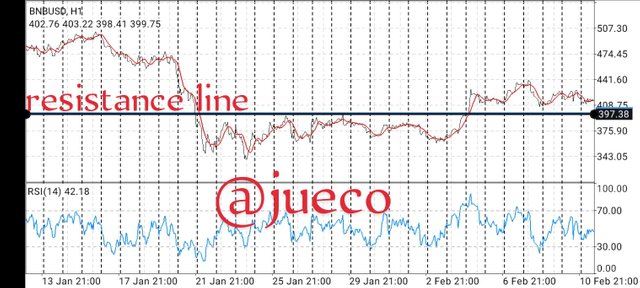
SCREENSHOT FROM MT4
The screenshot above is a BNBUSD pair of a line chart l, with it's resistance line clearly indicated.
As seen, the resistance line, connect the highs of the line chart over a given period of time.
Differentiate between line charts and Candlestick charts.(Demonstrate with screenshots)
Differentiate between line charts and Candlestick charts.(Demonstrate with screenshots)
As explained from the beginning, we have diverse of charts used in the cryptomarket, the bar chart, line chart, area, bases and candlestick chart.
The above mentioned charts posseses some similarities alongside some differences, which makes one preferable to the other.
Join me as we consider their differences.
| LINE CHART | CANDLESTICK CHART |
|---|---|
| The line chart connects only the close price of a commodity in the market | Candlestick openly displays, not only the lows in a chart but also the highs, the open, the close etc. |
| It is a price chart that is made up of a continuous line | It is a chart that consist of different candles, in different colours and species. |
| Line chart gives simple and little information on the condition of the market | It gives a full detail on the condition of the market, as it shows when the bulls are taking over the market |
| The line chart filters noise from the market | The candlestick chart consist of noise from the market. |
| The line chart is very easy to understand due to its simplicity and because of this, it is used to tutor beginners | The candlestick is a more complex chart to analyze, as it consists of highs, lows, higher wick, lower wick etc |
| The line chart is not compatible with volatility based Indicators as it does not display the lows and highs of prices | The candlestick chart is highly compatible with volatility based Indicators |
| Line chart does not possess a bullish not bearish pattern | It possess bullish and bearish pattern, for example, shooting star, evening star, morning star, etc |
The below screenshot are clear example of a line chart and a Japanese candlestick chart.
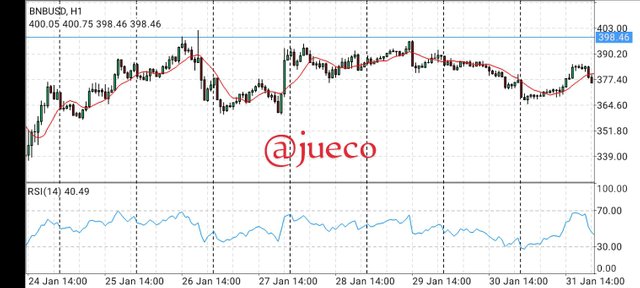
SCREENSHOT FROM MT4
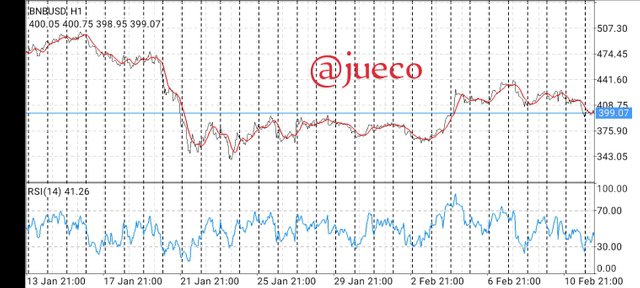
SCREENSHOT FROM MT4
Explain the other Suitable indicators that can be used with Line charts.(Demonstrate with screenshots)
Explain the other Suitable indicators that can be used with Line charts.(Demonstrate with screenshots)
Yes, one of the unique properties of line chart is it's compatibility with technical Indicators.
The line chart is highly compatible with moving averages. As we all know, moving average supplies resistance in bearish trends.
The thumb rules states that the larger the time frame in a chart, the stronger the resistance and support becomes and also, the higher the moving averages the mightier the resistance and support of the price.
When trading using moving average, a traders needs to constantly remember that the moving average shows the strength of a market trend, this implies that the closer the price gets to the average, the weaker the trend becomes until it finally breaks.
And because of this rule, a trader is expected to trade when the price tests the averages.
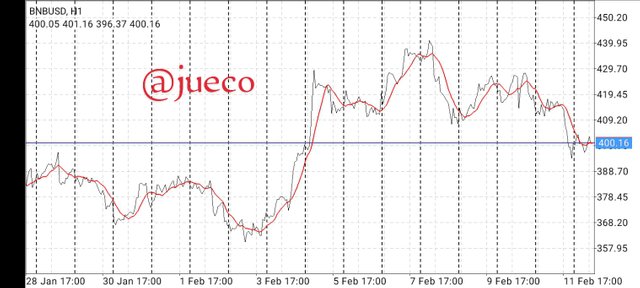
SCREENSHOT FROM MT4
The above is a screenshot of a line chart, used alongside a moving average.
Also the line chart is highly compatible with RSI indicator.
The RSI Indicator helps to show the overbought and oversold regions in the market, which enables traders to predict the next Price action of the market.
The RSI indicator looks exactly like the line chart and it moves within levels.
When it moves across the 70th level, it can be referred to an overbought and when it moves below 30, it can be referred to an oversold.
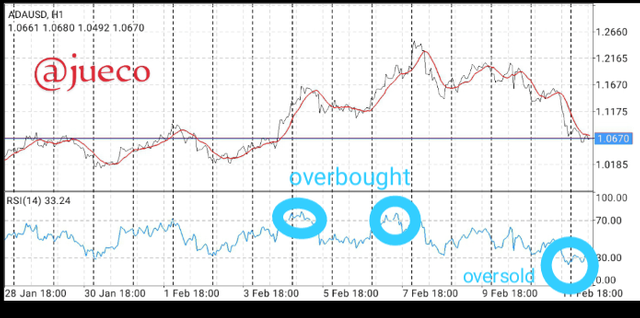
SCREENSHOT FROM MT4
The screenshot above is that of the pair ADAUSD, indicating the compatibility of linechart, RSI and moving average.
Prove your understanding of bullish and bearish trading opportunities using line charts [demonstrate with screenshot]
Prove your understanding of bullish and bearish trading opportunities using line charts [demonstrate with screenshot]
In technical analysis, there exists three phases of a market; the Bullish phase, the bearish phase and the ranging phase and within this phases are good trading opportunities.
BULLISH TREND
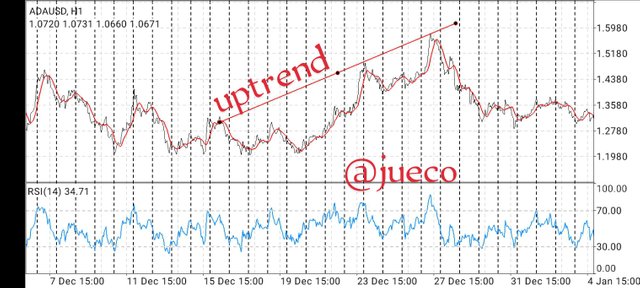
Screenshot from mt4
Which is not new to us that a bullish phase is a phase that occurs when the market is in an uptrend.
This means that there is a constant increase in the price of the commodity, which shows that there are more buyers in the market.
A bullish market consist of higher highs and higher lows of price point on the chart of consideration, also indicating that the bulls are in control of the market.
A bullish trading opportunity can be explain as a chance noticed by traders to enter a bullish market, and it is advisable to enter a buy market for a bullish trend.
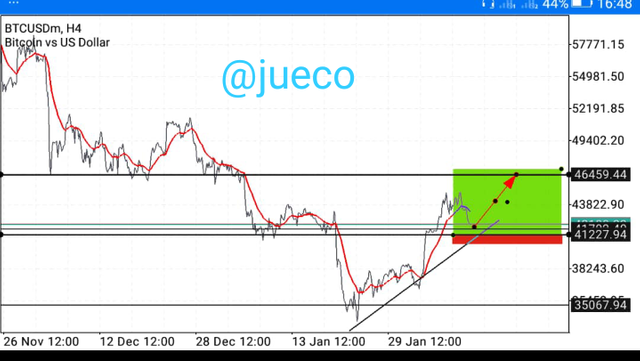
Screenshot from MT4
From the screenshot above, we can see the chart experiencing an uptrend, it went upward until it broke it resistance line and then retrace back to retest the former resistance line which will now be acting as a strong support.
The point of retest is a good entry point, as the price of the commodity is expected to be rejected, thus continuing in an uptrend.
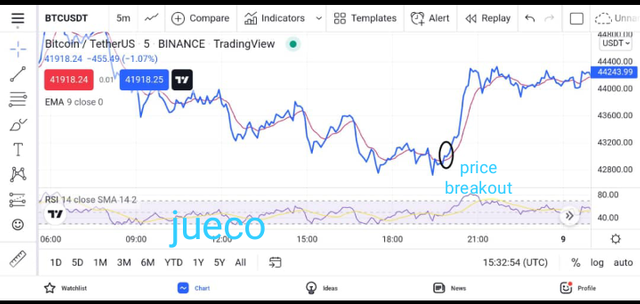
Screenshot from trading view
From the above screenshot, we can see that the EMA is trending above the price chart which indicates a bearish movements.
I then waited for the line to break above the moving average which signals a bearish to bullish trend reversal. Then after the breakout, one can successfully open a buy position or better still wait for the price to retest on the moving average which now acts as a support before placing a buy order
BEARISH PHASE
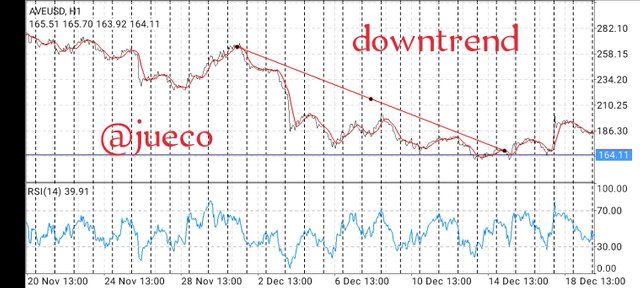
Screenshot from MT4
A bearish phase as we know is a situation where there's decrease in the price of a commodity.
It is a situation that depicts that the bears are taking control over the market and it consists of lower lows and lower highs.
The signal of a bearish phase is a good point to enter the market and place a sell order, as the price of the commodity is promising to decrease and continue in a downtrend.
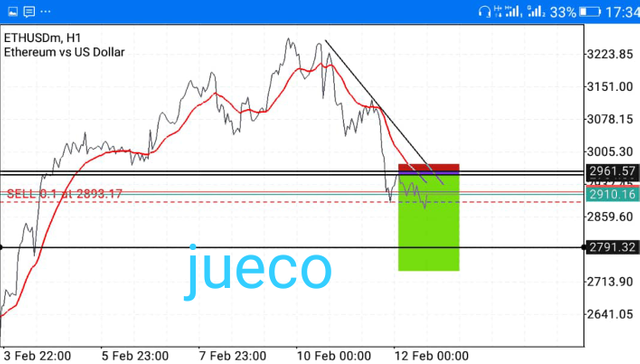
Screenshot from MT4
The screenshot above shows a downtrend, it decreases to the point where it eventually broke it's support level and retraced to retest it's broken support level which is now acting as a resistance.
The point of retest is a good entry point because the price is expected to be rejected and retrace back to continue it's downtrend
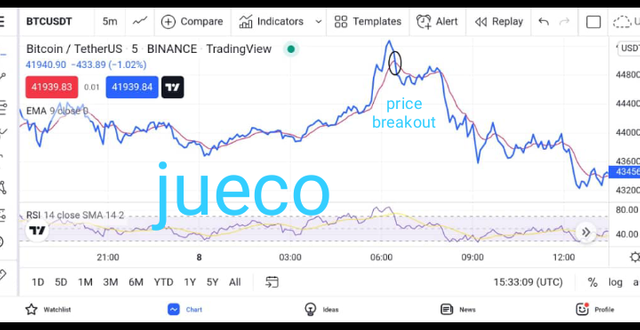
Screenshot from trading view
The screenshot above is the chart of BTCUSDT alongside a moving average.
As seen above, the EMA trending below the price chart which indicates a bullish move.
I then waited fro the price chart to break below the moving average, which indicates a bullish to bearish trend reversal. After the breakout, we can enter a sell position or wait for the price to retest on the moving average, which now serves as a confirmation.
Investigate the Advantages and Disadvantages of Line charts according to your Knowledge.
Investigate the Advantages and Disadvantages of Line charts according to your Knowledge.
ADVANTAGES OF LINE CHART
Line chart helps to filter away noise from the market which makes it very easy to analyze
Line chart helps to show the exact area on a chart, areas like the resistance level, the support level, etc
Line chart is user friendly and very easy to understand, which is one reason it is used to develop the analysis skills of beginners
Line chart makes the Identification of market trends very easy which in turn helps traders to make good trading decisions.
DISADVANTAGES OF LINE CHART
One of the disadvantages of line chart is that it connects only the closing price of a commodity
Line charts does not give full details of the market conditions, details such as highs, lows etc
Line chart does not possess bearish nor bullish trend patterns for easy prediction of market trend, pattern such as shooting star, bullish engulfing, morning star.
Line chart does not provide traders with the full activities of buyers and sellers in the market
Line chart is not compatible with volatility based Indicators because it doesn't display the lows and highs of prices.
CONCLUSIONS
Line chart is indeed a very easy chart to understand, it helps beginners a lot to develop their chart analysis skills before they can advance to candlestick chart.
The line chart also helps to filter out noise from the market, thus making its analysis very easy.
I appreciate Prof @dilchamo for her work, look forward to your next lecture Prof