Hello friends,
With joy of heart and soul, I humbly welcome you to my week2, Season5 assignment post of the crypto academy.
In this post we shall be learning of patterns in trading and I am happy to participate in this week assignment.
Without wasting much time, shall we proceed to the first task of the post
WHAT IS YOUR UNDERSTANDING ABOUT TRIANGLES IN TRADING. EXPLAIN ALL FORMS OF TRIANGLES IN YOUR OWN WORDS (SCREENSHOT REQUIRED)
WHAT IS YOUR UNDERSTANDING ABOUT TRIANGLES IN TRADING. EXPLAIN ALL FORMS OF TRIANGLES IN YOUR OWN WORDS (SCREENSHOT REQUIRED)
It will be so unprofessional to discuss on triangles in a a trade without first explaining briefly what trends are.
As I learnt from the previous professor, reminiscence01 on his lecture concerning trends, and compiling the knowledge with my research, I learnt that trend is the movement of price in one direction.
I also learnt that a trend can move in three directions, it can move upwards which is a bullish move known as an uptrend, it can also move downwards which is a bearish move and it is known as a downtrend and finally, it can move sideways which is known as market ranging.
A bullish trend consist of higher lows and higher highs while a bearish trend consist of lower low and lower highs.
From my view point, triangles in trading are continuation patterns that are formed by joining trendlines, either a bullish trendline or a bearish one along a convergence of a price range, thus denoting an halt in the prevailing trend.
In the formation of triangle patterns, the lower and upper trendlines meet on the right hand side of the chart, hereby forming an edge or a corner.
This continuation trend is named a triangle pattern because when the beginning of the upper trendline is connected to the start of the lower trendline, it forms a triangle.
The triangle patterns are usually formed at the middle of a chart and it can either denote a continuation pattern if it is validated or a strong reversal pattern, it it's event fails.
FORMS OF TRIANGLE
There are three forms or triangles in trading, they are;
- Ascending Triangle
- Descending Triangle
- Symmetrical Triangle.
ASCENDING TRIANGLE
An ascending triangle is a continuation pattern that is usually formed in a bullish trend.
It is known as a breakout pattern that is created when the prices breaks above the upper horizontal trend line.
In the formation of an ascending triangle, there must exist an upper horizontal trendline, acting as a resistance level and joining various similar highs of nearly equal levels.
And there must also exist a lower trendline, rising diagonally in a gradual process, joining higher lows.
This lower trendline indicates the patience of the buyers as they gradually enter into the market, and it eventually indicates the rush of buyers as they fomo into the market as a result of lack of continuous patience, this thus forms a a huge increase in the price of the commodity.
When the above explained have taken place, the former upper horizontal trendline which was acting as the resistance, will now act as the support.
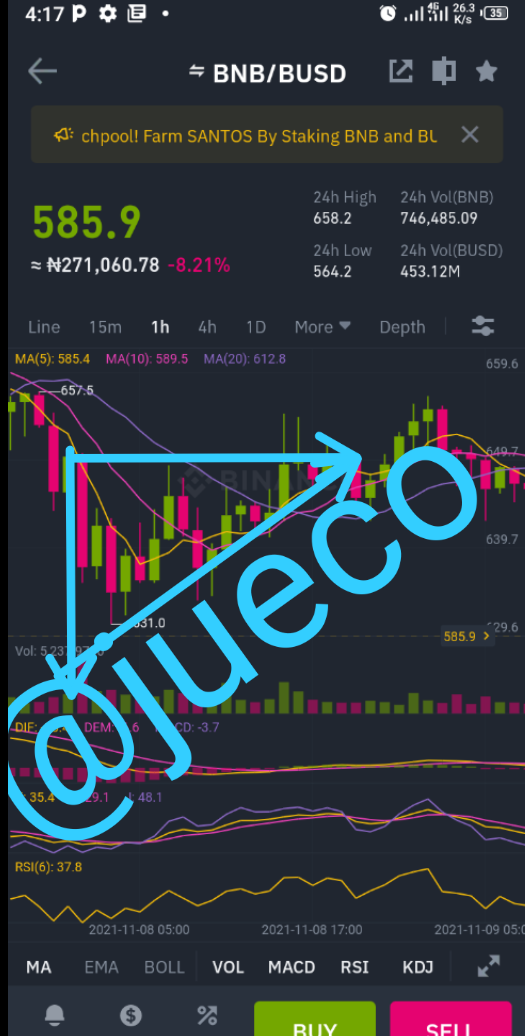
SCREENSHOT FROM BINANCE
The above is a screenshot showing an ascending triangle of the pair BNB/USDT from my binance app.
DESCENDING TRIANGLE
A descending triangle is the reverse of the ascending triangle.
It is a reversal pattern that is formed on a bearish chart. It is also known as a breakdown pattern that is formed when the prices breaks below the lower horizontal trendline.
In the formation of a descending triangle, the lower trendline must be horizontal in nature, thus acting as a support and at the same time joining lows of nearly equal levels.
There must exist an upper trendline, decreasing diagonally and joining lower highs together. The upper trendline line depicts the rate at which traders exit the market, out of fear of loosing.
In the formation of a descending triangle, the downtrend continues and finally break below the lower horizontal trendline, therefore causing the lower trendline to no longer act as a support but as the resistance.
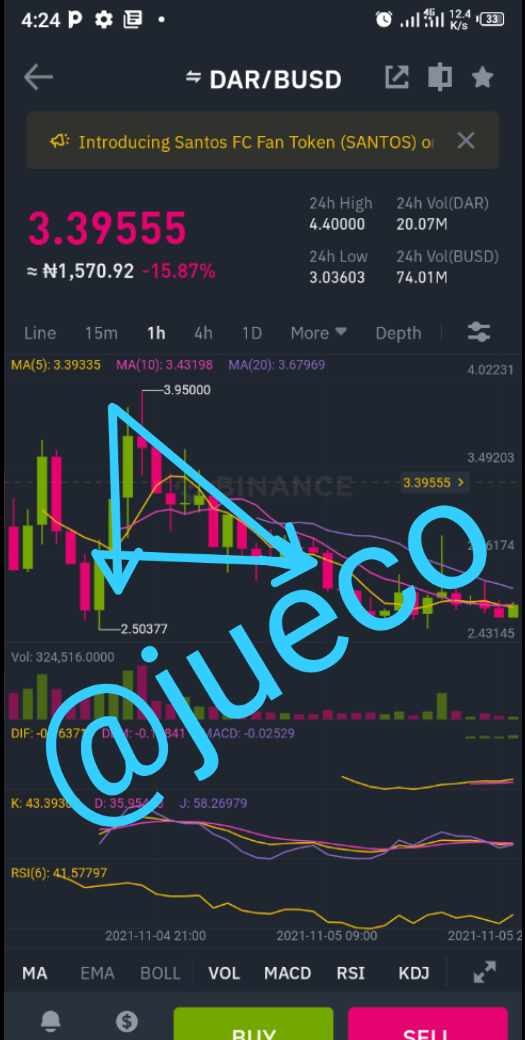
SCREENSHOT FROM BINANCE
The above screenshot is one showing a descending triangle of the pair DAR/BUSD from my binance app.
SYMMETRICAL TRIANGLE
A symmetrical triangle is quite different from the above explained triangles.
From the above explained, we noticed that there is always a display of an horizontal trendline, either an upper one or a lower one, but that is different with the symmetrical triangle.
A symmetrical triangle consist of a lower diagonal bullish line and a corresponding upper diagonal bearish line.
The lower bullish trendline joins the higher lows and the upper bearish trendline joins the lower high and by thus doing, there will be a convergence of both lines
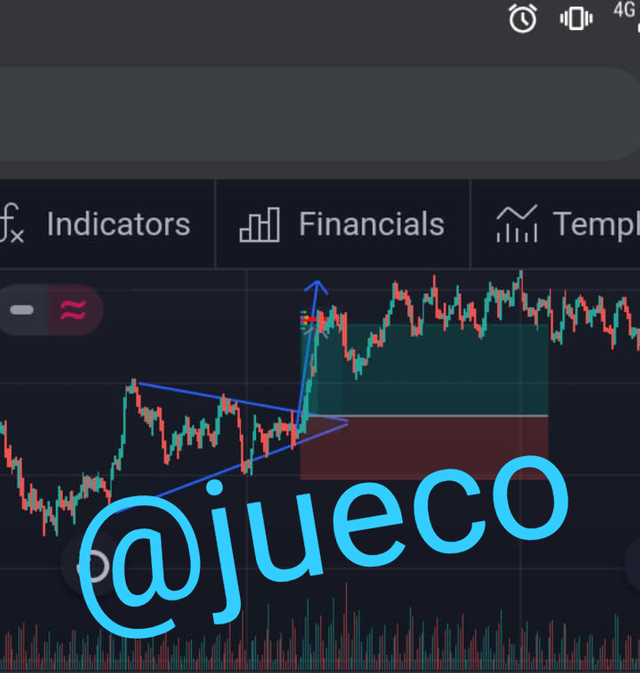
SCREENSHOT FROM TRADING VIEW
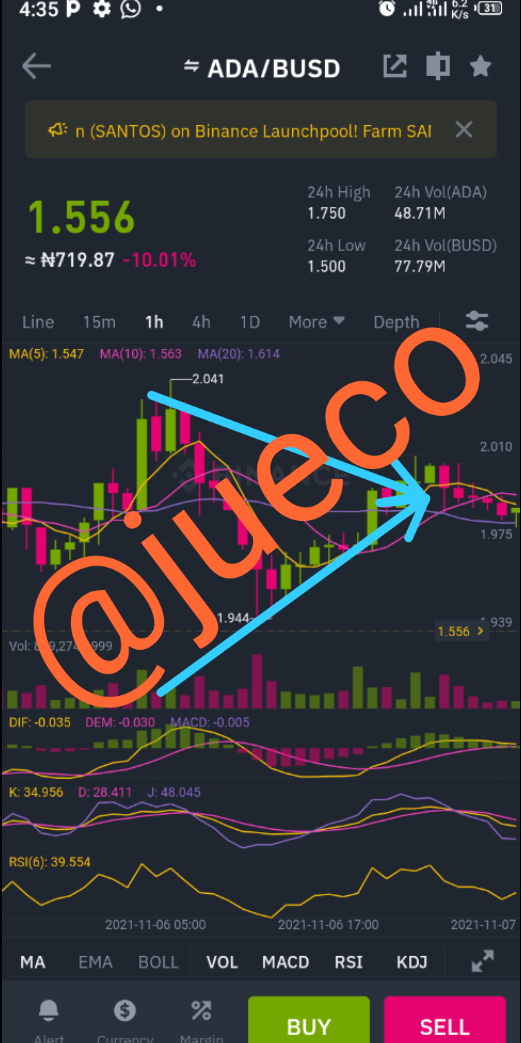
SCREENSHOT FROM BINANCE
Having considered this, shall we proceed to the next task.
CAN WE ALSO USE SOME INDICATORS ALONG WITH IT TRIANGLE PATTERNS? EXPLAIN WITH SCREENSHOTS
CAN WE ALSO USE SOME INDICATORS ALONG WITH IT TRIANGLE PATTERNS? EXPLAIN WITH SCREENSHOTS
In technical analysis, it is always best to make use of more than tools, this helps produce accurate signals to traders.
This principle does not exclude the use of triangle patterns, it is also advisable to use other technical analysis tools alongside the patterns.
Fortunately, the Japanese candlestick allows the use of patterns and other tools on a chart.
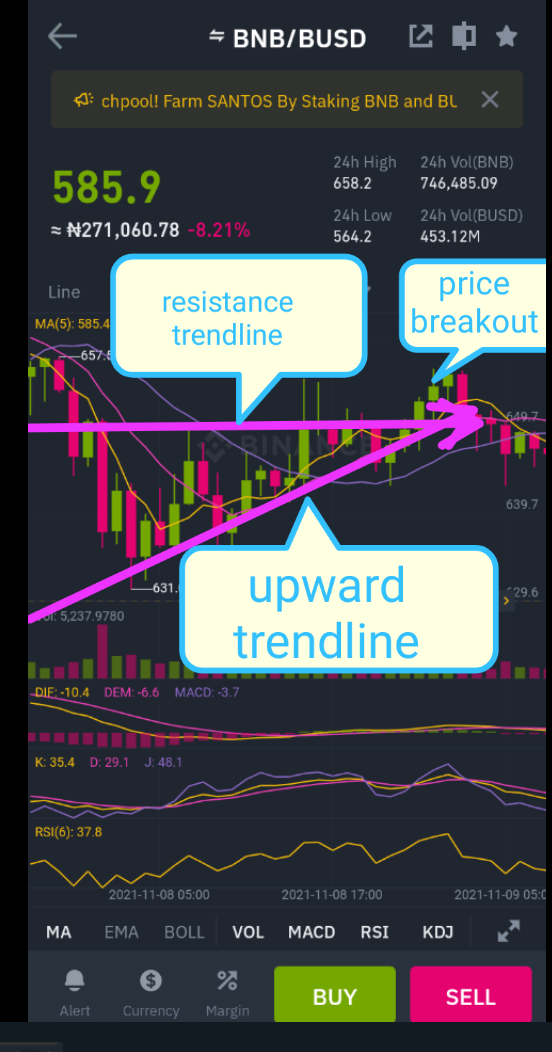
SCREENSHOT FROM BINANCE
From the chart above, the resistance trendline is clearly seen as well as the upward trendline.
From the screenshot above, we can see the application of numerous technical Indicators, indicators like the moving average, MACD, RSI KDJ AND VOL.
This Indicators, each have their function, the moving average assisted me to identify easily the overall trend of the market. And from this analysis, I can see the breakout as a good opening price.
Permit me please, to proceed to the next task of this assignment.
EXPLAIN FLAGS IN TRADING IN YOUR OWN WORDS AND PROVIDE SCREENSHOT OF BOTH BULL FLAG AND BEAR FLAG.
EXPLAIN FLAGS IN TRADING IN YOUR OWN WORDS AND PROVIDE SCREENSHOT OF BOTH BULL FLAG AND BEAR FLAG.
In a literal sense, a flag is a piece of decorated cloth that serves as sign or signal of identity
When it comes to trading, a flag is a price pattern that is formed when there is a strong immediate move in a trend, and this move counters the already existing trend on a chart.
A flag pattern is named a flag pattern because of its looks, it brings the picture of a flag to the mind of its examiner.
The flag pattern is often used as a means to identify if the continuation of the previous trend is possible.
In other words, flag pattern can be said to be an immediate counter trend ( the flag) prevailing over a short lived trend which is known as the flag pole.
Flag patterns exit in two phases, it is either trending upward which is known as a bullish flag or it is trending downward which is known as a bearish flag.
The bullish and bearish flag patterns are of almost the same structures but different direction.
Flag patterns are characterized by some unique features which are: The preceding trend, the volume pattern, the breakout, the pattern consolidation area.
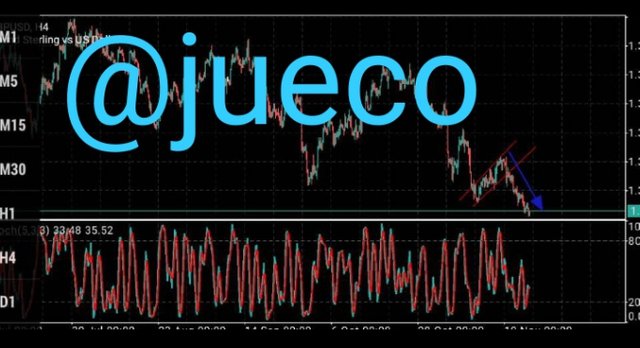
SCREENSHOT FROM MT5
The above screenshot depicts a bear flag, and in a bear flag, the body is usually formed at the bottom of the chart.
The bear flag consist of the bearish candle which act as the flag pole, it also consist of an upperline which is the resistance line and a lower line which is the support line.
The combination of the support and resistance lines gives the shape of the flag.
In a bear flag, the breakouts are meant to be in a downward move.
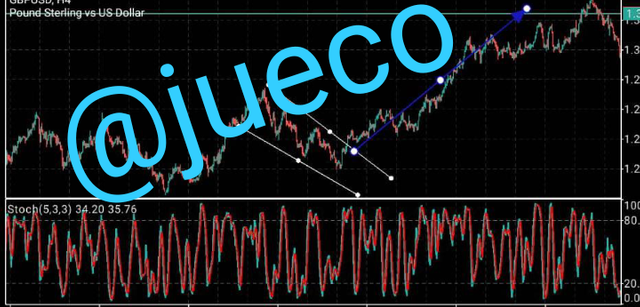
SCREENSHOT FROM MT5
The above screenshot depicts a bullish flag pattern.
A bull flag pattern is characterized by a sharp rise which signifies the pole and then followed by the flag which is denoted by a rectangular price chart.
In a bull flag, the price increases during the first trend move and then decreases through the rectangular price chart known as the consolidation area.
Shall we match to the last task of this assignment
SHOW A FULL TRADE SET-UP USING THESE PATTERNS ON ANY CRYPTOCURRENCY CHART (ASCENDING TRIANGLE, SYMMETRICAL TRIANGLE AND BEAR FLAG)
SHOW A FULL TRADE SET-UP USING THESE PATTERNS ON ANY CRYPTOCURRENCY CHART (ASCENDING TRIANGLE, SYMMETRICAL TRIANGLE AND BEAR FLAG)
ASCENDING TRIANGLE
To carryout this task using ascending triangle, one has to first identify the triangle on the chart, and the ascending triangle is characterized by an upper horizontal trendline, acting as the resistance and a diagonal gradually increase trendline.
A trader also have to identify the breakout, that is the point where the resistance is broken and then patiently wait for it's confirmation using a second bullish candle.
Once this has been confirmed, the trader can now proceed to enter the market and open a buy, sell and take profit position.
The buy position should be on the third bullish candle confirming the breakout, the sell should be below the support line while the take profit should be above the triangle.

SCREENSHOT FROM BINANCE
SYMMETRIC TRIANGLE
The symmetric triangle has to be identified and we know the make-up of a symmetric triangle.
It consists of an ascending lower trendline and a descending upper trendline.
To perform this operation on this triangle, the trader has to wait for a breakout of the price and then confirm the price direction, one this has been done, he can them proceed to enter the market.

SCREENSHOT FROM TRADING VIEW
BEAR FLAG
Once a bear flag has been identified, the trader can proceed to enter his trade after patiently waiting for confirmation.
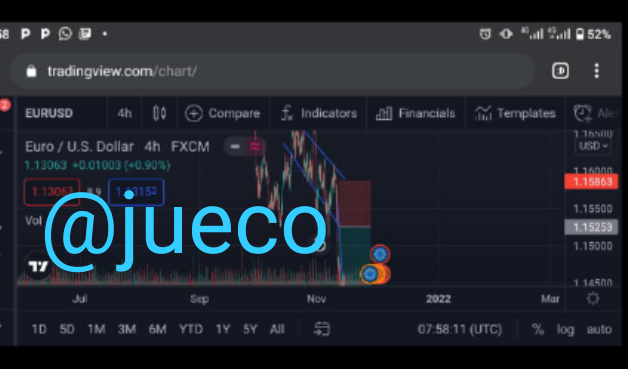
SCREENSHOT FROM TRADING VIEW
The above is a screenshot from trading view showing a bear flag and it's set up.
CONCLUSIONS
CONCLUSIONS
Indeed the application of triangles to trading is very important, as it helps to identify the next price move and also explains extensively the nature of the market.
I thank Prof @sachin08 for his lecture, I look forward to your next lecture Prof.
All pictures were gotten from binance, mt5 and trading view application

Hello Prof @sachin08, please it's days now and my homework post have not been curated by @steemcurator02, please help me call the attention of the team.
CC @sapwood
Downvoting a post can decrease pending rewards and make it less visible. Common reasons:
Submit