
Hello dear friends,
I believe you are all doing fine and great, I am glad to welcome you to my assignment post for professor @pelon53, please join us as we begin
Explain in detail the advantages of locating support and resistance on a chart before trading.
Explain in detail the advantages of locating support and resistance on a chart before trading.
Before we can be able to explain in detail the advantages of support and resistance levels, it is best we first understand properly what a resistance and support line is.
The resistance and support level is one of the most important trading techniques used in trading as it is highly compatible with other trading strategies, like the flag pattern, double top, double bottom, etc.
SUPPORT LEVEL
The support level can be explained as the price level that a commodity find difficult to break through for a specific period of time
It is a line that connects the lows of the chart over a period of time and it can be an horizontal line or a sloppy line.
The principle behind the support level is that, whenever a price gets to a strong support line, it is expected to be rejected, thus moving in the opposite direction.
The reason behind this is because the support level happens to be a price level where the demand (buyer power) is stronger than the Supply (selling power).
And this is so because the closer the price gets to the support level, the less costly the price becomes. And the buyers take this as a good opportunity to enter the market and buy lots of the commodity at a cheap rate.
With this, we can see why the bulls dominate the market whenever the price gets to it's support line.
The formation of a support line is usually confirmed when the price has attempted multiple times to break through but failed and the support zone is usually stronger when analysed on a larger time frame.
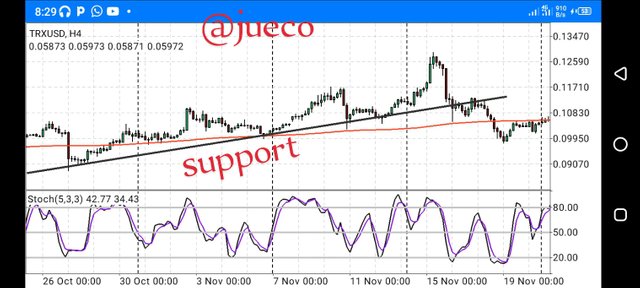
Screenshot from mt4
The resistance line can be explained as a Price level in a price chart, where the market always has difficulty to break through, whenever it rises to that stage.
As it is known, whenever a price hits a strong resistance line, it is usually rejected, thus pushing the price in a downward trend.
The principle behind the resistance line is that whenever the price gets close to the resistance line, the price of the market increases, thus attracting lots of sellers to the market, which will then prevent the market from rising any further.
The formation of resistance line is confirmed when there are at least 2 or 3 touches on the line.
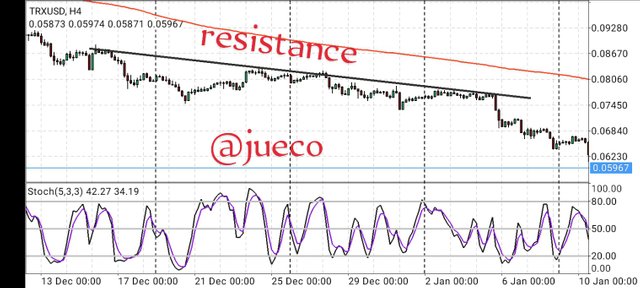
Screenshot from mt4
The screenshot above is one that shows the formation of resistance line in a price chart.
IMPORTANCE OF RESISTANCE AND SUPPORT LEVEL
The proper analysis and Identification of the resistance and support line helps traders to predict the next trend formation of the market.
For example, if the market was in an uptrend, forming higher highs and higher lows, then it fails to form new high, and it then broke it support level. As an experience trader, one will discern that to be a bearish trend reversal signal.The understanding of support and resistance line assists a trader to know when to enter the market and exit the market.
For example, if market was in a consolidation zone, then it broke below it support line and retraced to retest it's broken support level, which is now a strong resistance line.
As an experience trader, I will discern this to be a good sell order signal, as the price will be rejected, thus continuing in a bearish move.
- Also with the help of resistance and support line, a trader will be able to reduce risk and maximize Profit.
He will do so by placing his stop loss and take profit at the right position.
As it is known, if a trader is entering a buy position in an uptrend, the stoploss should be placed below the horizontal support level, incase there are pull backs and price retest.
The support and resistance levels helps to tell the condition of the market and the activities of the buyers and sellers.
For example, whenever the price is approaching it's resistance level, we know that the buyers are dominating, but when the price gets rejected at the resistance line and begins declining, we know that the sellers are dominating.The use of resistance and support line helps traders to discern the overall trend of the market, despite it's volatility and manipulation.
The resistance and support level trading strategy is one that is compatible with other technical technique and indicator, and this is an added benefit.
Explain in your own words the breakout of support and resistance, show screenshots for the breakout of a resistance, use another indicator as a filter
Explain in your own words the breakout of support and resistance, show screenshots for the breakout of a resistance, use another indicator as a filter
When trading using resistance and support levels, traders are always on the watch for 3 key things; price breakout, price retracement and price retest.
Price breakout can be explained as a phenomenon whereby the price crosses through its resistance/support line and thus continue in the direction of the breakout.
The breakout of prices on the resistance and support levels signals either a trend continuation or a trend reversal.
A trend continuation breakout is said to occur when the price breakout occur in alrey existing trend
For example, in an uptrend, a trend continuation breakout is usually confirmed when the price breaks above it's resistance line, then retraces back to retest it's already broken resistance line which is now acting as a strong support.
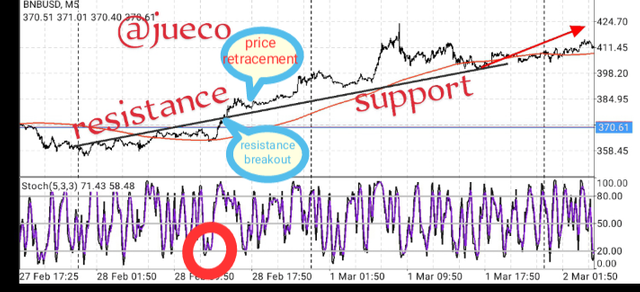
Screenshot from mt4
The screenshot above is that if BNBUSD on a 15min time frame. As seen above, the market was in an uptrend, forming higher highs and higher lows, and making multiple touches on its resistance line as it progresses upward.
It then broke above it resistance line, and retraced back to retest the broken resistance line which is now acting as a strong support.
As seen above, after the retest, the price was rejected by it's support level, which thus kept the market projecting upwards.
Also I used the stochastic Indicator to confirm this signal, as seen on the screenshot, my stochastic Indicator was in an oversold region, thus indicating a bullish trend move.
This kind of breakout on the resistance level is a trend continuation breakout.
A trend reversal breakout is said to occur when the price breakout occurs in a new trend of the market, usually signaling a reverse movement in the direction of the previous trend.
A trend reversal breakout usually indicates the weakness of either the buyers or sellers in the market.
The formation of a trend reversal breakout in a bearish trend usually indicates that the sellers are exhausted and they can no longer push the price downwards.
It also indicates the strength of the bulls as they are about to take over the market by forming new higher highs and higher lows.
A trend reversal breakout can be said to have occurred in a downtrend when the price fails to form new lows but instead, it broke above it's resistance line and then retraced back to retest the broken resistance which is now acting as a strong support line.
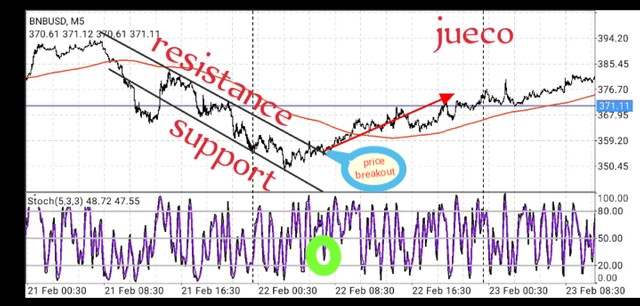
Screenshot from mt4
The above screenshot is that of BNBUSD on a 15min time frame.
The chart is was in a bearish trend, consisting of lower lows and lower highs and also making multiple touches on the resistance and support line.
Then, due to the weakness of the sellers, the price could no longer form new lows, it then broke it's resistance line which is as a result of the pressure mounted by the buyers, retraced and retested it's broken resistance which is now acting as a strong support.
As seen above, when the price retested it's support, it was rejected, thus confirming a bullish move.
Also, confirming this signal with my Indicators, it is seen that on the point of the breakout, the stochastic Indicator was in an oversold region, which is signaling that the bulls are about to take over the market
The price outbreak that occurred in the chart above is a good example of a trend reversal breakout.
The above explained are price breakout on a diagonal resistance line.
There is also the formation and breakout on a horizontal resistance line, and this mostly found in a ranging market.
A ranging market is a market condition n which neither the buyers nor the sellers are controlling the market.
It is a state of indecision In the market.
In a ranging market, it is usually difficult to predict the next price move without the use of resistance and support levels.
In a ranging market, whenever the price breaks above the resistance line, it usually indicates a bullish move, although there are false breakout which can be filtered with the use of Indicators.
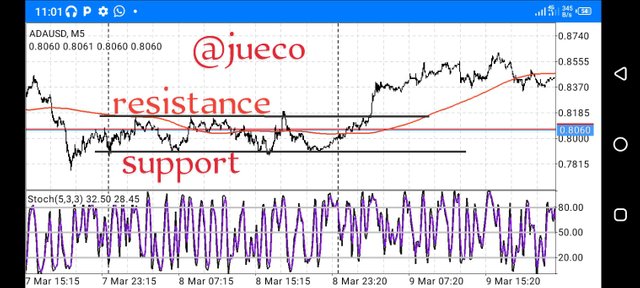
Screenshot from mt4
The above screenshot is that of ADAUSD on a 15min time frame.
As seen above, the price was ranging, then it finally broke above it's resistance line, which is a signal for a bullish move.
Show and explain support breakout, use additional indicator as filter, show screenshots.
Show and explain support breakout, use additional indicator as filter, show screenshots.
As earlier explained, the resistance and support line are regions on a price chart where there's is usually a pause in the activities of buyers and sellers
A breakout of the support is said to occur when the price of the commodity crosses through the support line and continues moving in a downward direction.
The breakout of the support line usually signals a trend continuation or a trend reversal signal, depending on the trend in which it is formed.
A breakout of the support line is usually said to signal a trend continuation when it occurs in a downtrend
And this breakout is sometimes confirmed when the price retraces back to retest the broken support which is now acting as a strong resistance.
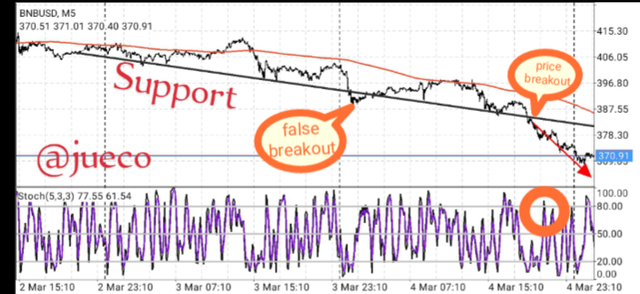
screenshot from mt4
The above screenshot is a price chart of the pair BNBUSD on a 15min time frame.
And as seen above, the market was in a downtrend, forming lower lows and lower highs and making multiple touches on its support line.
As it continues, it had an aggressive breakout below its support line, thus indicating the continuation of a downtrend.
This type of signals a trend continuation
The breakout was also confirmed using the stochastic Indicator.
The stochastic Indicator helps to signal overbought and oversold regions in the market.
Whenever the stochastic Indicator is in an overbought region, it signals a bearish trend move and whenever it is in an oversold region, it signals a bullish trend move.
As seen above, the stochastic Indicator was in an overbought region of 80, which is a good Bearish trend reversal signal.
A trend reversal is said to occur when the price of the market moves in a reverse direction as that of it's initial trend.
A trend reversal usually indicates the weakness of either the bulls or the bears in the market.
A trend reversal breakout is a price breakout that occurs whenever the market is about to experience a trend change.
For a breakout on the support zone to indicate a trend reversal, it must occur in a bullish trend and this usually indicates that the buyers in the market are exhausted and can no longer push the price of the market upwards.
In a bullish trend, a reversal breakout is said to occur when when the price fails to continue the formation of new highs but instead, it broke below its support line, and then retest the broken support line which now acts as a strong resistance line.
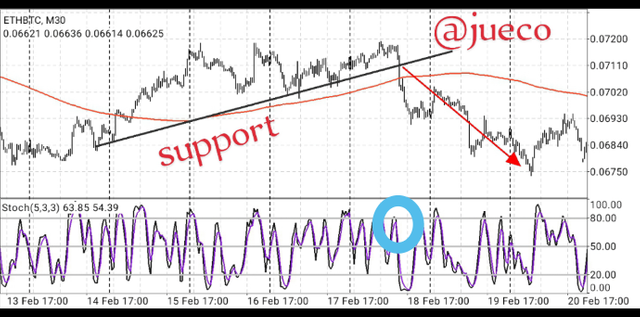
Screenshot from mt4
The screenshot above is that of ETHBTC on a 30min time frame.
As seen above, the price was initially in an uptrend, forming higher highs and higher lows, but the buyers became exhausted and could no longer push the prices upward anymore, then the price had an aggressive breakout on the support line, thus indicating a bearish trend reversal.
This signal was filtered with the use of a stochastic Indicator.
As at the point of breakout, the stochastic was signalling an overbought region, thus confirming the bearish trend reversal signal.
Also in a ranging market, there is sometimes a breakout on the support line depending on the strength of the sellers.
And whenever there is a break in the support line, a downtrend is sometimes confirmed with a price retest and price rejection.
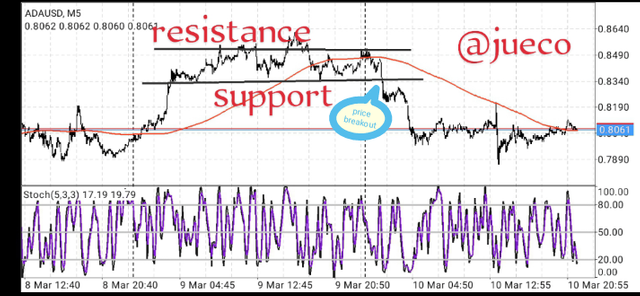
Screenshot from mt4
The above screenshot is a price chart of ADAUSD on a 5min time frame.
An as seen above, the market was ranging by forming lows and highs and making multiple touches on its resistance and support line.
Then it had an aggressive breakout on the support line, thus indicating a bearing move.
This signal was confirmed with the use of stochastic Indicator, and the stochastic Indicator was in an overbought region, confirming the signal of a bearish move.
Explain what a false breakout is and how to avoid trading at that time. Show screenshots.
Explain what a false breakout is and how to avoid trading at that time. Show screenshots.
A false breakout is a phenomenon that is said to have occurred when the price of a commodity crosses it's support/resistance line, but could not continue in the direction of it's breakout.
For example, if a false breakout occurs on the resistance line, it means that the price will break above the resistance line, then retrace and break below the already broken resistance line and continue in the previous direction of the trend.
As traders, the occurrence of false breakout is inevitable in the market die to the high volatility of the market, but this false breakout can be filtered.
It is good for us to note that, a false breakout is different from price retracement.
A price retracement/retest is a confirmation signal after a successful breakout, it ends up enabling the price move in the direction of it's breakout.
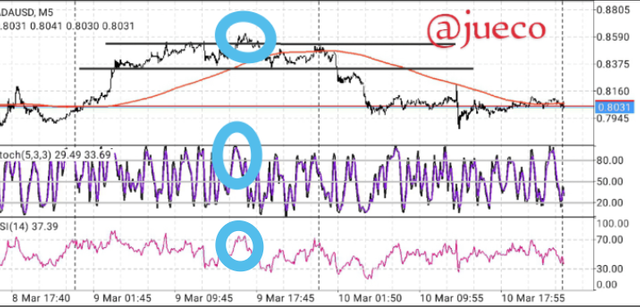
SCREENSHOT FROM MT4
The screenshot above is that of ADAUSD on a 15min time frame.
The screenshot shows ba ranging market consisting of highs and lows.
And also there's a false breakout on the resistance line, which is as a result of the weakness of the buyers.
The formation of such false breakout cannot be avoided, but as seen above, they can be filtered with the use of Indicators.
By adding adding an indicator to the chart, I noticed that the RSI an stochastic Indicator were both in an overbought region of 70 and 90 respectively, thus signaling a bearish trend reversal.
And in a sense filtering off the false breakout.
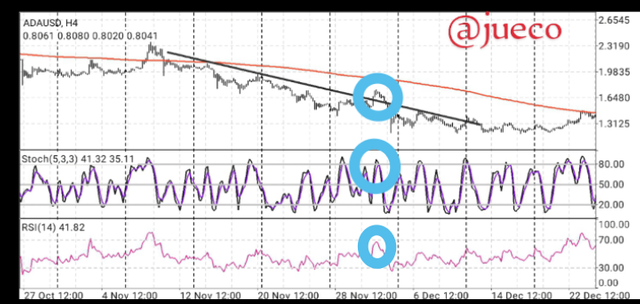
Screenshot from mt4
The screenshot above is that of ADAUSD on a 4 hour time frame, showing ba false breakout on the resistance line of the chart.
As seen above, the market was in a bearish move, forming lower highs and lower lows, then there was a false breakout which was filtered with the use of the RSI and stochastic Indicator.
Another effective way to filter out false breakout on price action is to wait for confirmation before entering the market.
Experience traders makes use of price retracement and retest to filter out false breakout.
Whenever the price breaks below the support line, it is advisable to wait for the price to retrace and retest the broken support line, which will now serve as a confirmation for you to place a sell order.
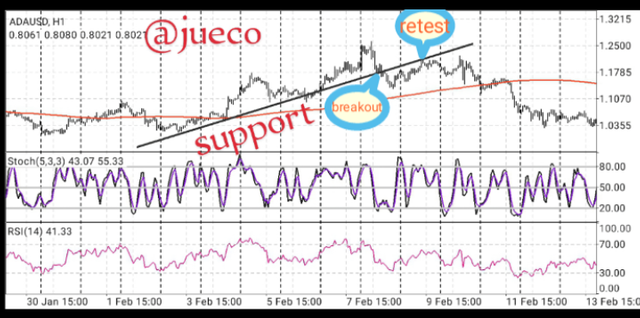
Screenshot from mt4
As seen above, after the price breakout, there was a retest on the resistance line, which now serves as a confirmation signal to enter the market.
In a demo account, execute a trade when there is a resistance breakout, do your analysis, . Screenshot are required
In a demo account, execute a trade when there is a resistance breakout, do your analysis, . Screenshot are required
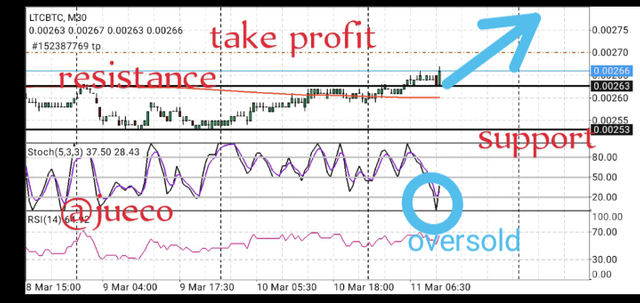
Screenshot from mt4
Inorder to carry out this task, I visited my MT4 app and I chose the pair LTCBTC
I noticed that the market was in it's consolidation phase, hitting it's resistance and support zones severally.
I then watched and noticed that the price broke above it's resistance line, and after the breakout, the price retraced back to retest the broken resistance line, which is now acting as a strong support to the price
I then waited to see if it was a false breakout or the price would be rejected, and as I watched closely, the price began forming a bullish candle, which is an indication that the price was rejected by the strong support line.
I then went straight up to add the stochastic Indicator for more confirmation.
When I looked at the stochastic Indicator, I noticed that it was in an oversold region, and oversold regions are good bullish trend reversal signals.
With these confirmation from both the stochastic Indicator and my resistance and support levels, I placed a buy order.
I set my take profit close to the nearest resistance and my stoploss was placed below my support line, just as seen below
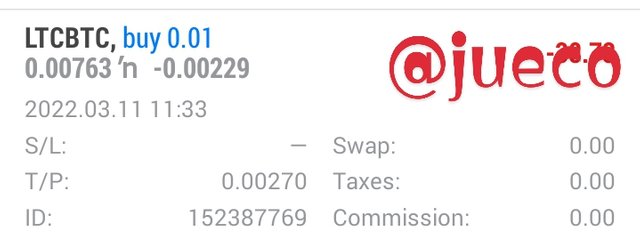
screenshot from mt4
In a demo account, execute a trade when there is a support break, do your analysis. Screenshot required
In a demo account, execute a trade when there is a support break, do your analysis. Screenshot required
Inorder to carry out this task, I visited my MT4 as usual and decided to analyze the pair ETHBTC on a 15min time frame
As I entered the market, I noticed that the market was in an uptrend, forming higher highs and higher lows.
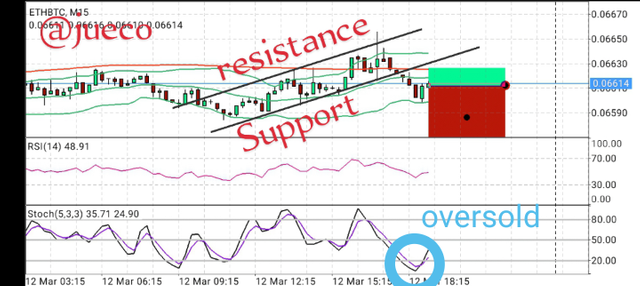
Screenshot from mt4
The first thing I did was to locate my support and resistance levels.
After I did, I noticed that the price made consecutive touches on the support and resistance line, then suddenly, the price broke below its support line.
I then decided to wait for further confirmation before entering the market, then I noticed that the price was about to retrace to retest it's broken support, and I also reasoned that it could be a false breakout but I was sure that the market was going to retrace back.
I then decided to take advantage of the price retracement by placing a quick buy order, but before I placed my buy order, I needed to be sure the price was going to retrace.
To confirm if the price was going to retrace, I made use of the stochastic Indicator which was in an oversold region, giving me the assurance that the price was going to retrace upward.
I then confirmed it again using the bollinger band Indicator, and from the bollinger band, I noticed that the price was at aa very strong dynamic support, which is an indication that it going to be rejected.
With all these confirmation that the price was going to retrace to it's resistance zone,I immediately entered a short term buy order.
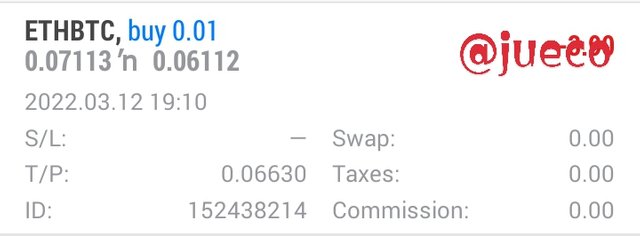
Screenshot from mt4
CONCLUSION
The use of resistance and support levels when trading is a good trading techniques.
And false breakout gotten from this trading technique can be filtered with the use of Indicators.
Por favor corrige el hash tag es pelon53-s6week3
Downvoting a post can decrease pending rewards and make it less visible. Common reasons:
Submit
Ok thanks a lot Professor
Downvoting a post can decrease pending rewards and make it less visible. Common reasons:
Submit