I, going by the name Obioma Charles, humbly welcome you to my Season4/week4 assignment post of the steemit crypto academy.
This week, we will be learning from Prof @reminiscence01 and we shall continue from our last topic with him.
On our last topic, we discussed elaborately on technical Indicators, their types and uses.
We also discussed how we can add Technical Indicators to our chart and configure them.
This week we shall be diving deeper into the analysis of these Indicators.
We shall also explain some terms such as Divergence and convergence in crypto analysis.
In other not to miss out from this very educative adventure, join me as we begin by exploring the first question.
(1a)
EXPLAIN LEADING AND LAGGING INDICATORS IN DETAILS AND ALSO GIVE EXAMPLES OF THEM.
(1a)
EXPLAIN LEADING AND LAGGING INDICATORS IN DETAILS AND ALSO GIVE EXAMPLES OF THEM.
Now we shall proceed to exploring leading and lagging Indicators.
LEADING INDICATORS
A leading Indicator can be described as an indicator that provides information on the next price move of a market.
Leading Indicators provides assistance in the location of the next movement of a price, they are sometimes compared to price action.
For example, if the price of a commodity is indicating a downtrend, a leading Indicator will help to tell the price next move, the Indicator might either point an uptrend, giving a sign that the price of a commodity is about to increase. Or it might indicate a downtrend, signaling that the market price will continue in it's initial direction.
These signals given by leading Indicators, comes right before the price embark on such movements, so in a sense, they are called forewarning signals.
The ability of Fibonacci retracements and extension tools to foretell the future prices of a market terms it a leading Indicator.
Sadly, leading Indicators sometimes give misleading signals, the price movements of a market sometimes tally with the signal given by the Indicator and sometimes it diverges and go in a different direction.
Due to the fact that leading Indicators sometimes give misleading signals, traders are encouraged not to solely rely on one leading Indicator, they can either use multiple Indicators or make use of other technical analysis tools in order to achieve a more accurate analysis.
Leading Indicators should only be used as a guide to a trading strategy.
In other words, leading Indicators are described as a measurable variable, that foretells the movement of an available series of data, before it takes place.
Leading Indicators helps traders to make wise decision by foretelling the magnitude, the direction and the timing of future price movements, hereby making trading analysis easier.
Since leading Indicators are used as guides by traders to guide their trading strategy as they keep in expectations of future market conditions, such Indicators ought to be measurable inorder to enable traders analyse them effectively.
Some examples of leading Indicators are:
RSI, Stochastic oscillator, OBV, Fibonacci retracements and so on.
LAGGING INDICATORS
Most of the technical Indicators available are lagging Indicators, they tend only to analyse the historical data of a market, they don't predict the price move of a market.
Lagging Indicators at times lead price to what is known as divergence. Divergence will be explained in the course of our adventure.
Lagging Indicators are useful as they help in the simplification of price action and this helps traders identify the previous price trend/movements of a market.
The simplification of historical data of a market helps influence the mindset of the trader on how the next move of the price will be, and inturn shapes their trading decision.
Lagging Indicators also acts as gauge to the trend of a market as they give signals of but and sell in a trade.
Lagging Indicators are most times used by traders to verify the strength of a trend.
Lagging Indicators also serves as confirmation to long-term trends as many leading Indicators are prone to volatility, the volatility of leading Indicators leads to the emination of false signals.
Examples of lagging Indicators are EMA, Bollinger band, MACD, Parabolic sar and so on.
Without any further delay, shall we proceed to our next adventure
(1B)
WITH RELEVANT SCREENSHOT FROM YOUR CHART, GIVE A TECHNICAL EXPLANATION OF THE MARKET REACTION ON ANY OF THE EXAMPLES GIVEN IN QUESTION 1A.
DO THIS FOR BOTH LEADING AND LAGGING INDICATORS
(1B)
WITH RELEVANT SCREENSHOT FROM YOUR CHART, GIVE A TECHNICAL EXPLANATION OF THE MARKET REACTION ON ANY OF THE EXAMPLES GIVEN IN QUESTION 1A.
DO THIS FOR BOTH LEADING AND LAGGING INDICATORS
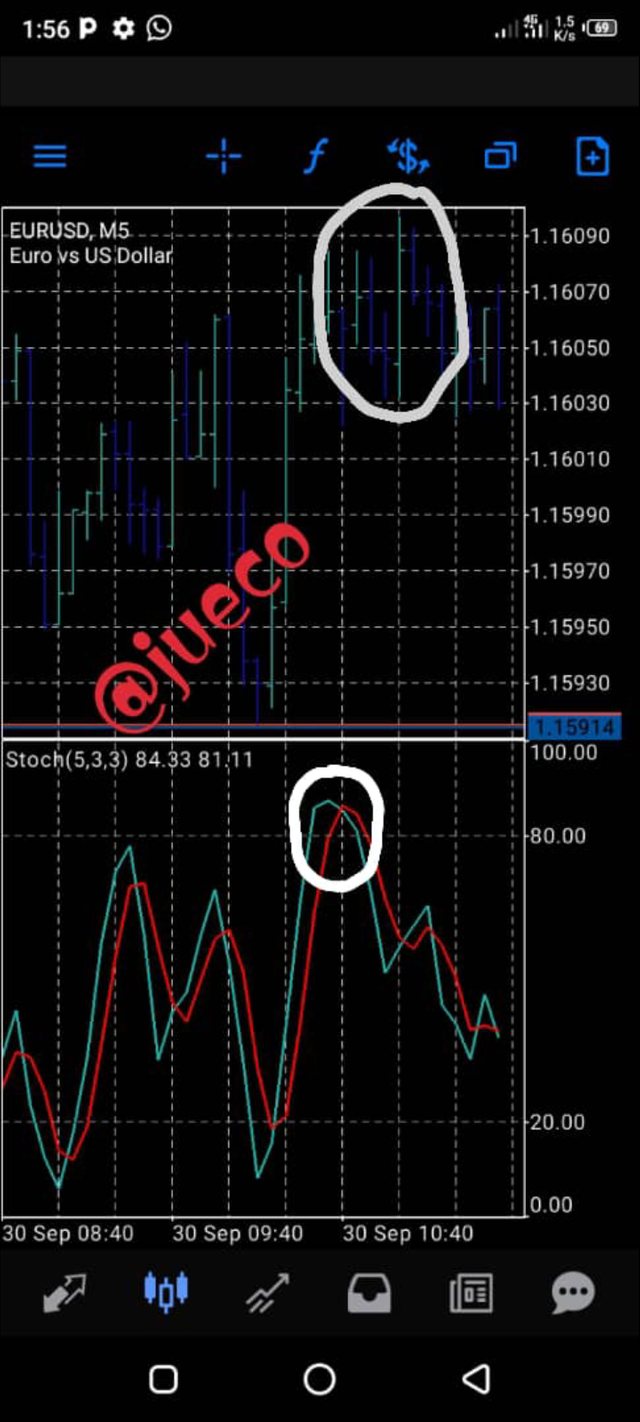
SCREENSHOT FROM MT5
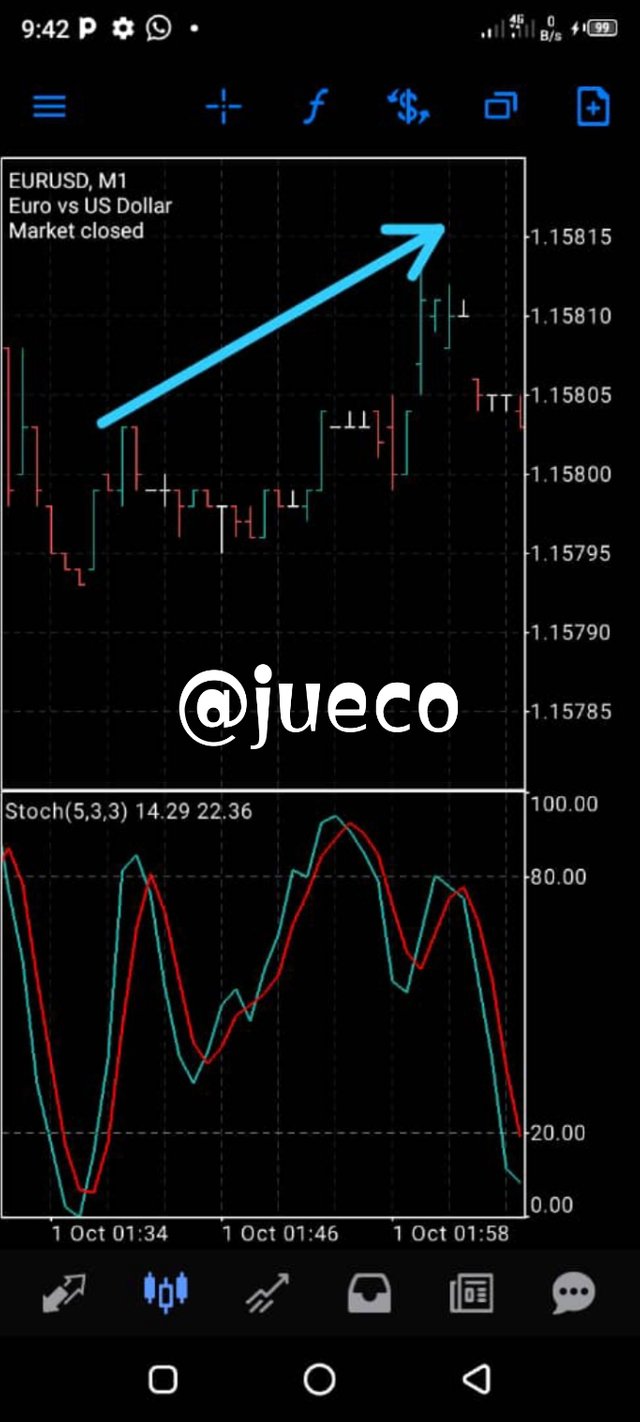
From the above screenshot, we can see the stochastic Indicator used on the Cryptocurrency pair EUR/USD indicating an uptrend just before the price movement followed suite.
The signal given is a perfect opportunity for a trader to enter the market trade.
Although leading Indicators are sometimes manipulated by price movements, a wise trader will have the above signal confirmed using other Indicators.
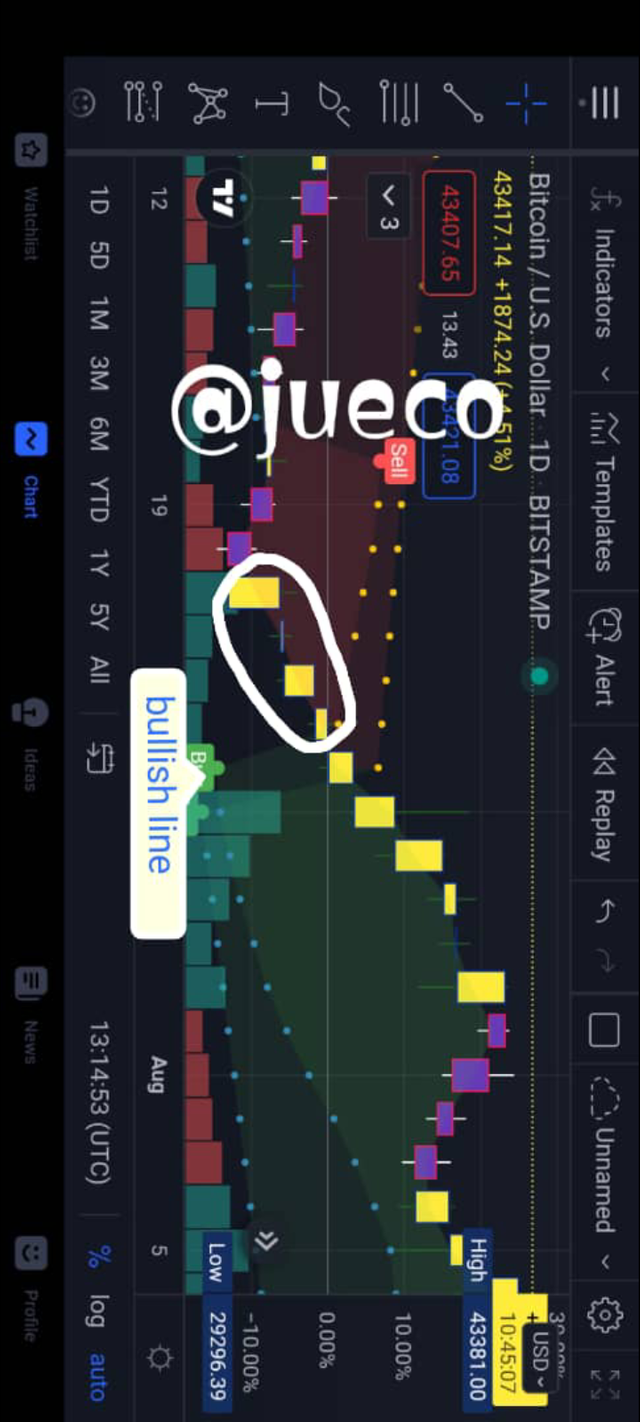
SCREENSHOT FROM TRADING VIEW
As earlier explained, lagging Indicators give signals late, they give signals after a price action.
From the above screenshot, it is clearly seen that the parabolic sar gave a late signal.
The Indicator indicated an uptrend after two to three bullish candles have been created.
The above Indicator being a lagging Indicator is most suitable for long-term trends as they give accurate signals.
We make progress by proceeding to the next task.
(2a)
WHAT ARE THE FACTORS TO CONSIDER WHEN USING AN INDICATOR?
(2a)
WHAT ARE THE FACTORS TO CONSIDER WHEN USING AN INDICATOR?
Just as when a trader want to purchase a commodity, he has to consider some factors such as price and many more.
The same is applied to the use of technical indicators.
To effectively use an indicator the following factors should be taken into consideration:
- MARKET CONDITION:
One of the factors to consider when making use of an indicator is the price condition of a market.
Understanding the condition of prices of a market is very important as it helps a trader to understand the type of Indicator to be used.
SELECTION OF INDICATORS:
After gaining proper insight on the condition of a market, a trader needs to select the best indicator to be used for such market, either lagging or a leading Indicator.USE OF MULTIPLE INDICATORS:
True, Indicators differs in their functions.
So when using an indicator to analyse a chart, a trader needs to make use of multiple Indicators inorder to achieve a more accurate analysis.A trader needs to understand the functions of each Indicators he chooses to use.
For example, leading Indicators are mostly used for short-term trading and lagging Indicators are mostly used for long term trading.
If a trader use a leading Indicator for a long-term trading, the Indicator is bound to give wrong trading analysis as it is not meant to function as a long-term Indicator.
(2b)
EXPLAIN CONFLUENCE IN CRYPTO TRADING.
PICK A CRYPTOCURRENCY PAIR OF YOUR CHOICE AND ANALYZE THE CRYPTO PAIR USING A CONFLUENCE OF ANY TECHNICAL INDICATOR AND OTHER TECHNICAL ANALYSIS TOOLS
(2b)
EXPLAIN CONFLUENCE IN CRYPTO TRADING.
PICK A CRYPTOCURRENCY PAIR OF YOUR CHOICE AND ANALYZE THE CRYPTO PAIR USING A CONFLUENCE OF ANY TECHNICAL INDICATOR AND OTHER TECHNICAL ANALYSIS TOOLS
The word confluence has to do with the meeting of two rivers flowing from different direction.
After their combination, they tend to flow in the same direction.
In a like manner, confluence in crypto trading is the use/combination of two or more trading techniques to increase the rate of getting a very accurate trading analysis.
The word confluence in crypto trading is coined from from the earlier explained [the merging of flowing water bodies into one].
Confluence happens to be of great assistance to crypto traders as it helps them in the verification of the validity of a given signals.
In other words, confluence can be said to be the use of multiple technical Indicators in a market to give a more reliable analysis.
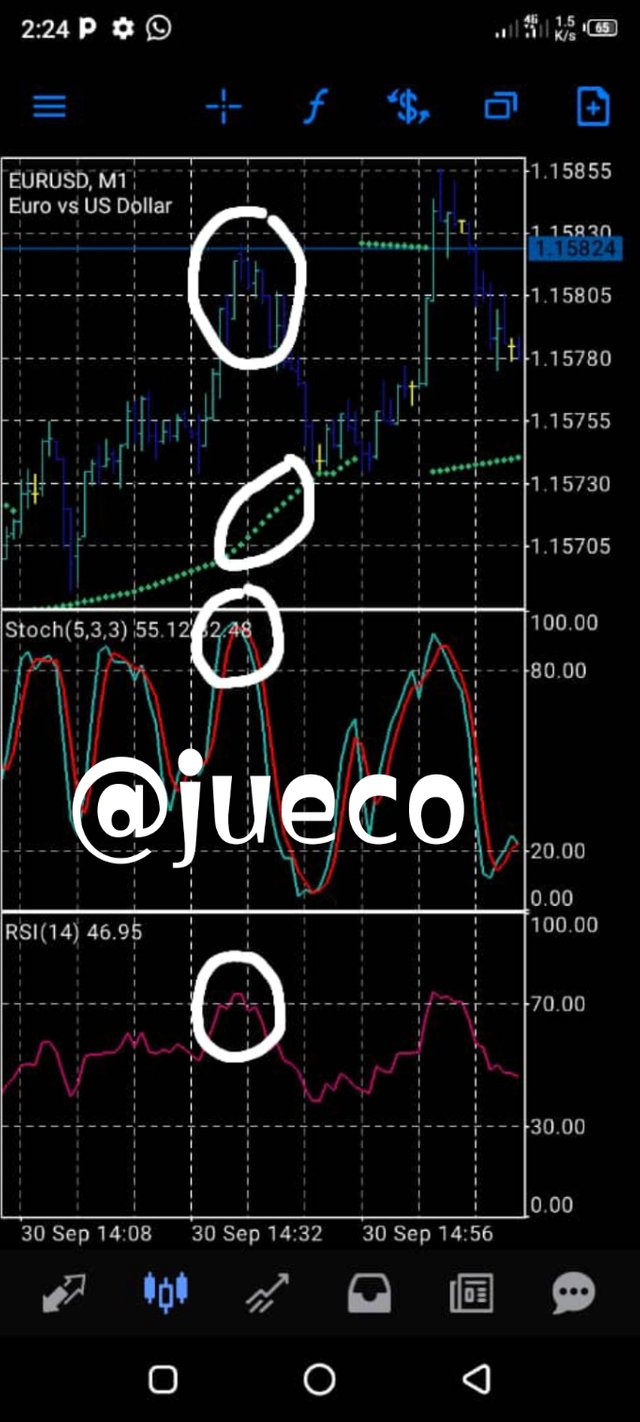
SCREENSHOT FROM MT5
As seen above, different indicators are used to validate the signals.
(3a)
EXPLAIN HOW YOU CAN FILTER FALSE SIGNALS FROM AN INDICATOR
(3a)
EXPLAIN HOW YOU CAN FILTER FALSE SIGNALS FROM AN INDICATOR
Let us first look at some reasons for the appearance of false signals;
- NEWS:
News is one of the most frequent triggers of false signals.
Before the announcement of some news, an indicator would have given signal on the next price move of a market, and when the news is published, it might go against the given signal.
For example, the news that Elon musk announced that Tesla is about to accept Doge coin as a medium of payment, affected the price of Doge coin in those period.
Let's imagine that an indicator had given a downtrend signal of Doge price before the announcement, the moment the news was published, definitely, the price will escalate and go against the Indicator.
News indeed affects the price of a commodity and it's sometimes the cause of false signals.
- MISCALCULATION OF INDICATORS:
The miscalculation of Indicators used is another reason for the breakout of false signals.
Traders sometimes forget that the data gotten from the abrupt movement of market price has been manipulated and these distorted data tend to make an indicator give false signals.
The elimination of all false signals is not an easy task to do but a trader can minimize the frequency of false signals produced by an indicator.
Below are some ways to filter out false signals;
- ANALYZE CLEAR JAPANESE CANDLE STICK PATTERNS:
Traders that trade with the Japanese candlestick pattern are encouraged to select clear combinations of candlestick patterns and desist from blur signals.
In a sense, the analysis of clear Japanese candlestick helps to filter false signals.
ANALYZE YOUR GRAPHIC PATTERN:
To avoid falling to the trap of false signals when trading a graphic chart, a trader ought to analyse in advance the figures on the chart and make a wise decision on which will be useful as an opening position.BE PATIENT WHILE TRADING:
A trader should not hurriedly open an opposite order when his first position has been closed.
A trader should learn to exercise some patience when it comes to opening an opposite order as markets tend to continue in the direction of it's first position.NORMALIZE THE USE DEMO ACCOUNT AND BACKTESTING:
A trader should learn to confirm their entry points using a demo account, doing such will increase the understanding of a trader on the kind of signals given by the Indicator.
(3b)
EXPLAIN YOUR UNDERSTANDING OF DIVERGENCES AND HOW THEY CAN HELP IN MAKING GOOD DECISION
(3b)
EXPLAIN YOUR UNDERSTANDING OF DIVERGENCES AND HOW THEY CAN HELP IN MAKING GOOD DECISION
Divergence, being a signal easy to analyse, leave most traders confused in crypto trading.
Most traders are confused due to the fact that there are numerous types and classification of crypto divergence, some of which are:
- Bullish / Bearish
- Positive / Negative
- Regular/ extended/hidden.
Divergence assist a lot in crypto trading and belyare some of its importance
- It helps in the determination of the strength of a trend
- It provides knowledge on the possibility of trend reversal
- Divergence also assist in the filtration of false signals.
(3c)
USING RELEVANT SCREENSHOTS AND AN INDICATOR OF YOUR CHOICE, EXPLAIN BULLISH AND BEARISH DIVERGENCES ON ANY CRYPTOCURRENCY PAIR
(3c)
USING RELEVANT SCREENSHOTS AND AN INDICATOR OF YOUR CHOICE, EXPLAIN BULLISH AND BEARISH DIVERGENCES ON ANY CRYPTOCURRENCY PAIR
BULLISH DIVERGENCE
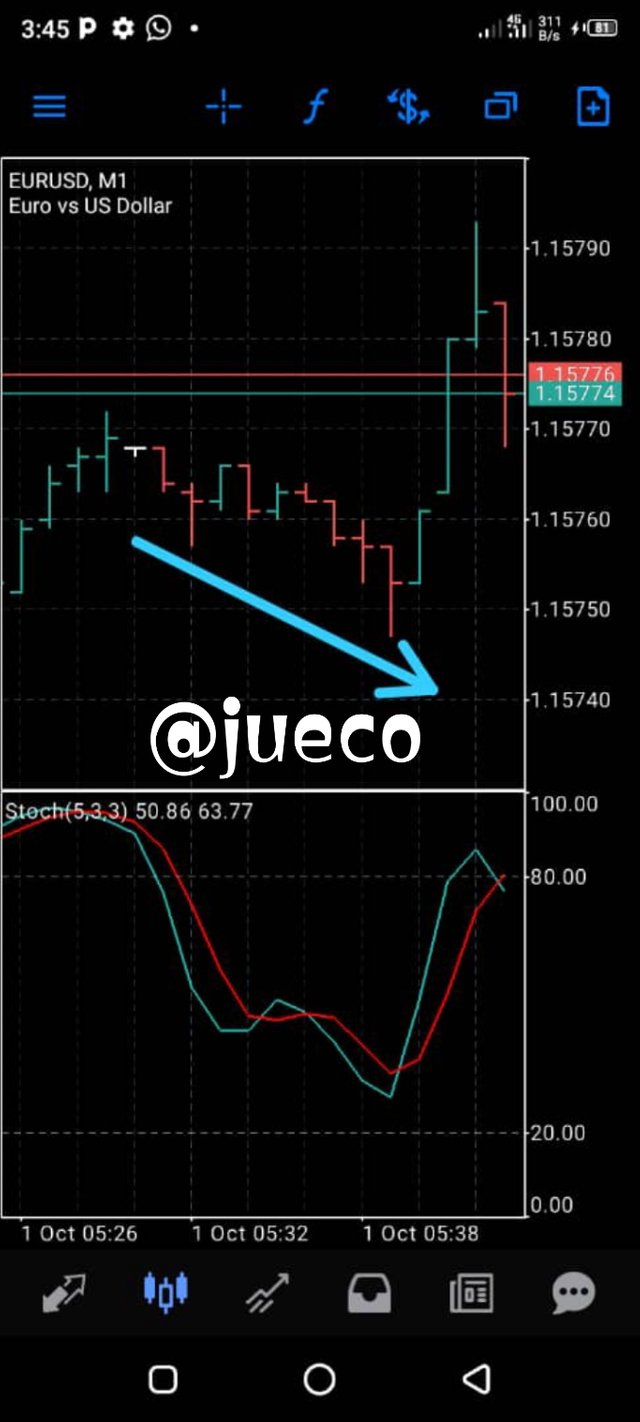
SCREENSHOT FROM MT5
A bullish divergence is said to happen when a price of a commodity reaches a new lower low, without the Indicator getting a lower low.
This event depicts that the strength of the bears is diminishing and that of the bulls is getting stronger again, preparing the bulls to take over the market.
A bullish divergence is often a sign, signaling the halt of a downtrend.
BEARISH DIVERGENCE
The bearish divergence is the opposite of a bullish divergence.
In a bearish divergence, the price of the commodity is said to reach a higher high on the chart.
The bearish divergence indicates that the strength of the bulls are depleting and that of the bears are being refilled.
A Bearish divergence often ends in a downtrend.
CONCLUSION
The use of technical Indicators in a market cannot be overemphasized as it helps in the prediction of the future prices of a market.
Traders should also note that indicators should never be used as a standalone tool, it should be accompanied by the use of other technical analysis tools.
I sincerely appreciate Prof @reminiscence01 for this lecture as I have learnt lot of things on crypto trading.
I look forward to your next lecture Prof.
My comment box is open to all who have an additional information to give.
Hello @jueco, I’m glad you participated in the 4th week Season 4 of the Beginner’s class at the Steemit Crypto Academy. Your grades in this task are as follows:
Observations:
The chart example here is wrong. There's no divergence indicated in this chart.
Recommendation / Feedback:
Thank you for participating in this homework task.
Downvoting a post can decrease pending rewards and make it less visible. Common reasons:
Submit
Thanks a lot Prof for the review and correction, I look forward to your next lecture
Downvoting a post can decrease pending rewards and make it less visible. Common reasons:
Submit