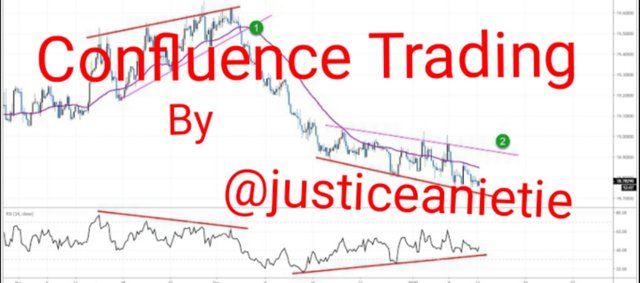
Hello great Steemians, I trust you all are doing great. Professor @reminiscence01, I am pleased with your lecture on Confluence Trading and I will be submitting the solution to my assignment Below:

- Explain Confluence trading. Explain how a trade setup can be enhanced using confluence trading.

When we talk of Confluence trading in simple terms, it is all about the combination of multiple tools and this multiple tools helps in signal confirmation.
When making trading decision as a trader, you shouldn't rely on one single strategy for you to trade the market. This is because the market is always volatile and risky. For you to make good investment in Crypto market, you need to have multiple confirmations to make a valid trade. Therefore, Confluence trading is all about the combination of multiple tools in order to make a perfect trading decision in Crypto market.
Below is the detailed explanation of Confluence trading importance:
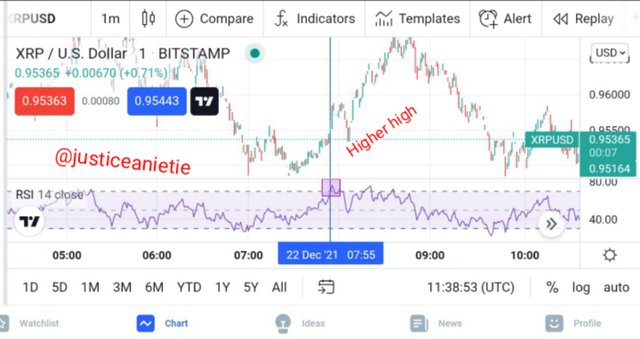
Screenshot from tradingview
If you look at the chart presented above, you will see that the RSI is at the over bought level and this signifies that there will be a reversal of trend. While when we look at the price, its making a bullish trend because the trend is making higher highs.
This is the reason why Confluence trading is essential because it makes use of multiple signal before you can enter the market. For the RSI to be at the over bought region, it would have led to a false signal by making the trader to think that the market will reverse from up trend to down trend.
Since price action is equally put in place, this doesn't allow us to take trading decision when the RSI is at the over bought level while the price action is making higher highs.
However, for more clarification of the bullish trend reversal, we will be adding another indicator this will equally help us to make proper trading decisions by giving us more addiquate signal.
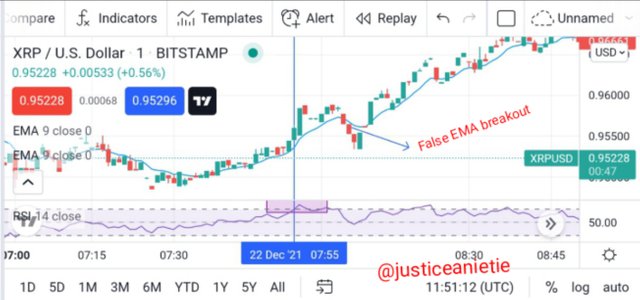
Screenshot from tradingview
If you look at the chart above, you will notice the application of the exponential moving average and if you look carefully, you will notice that the reversal from the RSI is invalid on the EMA. This is because price is still trading above the EMA and this indicate that the overall market is still on up trend.
When there is a break below the EMA, you should note that there will be a positive reversal of trend in the market and this will be a confirmation of a bullish reversal signal from RSI. At this point, traders can see and equally know the importance of Confluence trading and through the explanation above, you should know and see that Confluence trading helps us to make proper trading decision and equally helps us to avoid fakeouts in the market.

2.Explain the importance of confluence trading in the crypto market?

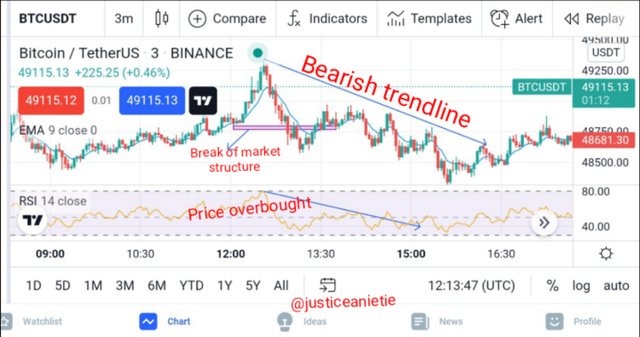
Screenshot from tradingview
With the use of BTC/USDT chart above, you will see that there is a combination of different tools to show the confirmation of the bullish trend reversal to a bearish trend. What you should notice is that the price was bullish, making a higher highs before it could no longer makes a higher high again thereby breaking the market structure. At this point you should have the knowledge that there is a trend reversal in the market.
When we look at the RSI, you will noticed that it's at the over bought zone which is above level 80. At this level, it is a confirmation of the RSI that the price is over bought and there will be a reversal of trend in the market.
Moreover, you can see from the chart how price breaks the 21 EMA line, which signifies a reversal of trend from bullish to a bearish trend.
If you have followed all I have explained in details, you will see that applying multiple trading strategies helps a lot in the confirmation of trend reversal. You should notice that some of this strategy were wrong and you might observe a mixed signal when combined with other strategies but having different strategy will help you in making addiquate trading decisions in the market.
√ Confluence trading helps to enhance your trading through the confirmation of multiple tools.
√ It helps in risk management thereby reducing the volume of losses in trading.
√ Using multiple strategy helps in detecting false signals and fakeouts in the market. Confluence trading helps to filters false breakouts, reversals, and continuation signals can be filtered out and confirmed using Confluence trading. It is the help of multiple strategy that give aids in the market.
√ As a trader, it gives you and edge and confidence in the trading decision.
√ Using multiple trading techniques, it helps traders to make addiquate trading decisions by identifying good trading setups.
In order to have a good trading journey, Many traders make use of multiple Confluence strategy. As a trader, you need to select a trading strategy that best suits you in order to be successful in your trading journey.
I want you to know that the more the indicators you apply in your trading, the more effective a trading setup. Before you make any trading decision or investment decision, I wish you should have two to three Confluence trading setup as this will help your trading to be effective.

3.Explain 2-level and 3-level confirmation confluence trading using any crypto chart.

When we talk of 2-level confirmation Confluence trading it's all about using more than one trading tools in order to confirm a trading setup. Here you can use any trading tool but it depends the trading tool you feel that it works best for you.
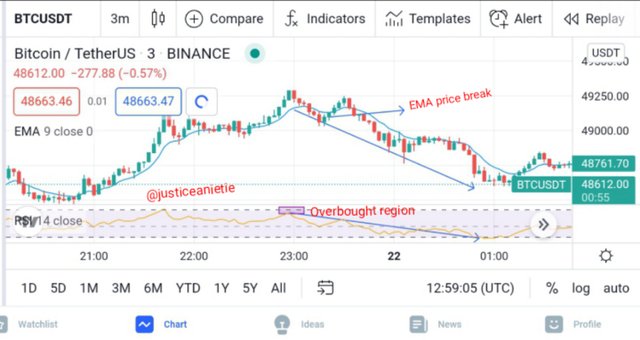
Screenshot from tradingview
When you look at the above chart, you will notice that we have a 2-level confirmation Confluence trading and this trading is a bearish setup. Note that the overall confirmation was the used of RSI and the used of Exponential moving average this was used in confirming the bearish setup.
When you look at the RSI, you will see that the price is at the over bought region and it is a reversal signal from the current market trend. I want to advice you not to Rely on the RSI alone in order to avoid fakeouts/false signals in the market. This is where Confluence trading comes in play because it enable us to make use of multiple tools in order to avoid false signals in Crypto market. So at this point, EMA can be the basis for the confirmation of trend reversal.
If you observe carefully, you will notice that the price was still above the EMA but the RSI has already given its signal. This means that the price can remain at the over bought level for overtime thereby making the trend reversal to be a fakeouts. But you should be very observant, when you see the price breaks below the EMA line, here we can now take our trade by going short in the market.

When we talk of 3-level confirmation, what we are saying is; we must have at least 3 or more than 3 trading tools in order to confirm a trade setup before taking the trade. In explaining this in detail, I will still use XRP/USDT to carry out my explanation. You should be aware that having 3-level confirmation in Confluence trading gives you an edge and a good decision to trade the market with ease.

Screenshot from tradingview
Before you go short in the market, you must have all the following setup in place. Here we have the RSI, a break of Market structure, also the price breaking below the Exponential moving average (EMA line). When you look carefully at the chart, you will observe that all the strategy are signalling a bearish reversal on BTC/USDT, at this point you can sell the market or go short.

4.Analyze and Open a demo trade on two crypto asset pairs using confluence trading. The following are expected in this question.
a) Identify the trend.
b) Explain the strategies/trading tools for your confluence.
c) What are the different signals observed on the chart?

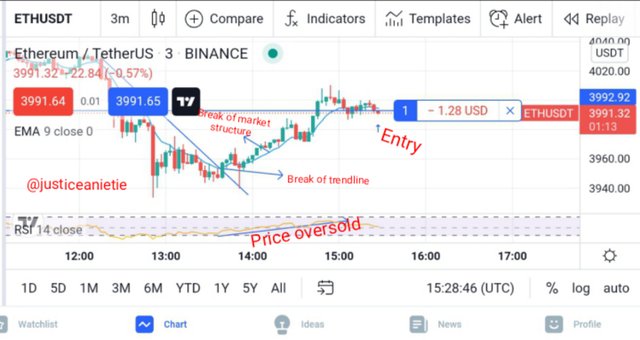
Screenshot from tradingview
a). Identify the trend:
As a trader, when you look at the chart above, you will know that it's an up trend because price is making higher highs.
b) Explain the strategies/trading tools for your confluence.
Break of Trendline:
The Trendline is one of the Confluence used in this demo trade. You can see how the price break above the Trendline, thereby changing from a bearish trend to a bullish trend reversal.
EMA:
You can see that price has equally cut across the EMA line and the price respect the line.
Relative Stregnth index:
When you look at the RSI, you will discovered that the price was oversold, so at that point there is a market reversal from bearish trend to Bullish trend.
c) What are the different signals observed on the chart?
The different signals which I observe from the chart are:
- Price breaks the Trendline
- The RSI was oversold
- The trend was bullish making higher highs
- There was a break of market structure from bearish to bullish.
I believed if you have followed the steps in this lesson of Confluence trading, you should have gotten a clear understanding and knowledge on how to apply multiple tools in your trading in order to make a better trading decision.
You should know that you need a proper confirmation of your trading tools before you can take the trade as this will minimize losses in your trading. You should note that the more tools you apply in your trading, the more you get better signals and this will be added advantage to you.
Always remember to do a proper analysis before making/taking decision either to go long/short in the market with proper money management risk.
Thank you for your time.
Hello @justiceanietie , I’m glad you participated in the 6th week Season 5 of the Beginner’s class at the Steemit Crypto Academy. Your grades in this task are as follows:
Observations:
This is not a clear chart example.
Recommendation / Feedback:
Thank you for participating in this homework task.
Downvoting a post can decrease pending rewards and make it less visible. Common reasons:
Submit
Professor thank you for the points you have pointed out, i will put in more effort in your next assignment. Thank you.
Downvoting a post can decrease pending rewards and make it less visible. Common reasons:
Submit