Hello greetings to everyone, i trust we all are doing great. I want to sincerely thank Professor @kouba01 for this wonderful lecture delivered. I will be submitting the solution of my assignment below:

1.Discuss in your own words Trix as a trading indicator and how it works

Traders always move from one trading strategy to another instead of investing your time and efforts to learning and earned from one particular strategy that will fetch you good money. For you to learn and earn in trading, then you need to learn how the TRIX indicator works.
Trix is known as the Triple Exponential moving average and this indicator helps the traders to have quick vision on the momentum of the price and the Trix indicator help traders to identify a bearish and bullish trend when the market price is over bought or oversold when trading with any asset.
This Trix is very important to trader because it helps in showing an exchange rate in the triple exponentially smoothed moving average. This was invented by Jack Hutson during the early 1980s. This indicator helps in showing price peak and the right zones of price. However, this means that it can filter out the irrelevant price peaks of the overall trend.
In the Crypto market, whenever there is a bullish or bearish impulse, TRIX indicator is capable of detecting this in the market. You should also know that TRIX indicator belong to the Oscillators groups. Whenever this indicator is used, it helps in removing background noise that might leads to false signals, this is because the significant price movement has been filter out through the complexity calculation which is considered a matryoshka of exponential moving averages (EMA). Note the formula is not manually calculated but this is to help traders to have a full knowledge on how the TRIX indicator works. Note, more attention is giving to the most recent candlestick. A simple moving average does not lack price movement but most of the false signals are not generated or exposed like when using a pure exponential moving average.

2.Show how one can calculate the value of this indicator by giving a graphically justified example? how to configure it and is it advisable to change its default setting? (Screenshot required)

Before going into the calculation of the value of the TRIX indicator, lets see how the indicator looked like by using trading view.
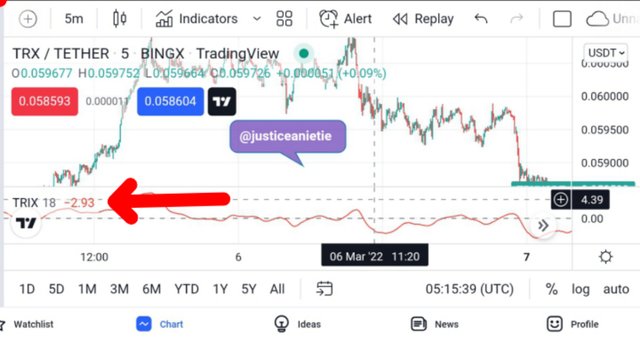
Screenshot from trading view
When it come to calculating formula, many traders are scared but you should not be afraid because the calculation is done by the platform automatically
When you look at the above chart, as you can see an oscillating line dances around the Zero line, this is considered or depending whether the value is negative or positive. The formula can be seen below:
The TRIX indicator is calculated using the following formula: EMA1 = EMA( Close ) EMA2 = EMA( EMA1 )
TRIX = (EMA3 t - EMA3 t-1) / EMA3 t-1
The triple exponential moving average(EMA) is based on the formula used in calculating the closing price of an asset. You should know that this is less affected by the movement of price as well as volatility of the average. Now you should also understand the period you are using for example the 14 EMA is at default, and it's recommended to be used. Now you can change the period to suit what you really want. When your horizon period, the longer the EMA period.
You should have a dip understanding about the EMA period element and this is in charged for TRIX period value. Here, higher value of Moving Average will help in bringing more accurate signals but few signals while shorter period will help in delivering more signals but the accuracy will be limited and this can affect the quality.
For the TRIX triple smoothed EMA, the recommended setting is 15, While 9 is for the signal line. For more accurate center line crossover, the 5 and 15 time frame is considered as this will help the indicator more volatile. The TRIX indicator should be left at its default settings due to the system has already has it calculation on how it functions.

3.Based on the use of the Trix indicator, how can one predict whether the trend will be bullish or bearish and determine the buy/sell points in the short term and show its limits in the medium and long term. (screenshot required)

Whenever we have a positive value while using TRIX indicator, it means there is an increase in the price of the asset (momentum), while each time there is a negative value, it always shows a decrease in the price of the asset. At this point a buy signal can be determined whenever you see the TRIX crosses above the zero line, while a sell signal is when there is a negative cross of TRIX below the zero line. This signals must be in line with either upward or downward movement of the three exponential moving averages which the indicator is calculated upon. However, the cross over can be used to open a buy order when the indicator crosses the zero line upward, while when it crosses downward, a sell order can be placed. An example is shown below
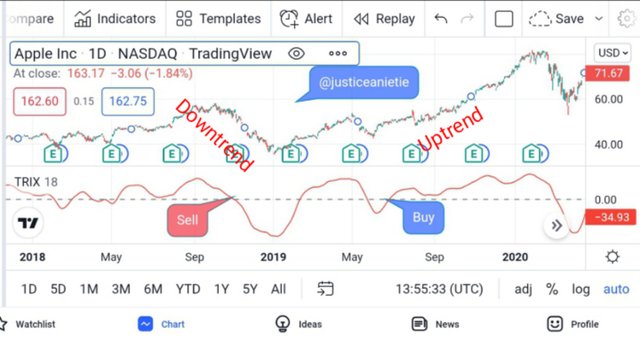
TRIX buy/sell using trading view
TRIX indicator helps in the authentication of price as we can see on the chart above how the price went bearish and bullish after both cross over. This indicator helps in filtering of valid prices when following the trend and it is much considered especially during a bullish trend.
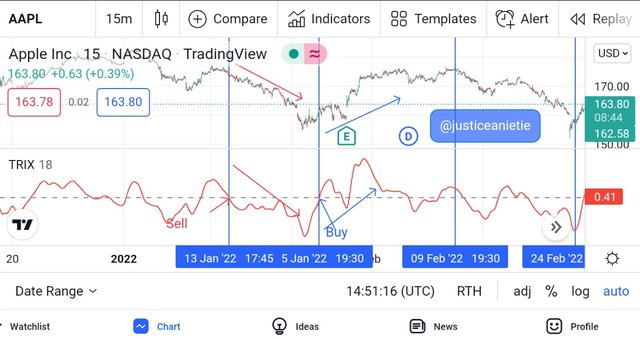
TRIX buy/sell using trading view
When you look at the chart above, you will discovered that the signal always comes later than the entry and this will make a trader to enter the market late. So you need to be sensitive in taking a buy or sell trade.

4.By comparing the Trix indicator with the MACD indicator, show the usefulness of pairing it with the EMA indicator by highlighting the different signals of this combination. (screenshot required)

Before comparing the TRIX indicator and MACD indicator, i want us to know how to use the combination of these indicator together with the EMA.
The EMA 9 of the Trix indicator can be used as a filter and this help in creating a line signal which is similar to the one used with the MACD. Based on what i have spelt out before, we go long when the TRIX line crosses the the moving average from the bottom to the top and we go short when the TRIX line crosses the EMA from the top to the bottom. As a trader, you can place a trade when you see that the indicator has started changing direction after it must have touched extreme levels. This is identified using the moving average as mention above.
However, i will go on in comparing the TRIX and MACD to show how this indicators differs
It is based on this that many traders has commented and considered TRIX to be in line with MACD. however, TRIX outputs based on the crossovers are more smoother because of the triple smoothing of the exponential moving average (EMA).
Now lets take a 15 period TRIX using a single line which stands for MA 9 and see how it behave with the MACD (12,26, 9), here you will see that the two indicators moves around the zero line and have similar signals. Using the STEEM /BTC chart, you can see from the chart that TRIX has a more considerable trend as compared to MACD.
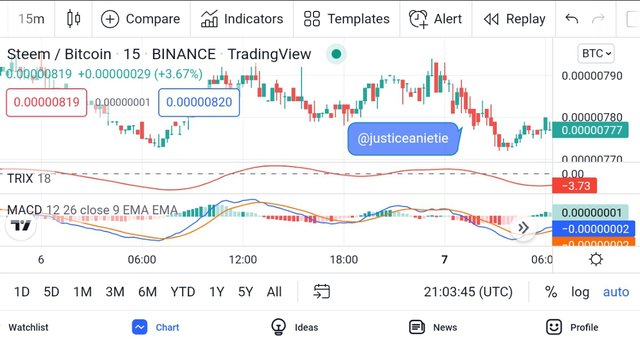
STEEM/BTC chart using trading view
The accuracy gotten from TRIX trend, helps in avoiding hudge number of false trading signals when compared to the MACD. Therefore, we can see what TRIX indicator can offers to traders below:
It shows the direction of the future trend by breaking the signal line.
In confirming a bullish or bearish trend, there must be a cross from the central zero line.
The divergence of TRIX is an important insight of the changes in the future trend.

5.Interpret how the combination of zero line cutoff and divergences makes Trix operationally very strong.(screenshot required)

The interpretation of the combination of the zero line cutoff can not be over emphasis. The cut by the TRIX represents a useful indicator for the trader to accompany the signal line cut. This is very important tool for traders to use and spot in order to make proper use of the opportunity in the market. However, the medium and long term time horizon represents the second indicator.
Having a bullish trend is when we have the TRIX crosses the zero line from bottom to top, while we have a down trend when the TRIX line crosses from the top to the bottom of the zero line, here we can say we have a bearish trend.
This indicator can be very authentic when its accompanied with other signals or indicators like the dynamic supports and resistance lines, or by making use of the trading volumes but it is most considered when it comes with divergence.
Therefore, divergence produces an authentic market alert which gives investors an inside by using TRIX indicator and examples is TRX/USDT
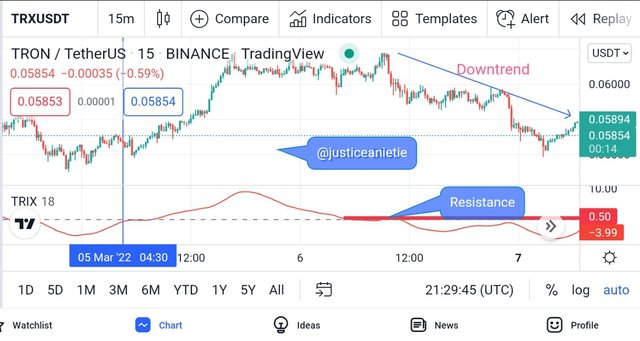
Screenshot from trading view

6.Is it necessary to pair another indicator for this indicator to work better as a filter and help eliminate false signals? Give an example (indicator) to support your answer. (screenshot required)
There is no one perfect indicator, every indicator is to support one another as to help in perfecting the confirmation which makes it valid. Though TRIX indicator filters the movement of prices, but as a trader you still need an additional indicator to support and give an accurate signal before an order can be executed. Lest look how TRIX indicator can ork with aroon indicator
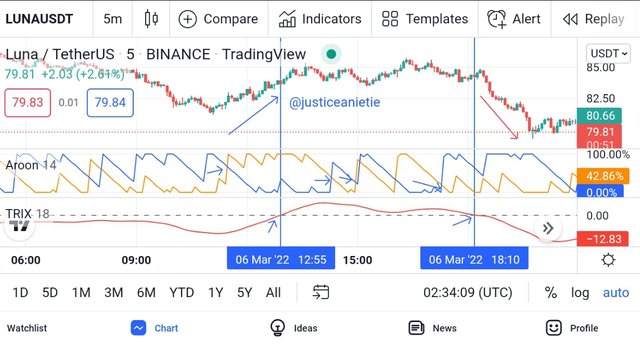
Screenshot from trading view
From the screenshot above, once TRIX indicator got a buy signal, you can see that there were equally an adequate signal from aroon indicator. From the chart above, there were clear signals to buy and sell but for beginners it will be difficult for them to make proper use of this combinations.

7.List the pros and cons of the Trix indicator:

Below are the Pros and cons of TRIX indicator, this can be seen below:
The market noise are filtered by TRIX indicator even including the lower time frames
The price reversal are are made clear on time before it occurs and it gives accurate direction of the trend.
The indicator helps in giving divergence signals
While some of the TRIX Cons can be seen below:
Here there is a bit lag on the price chart and it's caused by the exponential moving average line due to the formula calculation. This does not allow it to give signals on time, thereby causing delay and making traders to enter the market late.
The TRIX indicator gives direction on how investors should understand the signals and walk with the trend in other to make profits from the market.
From this lesson above, you can see that when the TRIX indicator is combined with MACD, it gives more accurate signal thereby giving the trader the opportunity to understand the future price movement.
Thanks for your time.