Hello great Steemians, i trust we all are doing great, i want to sincerely thank Professor @shemul21 for this wonderful lecture delivered. I will be submitting the solution to my assignment below:

- Explain Your Understanding of Moving Average.

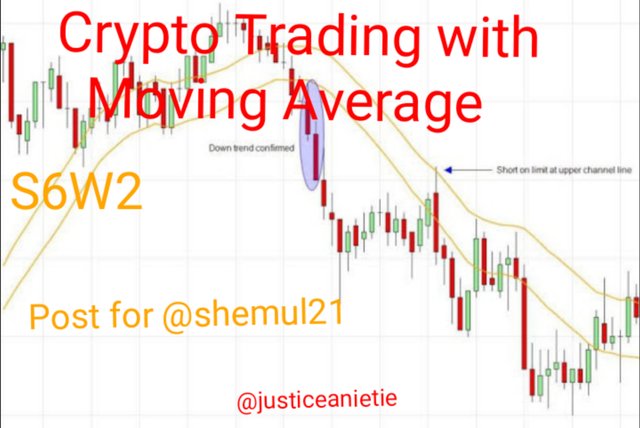
Understanding moving average is of great importance to traders because it selves as a useful tool globally when it comes to technical analysis. This is because, it helps traders to foresee the direction of the trend/ market price and this gives an inside to making good trading decision in the market.
Technical analysis is very essential when it comes to Crypto trading using the moving average. This will helps traders to know and read what the price is saying or its direction in the future. As a trader, having the full knowledge of technical analysis through the moving average will make you to sailed through in the crypto market.
You can easily know and have full ideas of the actual price when using the moving average as a guide in making and taking trade as this indicator assist traders to making effective trade. Also note that this can help you spot trend reversal, highlight trends and equally provide good signal which is very helpful to traders when the knowledge of identifying all this is been achieved by a trader, this will help you to know the current situation of the market without overflow of the market information and this will give us an inside of who is in charged and what the average trader are currently doing in the market.

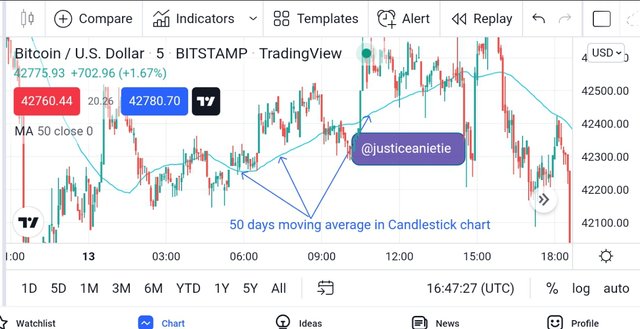
Screenshot fromtrading view
With the illustration of the chart above, whenever you see the 50 moving average below the market price, you know that this is a pure uptrend indicating that buyers has control of the market over sellers. Opening a buy position during this period guaranteed success but you have to have the full knowledge on how and when to take a trade that would be profitable to you.

2.What Are The Different Types of Moving Average? Differentiate Between Them.

When we talk of different types of moving averages, we are looking at;
- The Simple Moving Average
- Exponential Moving Average
- Weighted Moving Average
In understanding this moving averages, lets go further in explaining it below:
For you to make use of the SMA, you need to have an in dept knowledge on how it's calculated. However, it involves the process of calculating the average price of a Crypto currency based on a particular set of data. I want you to know that the simple moving average displayed data all its dynamic line thereby taking into consideration of all its market prices and assist investor and traders to be knowledgeable to take trade in the market. This SMA follows the price, this means that as the price moves, the SMA also follow the price.
Formula
SMA= A1 + A2 ....+An...../n
Where:
A= Price/data point in giving time period
n= Time period.
EMA is like the SMA but what makes it different is its technicalities when it comes to the calculations. I noticed that the Exponential moving Average carries more weight when it comes to recent changes in price. This EMA reduces price lacking when compared to the SMA and it equally attest to accuracy in price, this is very good as a trader can predict the reversal of price using the EMA.
However, as a trader i will advised that you makes use of both the SMA & EMA as this will help you to get proper price prediction both in actual and the future and note that the EMA is best used for short term traders.
Below are the formula in calculating the EMA:
Formula for Exponential Moving Average:
Today's Price ×[×/1+days]+EMA Yesterday[1-(×/1+days)]
The weighted Moving Average was developed due to lack of accuracy of both SMA and the EMA. This WMA helps in giving greater weight to recent price level and it equally places less emphasis to the previous data. However, in concentrating on the most recent data, WAM multiplies the price of each price bar through a weighting factor. Well you should note that the sum of weight will equals 1 or 100%, it is assumed that it is descriptive in nature when we are looking at different types of currency when looked at SMA algorithm and it has the same importance.
WMA = Price1×n+price2×(n-1)+••••pricen/[n×(n+1)]/2
| SMA | EMA | WMA |
|---|---|---|
| Here we used or look at the average price of the SMA over time. | The EMA calculation is based on today's value. | Here the WMA is applied first by making used of the most recent price. |
| Making used of high value helps it to be more reliable to traders. | EMA is usually preferable because of its lower value. | It considered both the higher and lower values and this makes it more reliable and trusted. |
| Long term trend is detected using SMA. | Traders are suitable with using EMA because of its accuracy in the reversal of price within shorter period. | The present of more current data makes it more good for traders to make and take actions. |
| The weight of each candle is usually correspondence with the closing price of an asset. | There is fast actions concerning the EMA and which includes the most resent activities when considered. | It lesson traders stress by reducing current data. |

3.Identify Entry and Exit Points Using Moving Average. (Demonstrate with Screenshots)


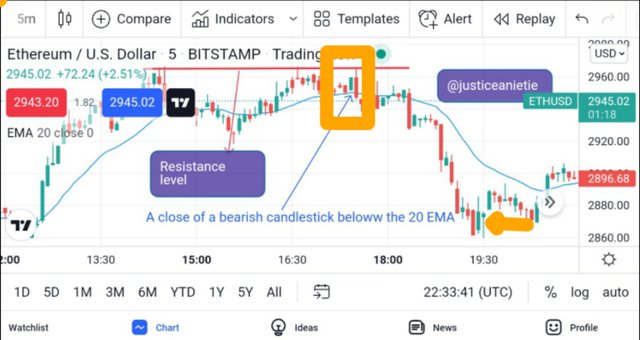
Screenshot fromtrading view
The moving average i used above is the Experimental moving average (EMA). Here the price could not go higher because of the resistance level. This resistance level could not be broken due to it was a strong resistance and you can see how the price on the candlestick reacted when it reaches that level. This make the price to break and close below the 20 EMA and immediately this occurs, seller are in control of the market and they help in pushing the price downward. You can see at that point that it not just the candlestick closing below the EMA but we can see a very clear entry point henhouse by the box. Here, there is a bearish engulfing candle which engulf the previous candle at that resistance zone.
As a trader you should look for this kind of entry before place your sell order in the market. In this market, you can exit your trade when it comes to the first support line. In this case above, you can see that the arrow down should be my exit point of take profit(TP). Note that you have to put stop loss above your resistance line. And make sure your risk to reward ratio is 1:2.

4.What do you understand by Crossover? Explain in Your Own Words.


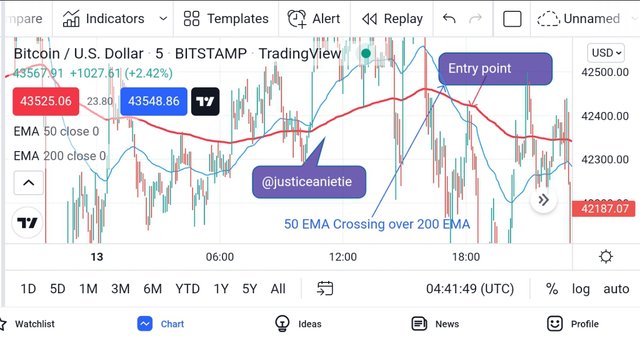
Screenshot fromtrading view
The Bitcoin/U.S. Dollar chart is used for this practical as we can see above:
Crossover signifies and entry and exit post in the market. Many traders uses the crossover to make the entry but i want to let you know that you were not supposed enter immediately the crossover. In the chart above can see that the market crosses and came back to retest the 200 EMA which now serve as a support while the market trend down.
Rules for entry and Exit Crossover System
When you see the 50 EMA cross over the 200 EMA from below, then we can go long or open a buy trade.
When the 50EMA crosses the 200EMA from above, please exit your trade by closing all your open orders in the market.
There many types of crossing over like the 9EMA, 18EMA, 50EMA and 100EMA but the real fact is the you need to be patience in order to make a good trade. Allowing the price to come to the EMA line before taking the trade will help you to make a good profit from the market. This EMA serve as a support and resistance when used for trading.

5.Explain The Limitations of Moving Average.

In every situation there us always a good and bad time. The bad time refers to the drawbacks of a particular system in its function and this might leads to wrong signals in the market. However, below are some of the setback of moving average:
You should know that there is no particular speculated/specified time period, so as a trader you can use any time period but be sensitive when using them.
MA can create a false signal by mere crossing over.
It takes longer time waiting for the price to reach the 200 MA and this make traders to spend more time watching the trend.
Lack of ideas and understanding of the MA can make a trader to take a wrong trade.
It maintains history which traders fall back on and this historical data can lead to false signals.
The crossing over of the MA can sometimes lead to fake signals.
Information that are found outside the moving average are not considered useful but there might be the best information to execute a trade but due to how we are relaying on the moving average, it might leads to delay of entering the trade.

Moving average helps traders to make trading journey simple by just following the cross over and this strategy are best for beginners.
You should understand that there are different forms of moving average like the SMA, EMA and WMA. All these moving average have their different functions but if you can combine any of the in your chart, then you can make good trading decisions in taking trades in the market.
Thank you for your time.