
Greetings to all steemians, i am happy to be part of this great lesson presented by Professor @lenonmc21. I will be submitting the solution to my assignment below:
1.Explain and define in your own words what the “VWAP” indicator is and how it is calculated (Nothing taken from the internet)?

VWAP is known as Volume weighted average price. It is an indicator used by traders due to its accuracy and it is profitable to traders in the industry. I want you to know that the VWP indicator is considered as one of the best indicator globally, this is known due to its advantage during the time of calculation over other indicators in the market.
What you should understand in this strategy is, it will help you to know the certain amount of money that is involved in a particular trading session.
What really takes into account of VWAP is the volume of money traded overtime. As a trader you might not have fully gain the knowledge of VWAP indicator but i urge you to read on to get the real insight of this indicator as well as strategy to apply and make massive profit from the market.
For you to understand how this VWAP is calculated, you need to consider the following data into account:
√ The Price
√ The amount of money traded
√ The number of daily candles
For accurate calculation of this data, you need to consider the following steps:
Price + Volume of money Traded / Number of daily candles
This indicator reset its data daily and this has made it to have advantage over other indicators as i mention earlier. When VWAP is calculated, you will noticed that it stand the chance of gaining valuable advantage, this is because of the accuracy in its average price.
When we take a closer look at the VWAP indicators, you will noticed that it can only be compared to the Exponential Moving Average (EMA), this is because it's one amongst those that reacted with more precision to the development of price.
Due to the EMA accumulation of data from the previous days, it make it to run out of date when compared to the real time price.
As a trader you should have an idea that there are numerous indicators in the market, but this indicator i am recommending to you (VWAP) will help you solve the challenges you are having with different indicators concerning the price of assets in different time frames.
However, for simple understanding of what i am saying above, if you are trading TRX using VWAP indicator, you will notice that the price remains the same across all timeframe. Example: 1hr, the same price of $20000 will be in the 4hrs timeframe.
This indicator eased traders to apply same strategy in different time frames and still remain profitable in the market.

2.Explain in your own words how the “Strategy with the VWAP indicator should be applied correctly (Show at least 2 examples of possible inputs with the indicator, only own charts)?

Applying the VWAP indicator and how it can be used correctly is for you to follow the guidelines bellow:
For the purpose of this study, I will be using Tradingview platform to carry out the configuration.
Steps:
√ Open the App, at the top of the screen,
√ Locate and click indicators,
√ Type in VWAP, then
√ Add to your chart.
At this point the VWAP is added to your chart, what you need to do next is to locate the indicator configuration nut and the screen will display, and this will enable you to observe all its details. What you need to do is to uncheck the option (Upper Band, Lower Band and Bands fill) then click on accept.
At this point we have gone far, but the final thing you need to know as well as do is:
• You have to press where the blue line of the VWAP is,
• Select the maximum line thickness
• click on accept.
If you have successfully added this indicator, as stated above, you should be able to use this indicator and strategy effectively.
I will be showing you the practical way to carryout the above steps below:
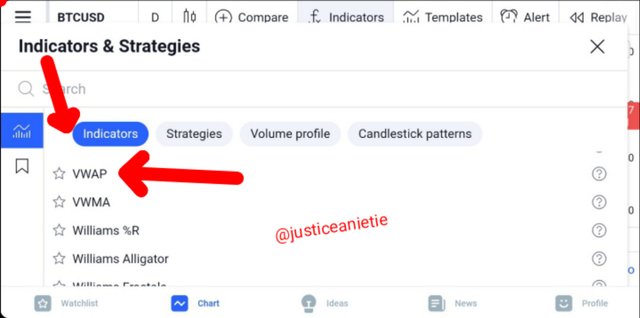
screenshot from my tradingview app
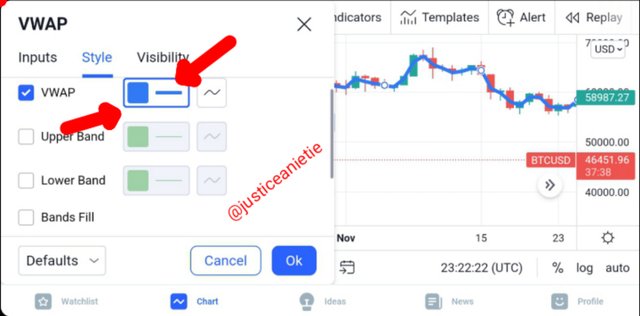
screenshot from my tradingview app
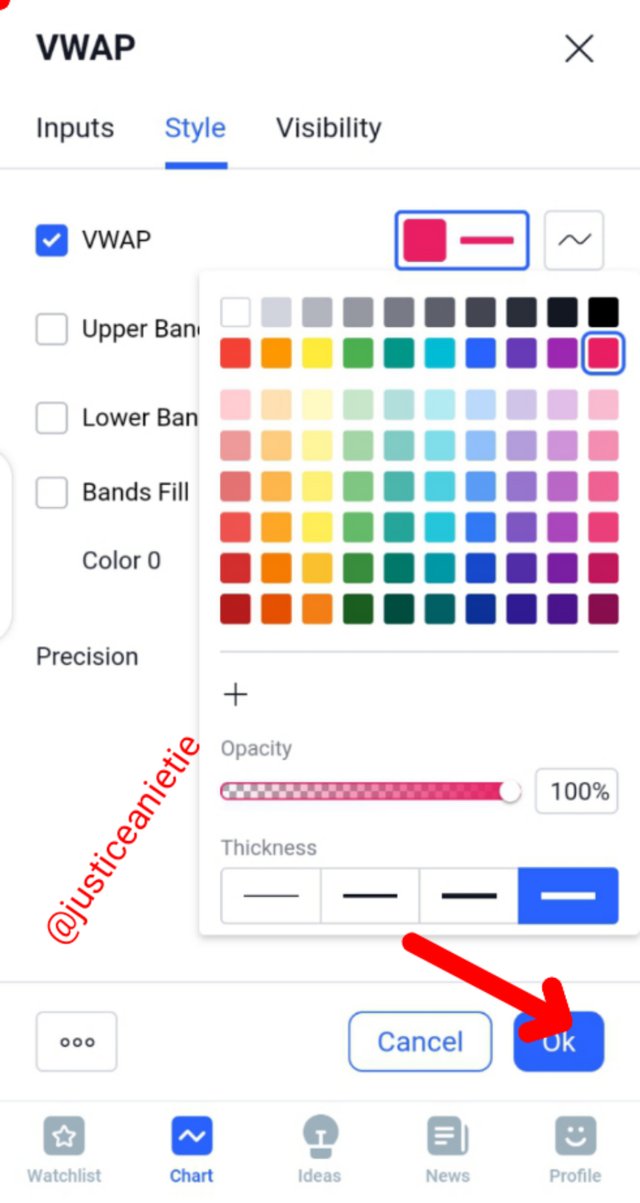
screenshot from my tradingview app
What you should understand for the overall idea of this indicator is that it works as a magnet for the price because it constantly attracting and moving it way. This tool help in determining support and resistance but you should understand that in trading you need to be patience for the price to return to the VWAP and at this point is the right time to enter the trade.
You don't need to worry about the trade, or pursue the price. Just note that the indicator gives us an accurate and very precise average price and this is in line with the volume of money traded and this help to increase our chances of success in the market.
After knowing how to place the indicator in trading view correctly in Tradingview, now is time for you to know how to use the VWAP adequately in order to be able to place a trade in any crypto pairs. Note this is very effective and works for any market type.
When using this indicator to trade, you should also work with price structure, support and resistance must also be acknowledge, fibonaccci retracement tool should equally be used. If all this is put in place, the fabulous strategy will be very effective and rewarding.
1. Breakdown of Structure from Bearish to Bullish and from Bullish to Bearish: Here we need to be patience enough to wait for either the bearish/bullish previous high to be broken and making sure that the price breaks the VWAP before we can confidently take the trade. When such occurred in the market, you should take the trade because it is valid when this VWAP strategy is properly applied.
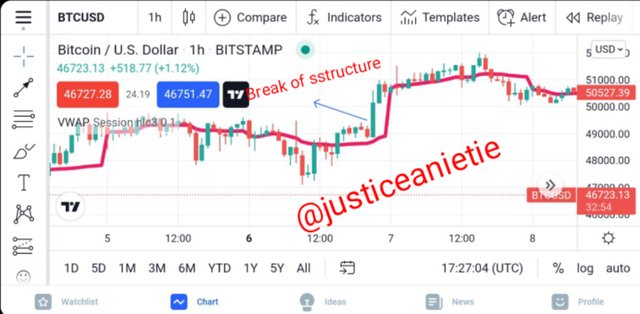
screenshot from my tradingview app
2. Retracement to the VWAP (use of the Fibonacci): When there is a bullish trend, there will be a retracement back to the VWAP, at this point, we need to make use of the fibonacci retracement tool to measure the last momentum from the bottom to top. What you should take note of is the 50% and 61.8% levels, those points are the optimal entry zone whenever the price return to the VWAP.
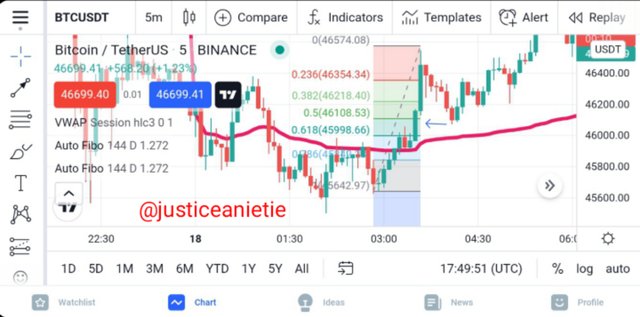
screenshot from my tradingview app
- Currect Management: If the Price retraced to 50% and 61.8% level , you should note that your stop loss must be below that retracement zone of 61.8% level. Then your target should be 1:1.5 or 1:2 as the highest.
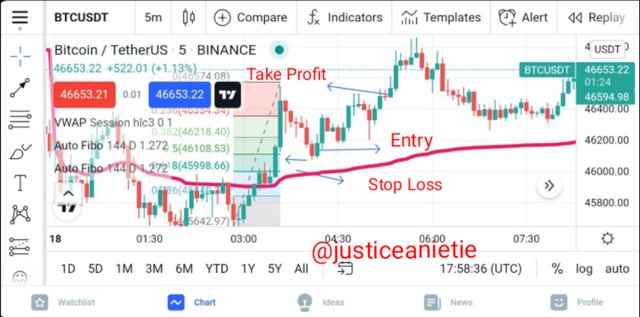
screenshot from my tradingview app

- Explain in detail the trade entry and exit criteria to take into account to correctly apply the strategy with the VWAP indicator?
To make a successful trading by applying the VWAP indicator is very simple and easy if only all that i have explained is strictly followed. Therefore, i will be presenting both bullish and bearish patterns using this strategy below:
For we to have a perfect entry is by seen a clear breaks at the zone either at the maximum or minimum. At this point, the maximum must be overcome if not, the trade might not be effective. If you can not get a perfect entry, please i advise you wait and look for another opportunity when the price come to the zone again.
In either way the price is going, whether bullish or bearish, after we must have observe that the break out is valid, we must allow the price to retreat not mining the direction of price in the market. At this point, we will make use of our fibunacci retracement tool by placing it at the lowest impulse ant trace it to where the current price is, remember it should be at the zone. Then you should look for 50% and 61.8% level. But if this point is not observed, then the strategy is regarded as invalid because the trade will not be profitable.
While using this strategy, you must make sure to put proper risk management in place. This may include; Stop loss below the 50% or 61.8% level. Then our take profit must be bigger than or stop loss by placing take profit at 1.5.
This mean if we place our stop loss at 1, our take profit will be 1.5.
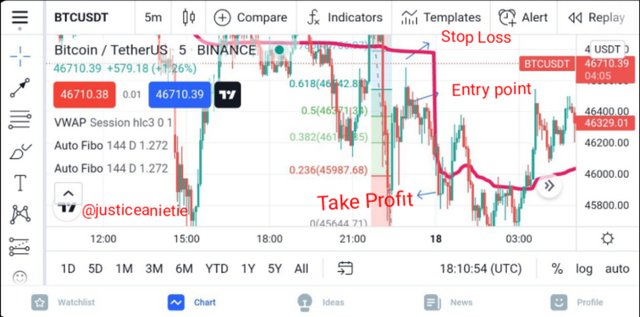
creenshot from my tradingview app
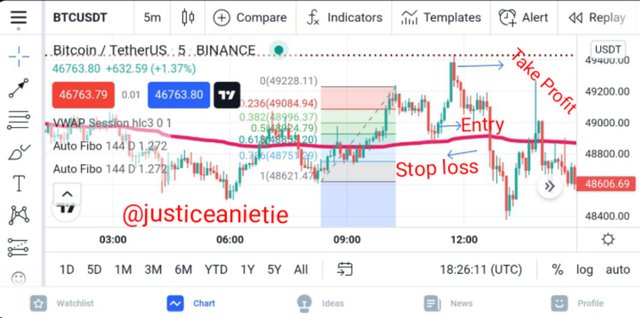
creenshot from my tradingview app

The way i have explained the VWAP indicator in details, if you follow it correctly, you will not have issue using the VWAP indicator.
Try to put more effort in learning all what i have said concerning this indicator in bit and you will see a change in your trading. Don't forget that in using the febonacci retracement, it must be at 50% or 61.8%.
Thank you for your time.