Hello great Steemians, i hope we all are doing great. Today i am happy to join and learn from this interesting topic presented by Professor @abdu.navi03. I will be submitting the solution to my assignment below:

1-Put your understanding into words about the RSI+ichimoku strategy

When we are talking about technical analysis, the Relative Strength Index is one among the indicators that traders normally used. The reason is that, we feel that it can give accurate result while using it.
indicator has two points which traders can based their decisions in the market and this is at the level of 30 and 70 level.
At point 30, this indicates that the market is over sold, so at this point traders can open a buy position in the market. While at point 70, it indicates an overbought region where a sell trade can be open or where seller have control of the market. Also note that it is good in filtering out false signals especially when the market is not trending.
Looking at how the RSI indicator can work, we can look at the measuring the price momentum of an asset in order to tell whether the asset price is over bought/sold.
The RSI has a line which range from 100 to 0, this helps traders to know when to trade the financial markets and it helps to display the strength of the market by detecting whether the market is being controlled by buyers or sellers. But you should also know that it has some lapses because sometime it does not move according to the price thereby leading many to take a wrong trade, while thinking it's the best. I want you to realise that you can use the line for your trade prediction but it can lead to a lost of trade. Whereas, the Ichimoku clouds is very sensitive when using it. This is because it give proper/ future direction of the trend before it occurs. By this direction, traders can make informed decisions on how to trade the market with the cloud direction. You should know that its calculation involves 5 moving averages which are calculated together in other to get the right results. It is based on this that the cloud is been formed which help traders to know the structure of the market by identifying the support zone, resistance zone, entry point, stop loss as well as take profit. Note even when we are looking at the cloud movement, there might be slack in time while the market might not be working in accordance with the moving averages and this might cause a wrong trade to be open in the market.

2-Explain the flaws of RSI and Ichimoku cloud when worked individually

The flaws of RSI indicator can be seen below:
The RSI does not identifying trend of asset for longer period of time and we should know that it is a momentum based indicator, because of these it is limited to its functions thereby producing false signals to traders during trending market.
Now trend reversal might occur while the market might be at the overbought/sold region and it might be for a longer time and based on this, it might lead to loss of trade.
The signal to execute trade is not made available by the RSI
You can not see the entry and exit of an asset due to lack of appropriate volume provisions.
The flaws of the Ichimoku cloud can be seen below:
It leads to late entry as the Ichimoku indicator produces late signals based on the asset price.
Buyers and sellers depicted by the movement of the cloud
Since it prediction is based on historical data to identify the movement of trend, this leads to false signals
If the right timeframe is not used in placing trade, it can lead to false signal on Crypto asset.
The cloud can make a trader to take a trade that is not valid.

3-Explain trend identification by using this strategy (screenshots are required)

In identifying this trend using this strategy, we can look back at the 70 level which is the overbought level of the asset price but buying pressure can also be seen in the market when the price is making higher high and higher lows.
At this point, when the RSI indicator has a confirmation, the Ichimoku Cloud indicator can now function properly for easy identification of the buying pressure in the market which help in rising the Crypto asset price. However, when the market price is above the Ichimoku cloud, this signify a bull market and not if the cloud expand in size, it means that there is momentum in the market.
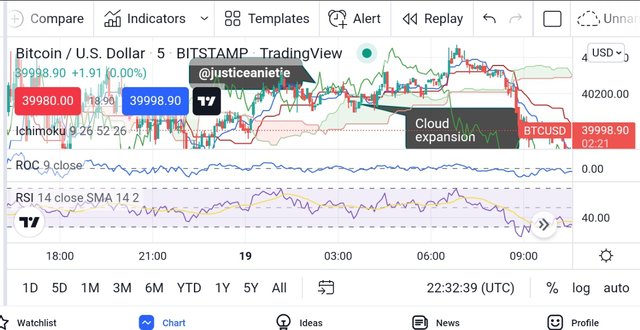
Screenshot from [trading view]
You should also have a clear understanding that when the price of the RSI is below line 30, it is an indication of an oversold condition. Also note that when the market continues in making lower low and lower high, it a confirmation of sellers taking over the market.
For easy identification of price using Ichimoku cloud during a sell market, it's when the asset price is below the cloud. A a trader you should know that whenever the cloud is expanding, that is when there is momentum in the sell market.

4-Explain the usage of MA with this strategy and what lengths can be good regarding this strategy (screenshots required)

In this section, we will see how to use Moving Averages together with our existing strategy. MA helps in identifying trend reversal also trying to help traders by filtering signals which are not real in the market. However, since the Ichimoku cloud has a small period, therefore, we are going to use MA with period 100 and this will be very ok for this strategy. This removes false signals and give correct trend reversal.
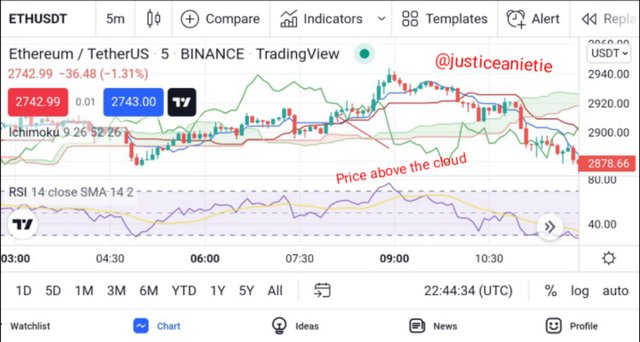
Screenshot from trading view
When can see how 100 period MA was successfully applied in our BTCUSD chart above,
We can see that the price BTCUSD is trading above our 100 MA. This indicate an uptrend and this help in reducing false signals

5-Explain support and resistancet with this strategy (screenshots required)

Here we will be looking at how we can combined RSI and Ichimoku indicators.
As a trader, you need to know and identify trade and resistance level on a price chart. When we have a trending market, the ichimoku cloud indicator is usually used to identify support and resistance levels. When the market is ranging, note that the RSI is used in identifying trend as well. We will see this in details below:
Trending Market
Whenever we have a trending market, you will always see the Ichimoku cloud functioning mainly as a support and resistance levels of the price of the asset in an uptrend. However, when the market is selling, the ichimoku cloud equally serves as resistance when we have a red cloud support also not that when we have a contraction of cloud, note that the market is getting ting week.
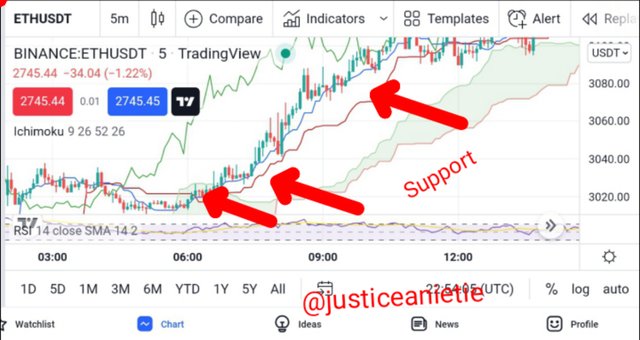
Screenshot from[Trading view]
Sideways Market
The RSI service a support and resistance level of a crypto asset on a chart. As a trader, you should always know that the overbought and oversold region serves as support and resistance.
[Source]

6-In your opinion, can this strategy be a good strategy for intraday traders?

This strategy is good because of the following reasons:
Both trending market and the sideways market are utilized by intraday day traders. Here the RSI is very important because the support and resistance of the asset is identified using the overbought and oversold region as well as the ichimoku direction of trend is based on it.
this is a very good strategy for intraday traders because it assist them in identifying the support and resistance level in both trending and sideway market.
To avoid making loss in the market, traders can make proper utilization if this strategy for a good entry and exit position.
This strategy will help traders to filter out false signals from the market. However, when this strategy is well applied by intraday traders, huge success can be achieved.

7-Open two demo trades, one of buying and another one of selling, by using this strategy

Below is a sell trade using BTCUSD with the strategy.
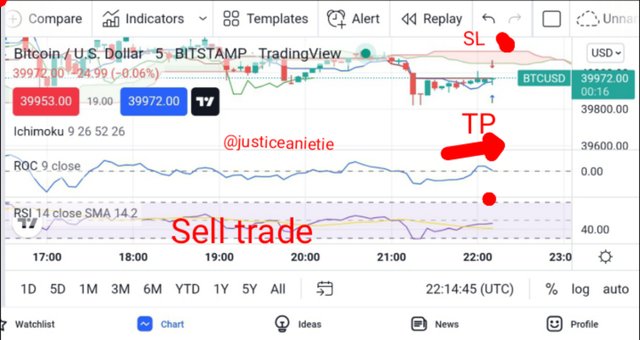
screenshot from [trading view]
Using the RSI +Ichimoku together with MA, makes trading meaningful. This is because we can now know that the RSI serves as a support and resistance at the overbought and oversold region likewise the ichimoku cloud which equally serves as a resistance and support.
You can learn more by reading in details of the overall post.
Thank you for your time.