
Hello great Steemians, i trust we all are doing better, i want to sincerely thank my Professor @reminiscence01 for this wonderful lecture on Psychology of trend cycle. Below is the solution to my assignment:

1.Explain your Understanding of the Dow Jones Theory. Do you think Dow Jones Theory is Important in technical analysis?

The idea of technical analysis comes from the Dow theory which was developed by Charles H. Dow in 1897. It was Dow that first have the foresight of the market trends, and he says that the market is either in a downtrend or uptrend. As old as this theory has been, it's still very useful in the market today. Dow believed on discounted prices of market transactions through the supply and demand as well as current economic news. Now when you have an in dept knowledge of technical analysis, you have an edge over price prediction and a clear understanding of the market trend. The theory is also known as Dow Jones theory which assist traders in forming an important based of technical analysis. The price and volume plays very important role for traders to gain the accuracy of price movement and this is achieved through the Dow Jones principles.

2.In your own words, explain the psychology behind the Accumulation and Distribution phases of the market. (Screenshots required).

The psychology of the market is in two phases and this helps traders to make their trading decisions either to open a buy order or a sell order in the market. However, i will be talking of the Accumulation and Distribution phases in the market below:
I want you to understand that as an individual with any amount of cash you hold, you can never move the market, the only thing you can do is to follow the market trend. The market is been controlled by big banks, companies or big players who has the purchasing power to manipulate the price.
When we have a strong downtrend in the market, what you have to do as a retail trader is to follow the trend and open a position. As the trend is going, the big banks start taking profit by closing some of their opened positions in the market while a new buy position is open. When the market reversed, the retail traders see's that the market has reversed, almost all of them tried to change their trade directions by closing their open position at a loss, this is to enable them to follow the trend and make profit from the market. When the demand of an asset is high in the market, this is what helps the price to move because more volumes are put into the market which calls for more buyers, however, this is the reasons for breakout and reversal of trend in the market.
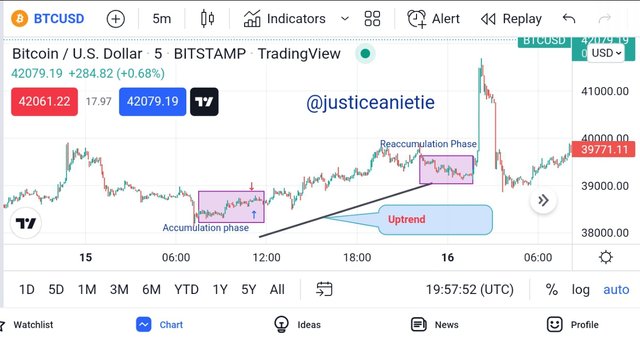
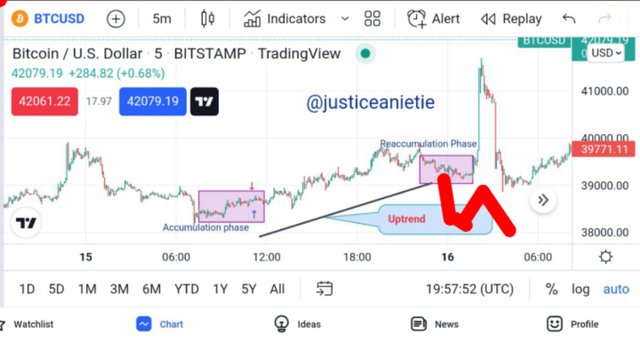
As i said earlier, the market is controller by big banks and not individuals. You can see that immediately the price breaks the accumulation zone, the market trend upward a bit and more long position was opened. At some point, the market is slow this is because the big banks who controls price has taken profit off the market.
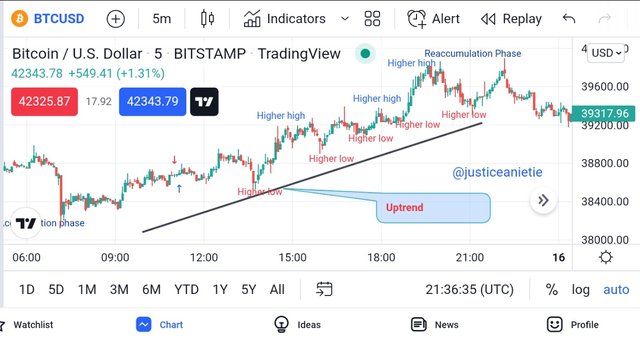
Therefore, traders can buy at lower price when the market retraced back in making a lower point, this is known as reaccumulation phase. It is always advisable to buy assets at lower price but most times, traders find it difficult to understand the accumulation phase for a reversal or distribution phase.
The reaccumulation phase as seen above is known as the trend continuation but you should know that once the price breaks below the low of the reaccumulation phase, the bullish trend is regarded as invalid.
At this phase, price is pushed down by more traders and most traders close their position at a lose, this is because the big players / banks have decided to close their positions in profit and living the market. However, this is done after the accumulation phase and when this occurs, we have a sideways movement of the market or a ranging market.
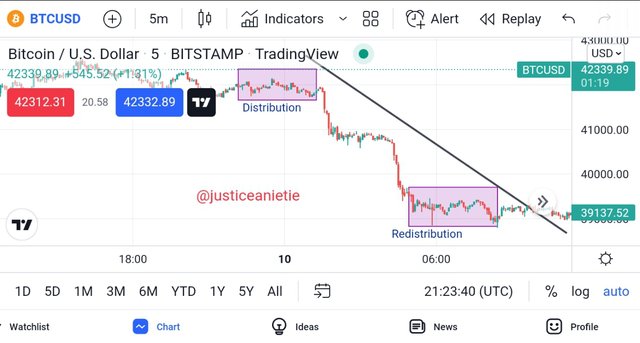
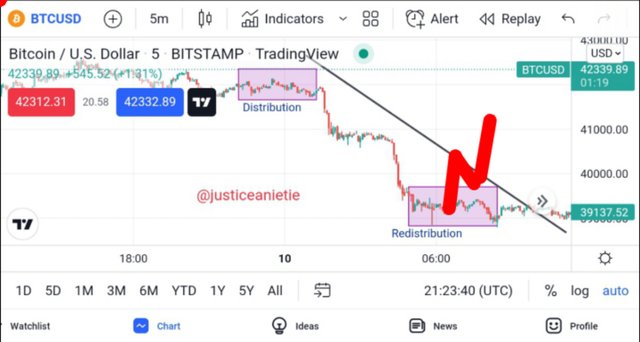
When we have a strong bearish trend, you will noticed that there is a retracement of price to the upside, this is known as the redistribution phase and this causesd by profit taken from the market. Therefore, it is advisable for you or traders to open more sell order for price continuation.
Now i want you to have an understanding about this, so that you will not get confuse and now think that redistribution phase is a point of reversal of the trend. A reversal only occurs when we have a breakout of price above the redistribution zone, this is where the reversal is confirmed.
When you do not have full knowledge about this phase of the market, you will find it difficult to know when to enter and exit the market. However, having the full knowledge of the trend cycle will give you an edge over the market and makes you to understand when to enter the market to avoid false signals in the market. Note, the truth is you can never know when the market controllers are opening position in the market.

3.Explain the 3 phases of the market and how they can be identified on the chart.

In identifying and explaining the three phases of the market, we will be looking at the Uptrend, Downtrend and the sideways market.
Uptrend:
Before talking of an uptrend, it is good to know about the market structure which assist traders to identify the current phase of the market as well as trend line. However, it is also good when we make use of indicators which help us in comforting the trend but if you know about market structure, this will be the best because it tells you the current trend movement .
Whenever we have an uptrend in the market, it is easily identified by higher highs and higher lows and it shows that there is high demand in the market and the market powers is been controlled by the bulls. Below is an example of and uptrend.
Downtrend:
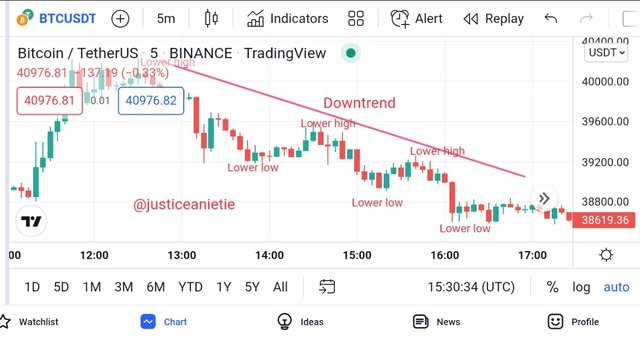
Whenever sellers takes over the market price, we have a downward trend. Downward trend is identified by lower highs and lower lows. You can see the chart below.
The Sideways Market:
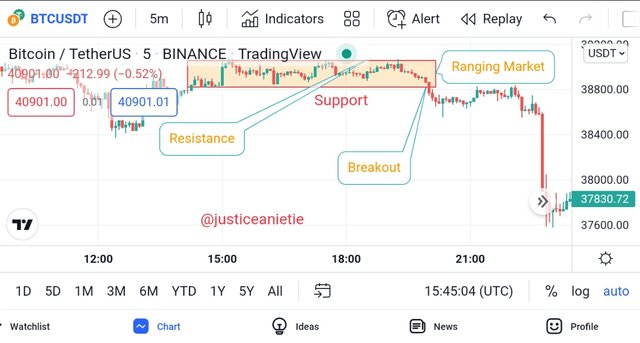
When the market is bouncing between the resistance and support level, we can say that the market is ranging, this can be seen during the accumulation and distribution phase. You should know that this point is an equilibrium point/price where demand and supply equates. Hence a new trend is formed as a breakout will occur on either zones. We can see an example below:
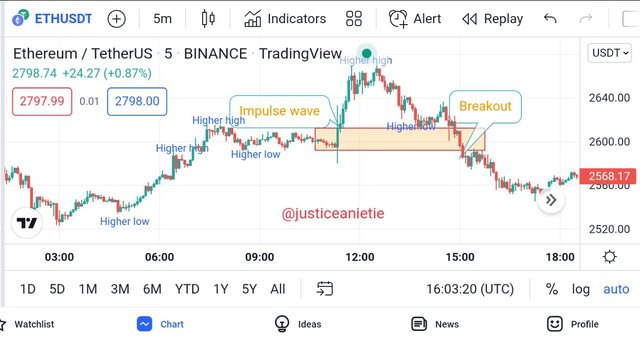
As the market is trending, we have the impulse and retracement which i have explained above. The impulse shows the direction of the main trend, while the retracement which is an opposite of the main trend. You should know that the process where we have the corrective wave in the market is about profit taken from the market. But when the current trend breaks the current low, we say this is a break of market structure which is a trend reversal as seen on the chart below:

4.Explain the importance of the Volume indicator. How does volume confirm a trend? Do this for the 3 phases of the market (Screenshots required).

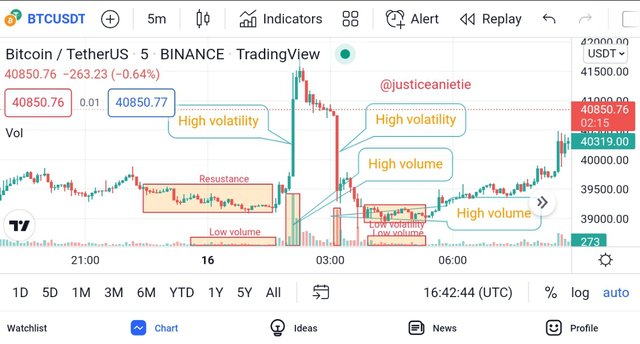
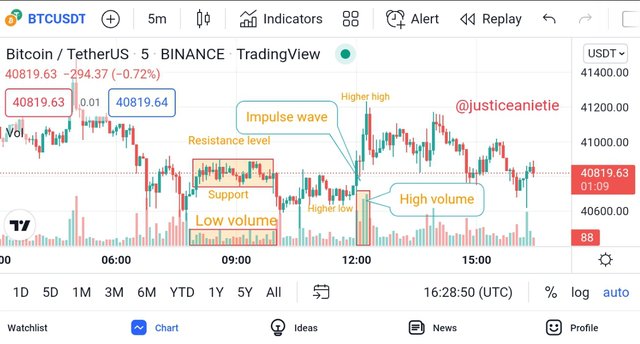
When we talk of volume, you should know that volume has a direct relationship with the market phase. We always experience a low volatility when the market is in the distribution and accumulation phase. Here the market is in a ranging state and when the volume is flat, it turns to support the current market state.
How does volume confirm a trend? Do this for the 3 phases of the market (Screenshots required).
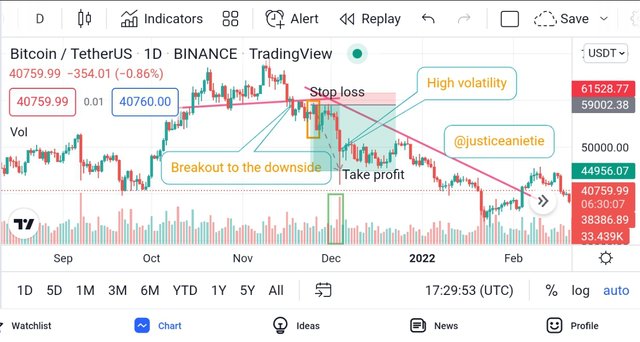
I will start by looking at an Uptrend. Whenever the market volatility is high, there is always an increased in the volume. When the volume is very high. note that there will be a breakout at the zone. Now during downtrend, when the selling pressure is high, the volume always increases which means that there is a selling increased in the market.
When you look above you can see that the is a bearish movement in order to assist the trend retracement. The volume is used in supporting the trend signal.

5.Explain the trade criteria for the three phases of the market. (show screenshots)

I will be explaining the trade criteria for the three phases such as the Bullish, Bearish and the Sideways Market.
Bullish Trend
I have explained how a trader can identify the movement of price in a chart using market structure. However, you should take note of the following before placing an order in the market.
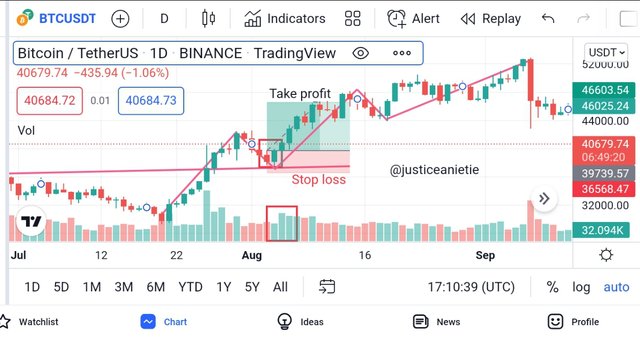
There must be an increase in the volume help in supporting the bullish formation. Therefore, you must make sure the price is in an uptrend making higher highs and higher lows.
Allow the market to come to you by waiting for a retracement of the price back to the point of demand (support), once the trend reverse to its original direction, open a buy order slidely above the previous high after a bullish engulfing candlestick formation.
Always set your stop loss once you execute a trade. The actual point to placed your stop loss is below the current previous low of a candle or wick, with a risk to reward ratio of 1:1 or 1:2.
The chart below will explain in more details
Bearish Trend
Make sure that the market is in downtrend, making lower highs and lower lows and this is support by an increased in the volume.
Allow the price to retrace back to the high point and once you see that the market is reversing back to the downside, and you see a bearish engulfing candlestick, execute a sell order.
An illustration of the above can be seen below:
Sideways Market
In a sideways market, there is no trend and this market is very risky due to breakout might occur at anytime as well as the manipulation of the market price. However, in trading the sideways market, proper risk management should be put in place but my advice for newbie is to stay out of this kind of market.
Therefore, trading the sideways market is for you to discipline your self by placing a buy order at the support and placing your stoploss below the support, while your take profit should be at the resistance point. The opposite should be the entry criteria for the sell trade.
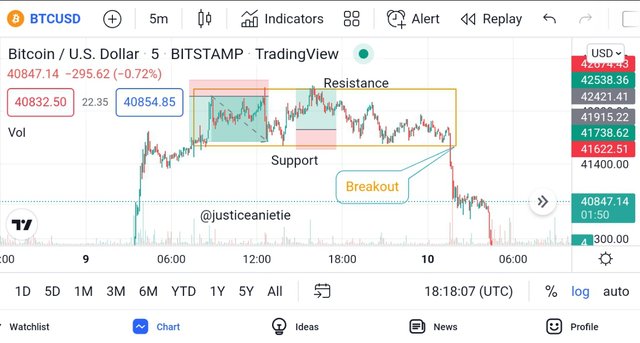
This sideways market can be of advantage to you when you follow the rules of entering a trade.

6.With the Trade criteria discussed in the previous question, open a demo trade for both Buy/ Sell positions.

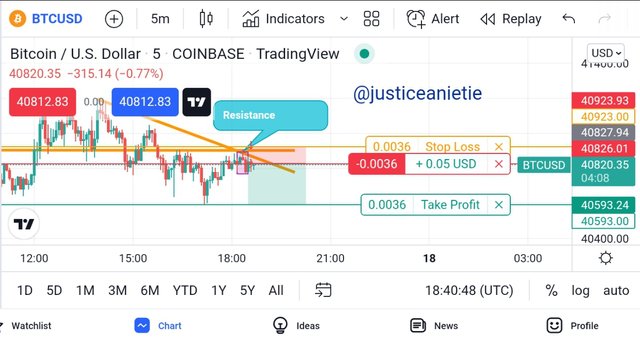
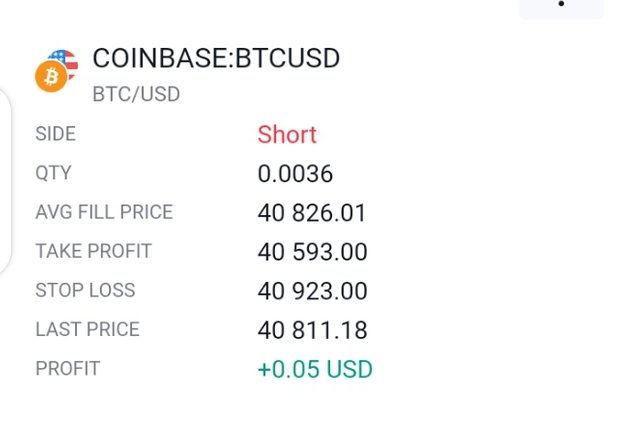
This is a bearish position in a range market. I have entered in the market using BTCUSD. As you can see on the chart, immediately the breakout occurs, the market trend down and retrace back up to the support and at this point we have a bearish engulfing candle which is a confirmation for a sell position to be open and i took my trade immediately as you can see on the chart above.
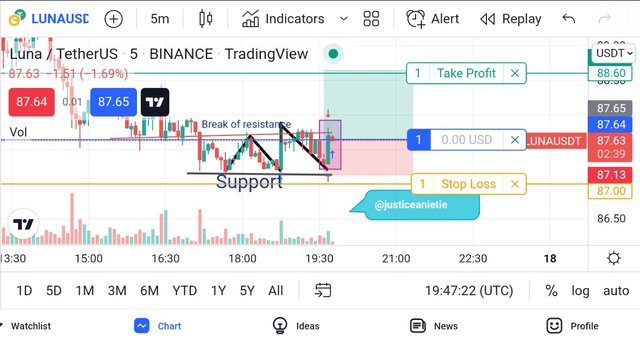
When you look at the chart above, you will see that the market is bouncing at the support, then you can see that i have entered a long position with the help of a bullish candlestick and the resistance was broken. LUNAUSD is the Crypto trading pair i have used.

Understanding technical analysis is very important as a trader because it will give you the knowledge to execute your trade early rather of you waiting for an indicator.
When you combine technical analysis and indicators like the use of volume as discussed above, you will see that it helps to to know when there is momentum in the market.
You should have positive reversal in the market with an engulfing candlestick before executing your trade either buy or a sell trade and make sure you have placed your stop loss and take profit using proper risk to reward ratio.
Thank you for your time.
Hello @justiceanietie , I’m glad you participated in the 4th week Season 6 at the Steemit Crypto Academy. Your grades in this Homework task are as follows:
Recommendation / Feedback:
Thank you for participating in this homework task.
Downvoting a post can decrease pending rewards and make it less visible. Common reasons:
Submit
Thank you Prof., i appreciate your efforts and i will do my best in your next class.
Downvoting a post can decrease pending rewards and make it less visible. Common reasons:
Submit