Hello everyone. Our world has been fighting a big epidemic for more than a year. I hope all of you are in good health. Stay healthy! Thanks for reading.
Today I will share with you the my homework given by the professor @kouba01

What is the MACD indicator simply? Is the MACD Indicator Good for Trading Cryptocurrencies? Which is better, MACD or RSI?
The MACD indicator is a kind of helper that gives us buy or sell signals and allows us to open trades in both directions. (Moving Average Convergence Divergence) This indicator shows the relationships and changes between different moving averages. In addition, the MACD allows us to predict the trend direction that may occur. The MACD indicator consists of three different components, and thanks to these components, we can trade. These components are; It is the MACD line, signal line, histogram, and zero line.
When using the MACD line, 12-26 period averages are generally used to calculate exponential averages. For the signal line, the 9-period exponential average is used. However, these periods may vary according to the strategy of the trader. The MACD histogram is used to calculate these variations due to the volatility of prices.
A trader can earn money by trading daily using the MACD indicator. The important point here is to know that this indicator is a help purpose and may not be 100% accurate. So, using only the MACD indicator to open a trade is wrong for me. Using indicators such as determined trend direction, support and resistance zones, RSI and MACD together will increase your trading success even more.
If I were to choose between the MACD and RSI indicators, I would choose the RSI indicator. The RSI is a more balanced indicator for both determining the trend direction and indicating overbought and oversold. Of course, in some cases, even RSI does not give 100% accurate results (For example, the last DOGE coin events. When we look at the RSI on a monthly basis, it remained at 90 - 100 levels for a long time and the validity of this indicator was ignored)


How to add the MACD indicator to the chart, what are its settings, and ways to benefit from them?
- To use the MACD indicator, click on the indicators and strategies (on Tradingview).

- Then, type MACD in the search field and click on the MACD text that appears in front of you.

- You will now see the MACD indicator below.
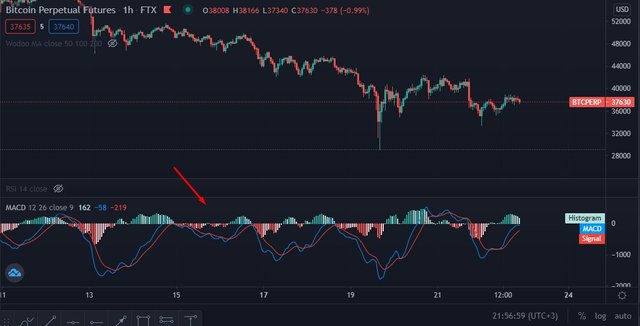
- Components such as the MACD line and the signal line appear in a way that is tuned for general use. In other words, 12-26 days for the MACD line and 9 days for the signal line are set. If your strategy is different, click the settings tab to change these averages.

- Then click the inputs option in the window that opens. You will see the fast length, slow length and signal smoothing you want to change.

- The most accurate way to use these components is by MACD and signal line intersections. These intersections allow us to predict variation in prices.
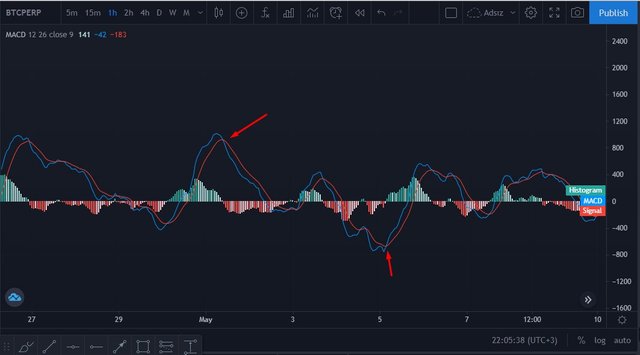

How to use MACD with crossing MACD line and signal line? And How to use the MACD with the crossing of the zero line?
MACD line and signal line intersections are divided into two types. These; bullish signal line intersection and bear signal line intersection.
Bull signal line intersection
If the price is below the zero line in the MACD indicator and the MACD line has begun to cut the signal line, this indicates that prices are in an upward trend and is a buy signal.

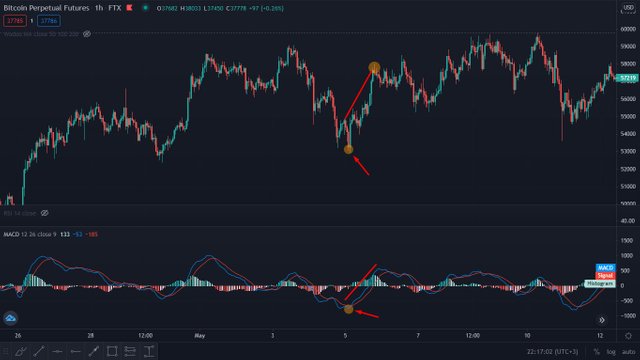
If the MACD line broke down the zero line, it would be heading towards the negative zone and signaling a strong sell. The intersections that occur from the negative region to the positive region have an important place in the buy-sell strategy. For example, if the MACD line crosses the signal line down in the positive zone, we can understand that prices are in a downward trend.
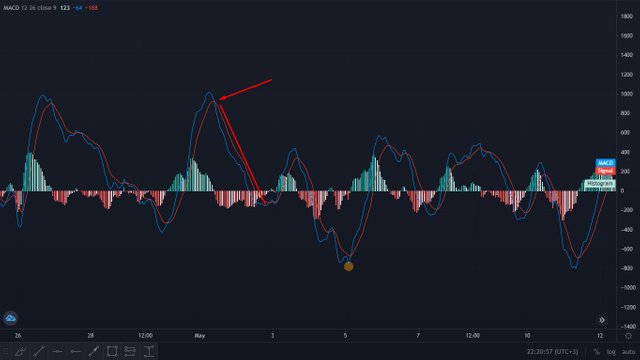
If the MACD line crosses the signal line up while the price is in the negative zone, this indicates that there is a buy signal and prices may rise.
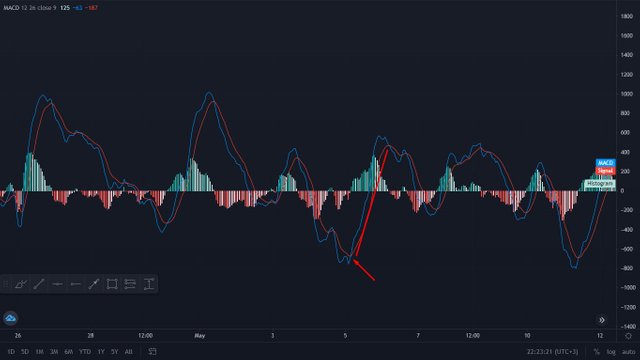

How to detect a trend using the MACD? And how to filter out false signals? (Screenshot required)
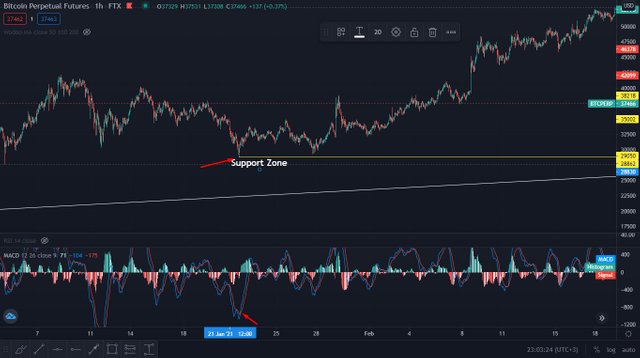
There are several methods of determining the trend direction using the MACD indicator. But I prefer to use the histogram here. The MACD histogram shows the difference between the MACD line and the signal line, and the further these two lines are from each other, the easier it is to predict the trend direction. Let's look at Bitcoin for example. We see a decrease in price towards the support zone. When the price started to fall from the resistance zone, the MACD line cut the signal line in a negative direction. This shows us that we are entering a minor downtrend.
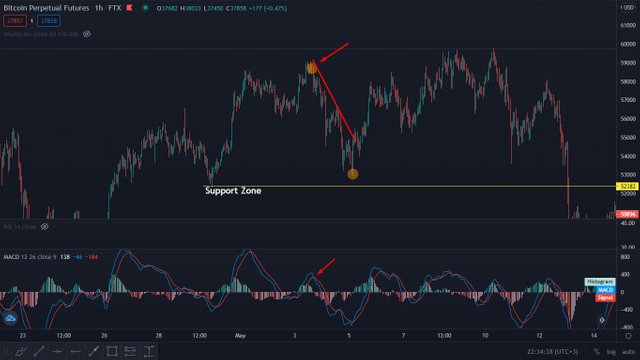
The buy response from near the support zone, the MACD line crossing the signal line in the negative zone indicates that a minor upward trend may occur. However, as I said at the beginning of the article, instead of using only the MACD indicator to set the trend, determining the support and resistance zones will be even more helpful in predicting the price trajectory. Thus, we can trade using the bullish divergence and bearish divergences in the MACD indicator.
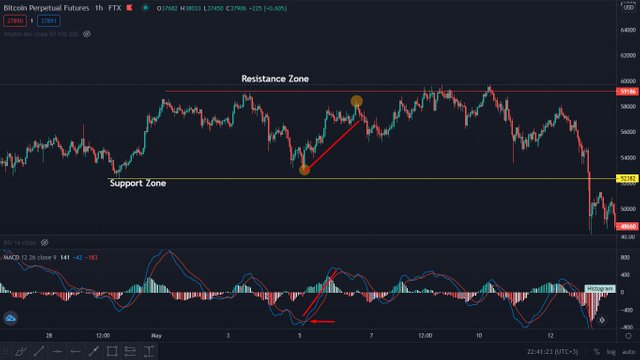
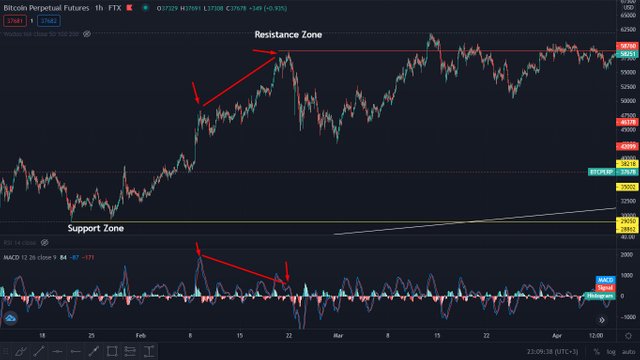
For example, in Bitcoin, which we are focusing on, we can make a sales transaction or take profit while approaching the resistance zone. However, as an example of the correct use of the MACD indicator, after the sales made in the resistance zone, the price is hovering below the zero line in the MACD indicator. In case the price rises again after falling, the MACD line cuts the signal line upward once again. The bullish divergence that occurs here shows us an uptrend that can continue from the region where we are buying, and indicates that the price may rise even higher than the point where it fell. After this transaction, our profit will be higher.
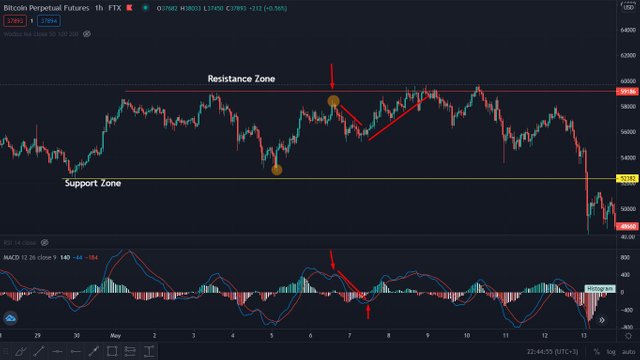

How can the MACD indicator be used to extract points or support and resistance levels on the chart? Use an example to explain the strategy.
It is also possible to identify support and resistance lines using the MACD indicator. It is also important that the price is above or below the zero line to make this determination. For example, when the MACD line cut the signal line, the price was in the negative zone. When we look at the previous value of the price, we see that the downtrend can end and we can enter an uptrend. As in the photo, the upward movement of the MACD line indicates that this place can now act as a support. When the MACD line crosses the signal line while the price is in the positive zone, the price has found a buyer from the support zone.
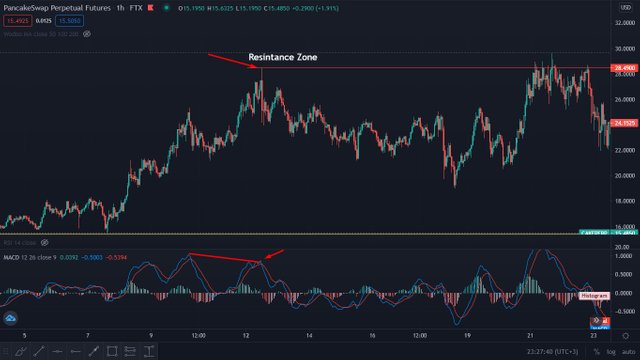
To reveal the resistance zone, the price crossed a downward cross in the MACD indicator, but the price continued to rise under the influence of the bullish divergence. While moving by making higher high, the lower highs made in the MACD indicator show us that the price has reached the resistance point and now sales can occur from here. If we examine the MACD histogram, we see that the distances between the MACD line and the signal line have started to narrow and therefore the histogram shows that we have now reached the point of resistance.

Review the chart of any pair and present the various signals from the MACD.
Now let's examine what we learned in Cake-Usd parity. First of all, we see a region that previously worked as a support. We are starting to use the MACD indicator. First, we expect the MACD line to cut the signal line in the negative zone. If an upward crossing has occurred and the price has reacted from the support zone, we are trading in the buy direction.
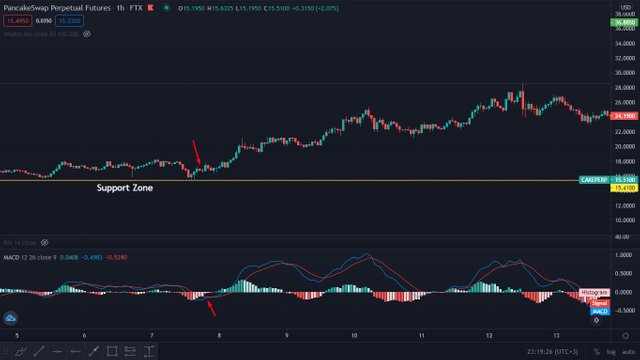
As you can see, the price started to increase from where we entered the transaction and an uptrend occurred.
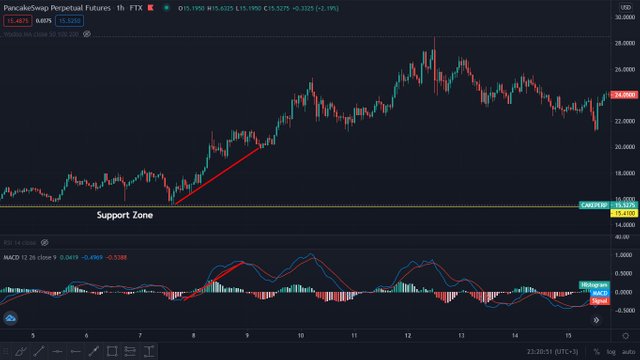
The bullish divergence that occurs here signals us that the price will rise further. We don't need to close the position. While making higher lows in the price, we make lower lows at the intersection of the MACD line and the signal line in the MACD indicator and we get the approval of the uptrend.
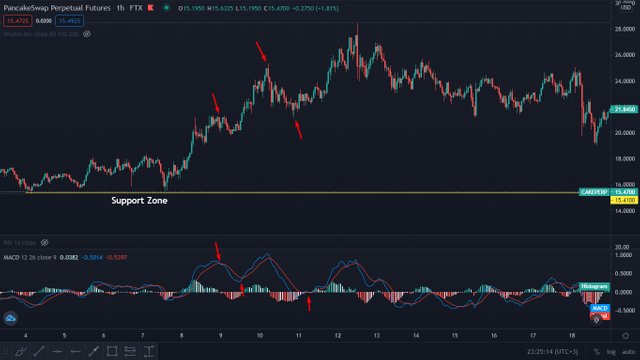
Now is the time to determine the resistance zone. We see that the area where the MACD line crosses the signal line is at a lower level than the previous one, and this shows us that the price has reached the saturation point and we can now enter a downtrend. Now is the time to close the transaction that we have progressed by taking profit. When we reach the intersection in the indicator, we can close the transaction. As you can see, the price goes down after this point.

CONCLUSION
In this article I tried to explain to you the auxiliary role of the MACD indicator in our transactions. You can also enter transactions using it alone, but this is not a recommended situation. Opening a trade using all we know and helpful indicators is the most important way for our transactions to be successful. Always identify your supports and resistances and enter the transaction. Take profits and never forget to stop-loss.
CC:
@kouba01
Hi @kadabra
Thanks for your participation in the Steemit Crypto Academy
Feedback
This is very good work. Well done with such a detailed and practically demonstrated understanding of the MACD trading indicator
Homework task
9
Downvoting a post can decrease pending rewards and make it less visible. Common reasons:
Submit
Thanks professor
Downvoting a post can decrease pending rewards and make it less visible. Common reasons:
Submit