Hello everyone, it's nice to meet again this week, this time I will try to complete the assignment from the professor @lenonmc21 . The task this time is very extraordinary, I am very excited to do it.

1. Define in your own words what is Price Action?
Price Action is a technical analysis where the technical analysis in question is the analysis of price movements or price charts that keep changing every second, minute, hour, day and up to the year of course.
In the market, people who have just joined as novice traders they very rarely think about this kind of technical analysis, all they follow is the state of the market when they start without thinking long about the risks they will get later.
Basically, price action should be a consideration that must be considered in making a decision to start trading. Performing short, medium, and long term analysis of course needs to understand and see firsthand how the charts in the market are. Indirectly, this price action teaches us to be able to understand the market conditions correctly when we want to trade.
Here I explain a little about the Bullish Trend, Bearish Trend and Candlestick:
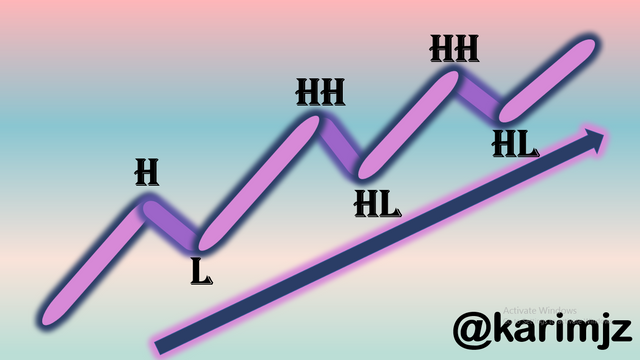
Bullish Trend
Bullish trend is formed by the presence of a pattern where the pattern is like HH-HL-HH-HL and so on until later from the pole that will form an angle that will continue to go up and formed an angle of 450.
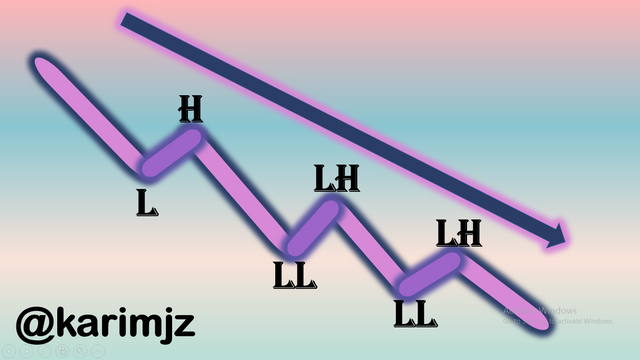
Bearish Trend
This second trend is a bearish trend, this trend has a pattern where LL-LH-LL-LH and this trend is the opposite of the previous bullish trend which formed an angle of 450 up but the bearish trend formed a 450 angle down.
Candlestick
Candlesticks are one of the basic ways to understand how to read price charts in trading. By learning to understand candlesticks we can determine the right time to start trading. But of course we need to understand first about the pattern of the Candlestick.

Bullish Trend is a candlestick that is experiencing an increase in market price. The color of the Bullish Trend is green, but if you find white in the market it is also included in the Bullish Trend Candlestick.

Bearish Trend is a candlestick that is experiencing a decline in market prices. The color of the Bearish Trend is red but if you find black in the market it is also included in the Bearish Trend Candlestick.
2. Define and Explain in detail what the "Balance Point" is with at least one example of it (Use only your own graphics)?
Break Event is a balancing point between buying and selling. The point of balance is a point where we will not experience a loss and we also do not gain. At this point we must really be able to understand how to read candlesticks correctly. Maybe not everyone wants balanced results but this is good enough to keep your capital stable.

In the XRP/IDR trading chart above, it can be seen that to determine the Break Event, the thing that must be done is to move the stop loss process which you previously placed at 24,296, shifting it to 24,011 where this is the initial price you chose when starting trading.
3. Explain clearly step by step to run Price Action analysis with "Break-even"?
The most basic thing that we really have to understand is to look at market conditions so that we don't get the wrong direction.

Market Conditions.
The next thing you have to do is determine the time to trade 1 hour 30 minutes is enough to see market conditions it is very important for us to understand when to exit and re-enter the market at the right time. then start to analyze support and resistance points so that we can prevent losses from seeing candle patterns that can cause break events and we can place stop losses correctly to anticipate losses and our capital is saved.

Time, Suport and Resistance
4. What are the Entry and Exit criteria using the breakeven Price Action technique?
Entry and Exit criteria using price action techniques need to know that traders need to enter when they have monitored market conditions first, but if they continue to enter and will experience losses, I think break events need to be used to keep capital safe.

In the picture above we can see on the blue arrow line there has been a long downward process after that there was a price movement that started to become unstable at that time we need to lock the levels of support and resistance because then usually there will be a long uptrend movement.

After locking the support and resistance levels, we can see market conditions that have started an uptrend, we can already make preparations to buy after the last support candle.
5. What type of analysis is more effective price action or the use of technical indicators?
If we look at all the lessons above, I think understanding market conditions is the main thing. Technical analysis with price action is good enough considering that in this position we can save our capital because capital is quite important.
Basically if new people come to start trading if they learn a little maybe without them realizing they have used technical analysis of price action even though what they did wasn't right but it's not too bad for a beginner who just plunged into the world of trading.
I personally traded for the first time after solving the questions from the professor in season 1 but in season 1 the questions I often worked on were not related to charts more to basic lessons about coins then I signed up for upbit and started buying coins and without realizing it I used price technical action analysis, but not yet correctly, there are still wrong steps and also experiencing some losses, I think understanding price action more deeply is good enough for every beginner.
Practice (Only Use your own images)
Make 1 entry in any pair of cryptocurrencies using the Price Action Technique with the "Break-even Point" (Use a Demo account, to be able to make your entry in real time at any timeframe of your choice)
Here I have bought some coins when the market was heading for an uptrend but so far I have not sold them and still keep them.

I bought Dogecoin at 3,420 IDR and I also bought ONBUFF at 2,137 IDR.

Currently the market condition is in the process of a drastic decline but I haven't sold my coin yet and am still holding it.
Conclusion
Price Action is a technical analysis where the technical analysis in question is the analysis of price movements or price charts that keep changing every second, minute, hour, day and up to the year of course.
Sorry if there are words and writing that are wrong, if other friends want to comment, please comment in the comments column below.
Thank you for reading my writing, see you in the next assignment.
Best regards @karimjz
CC:
@lenonmc21

