Assalamu Alaikum
This is @kawsar from Bangladesh.
Today in this post I will share with you my Homework Task (Season 3/Week-5) for Professor @kouba01 . The course that the professor @kouba01 Trading Crypto With Ichimoku-kinko-hyo Indicator.

1. Discuss your understanding of Kumo, as well as its two lines. (Screenshot required)
Kumo Cloud is basically made up of two lines: senkou span A and senkou span b. senkou span A and senkou span B This kumo cloud is created in the space between these two lines.
Senkou span A or Leading Span A is a line used to measure momentum and gives a trader a good idea based on the level of support and resistance. senkou span B is calculated as the highest value of the last 52 periods + the lowest value / 2 and this is the moving average.
senkou span A is the point between Tenkan and the Kijum. senkou span A and senkou span B have been created in 26 future periods. Provides a glimpse of where support and resistance may develop at a later time


2. What is the relationship between this cloud and the price movement? And how do you determine resistance and support levels using Kumo? (Screenshot required)
Relationship between this cloud and the price movement?
As long as the candlestick is above this cloud, the pair is considered as upward bullis / uptrend and as long as the candlestick is below this cloud, this pair is considered as downward / downtrend. As long as the candlestick is inside this cloud, nothing can be said about this pair for sure. Because then the trend can go up and down again. Certainly no idea is made from here.
In short we can say the matter this way:
- Above the candle cloud = pair is up / bullish / uptrend.
- Under the candle cloud = pair is bearish / downtrend.
- Inside the candle cloud = pair is sideway.
Determine resistance and support levels using Kumo?
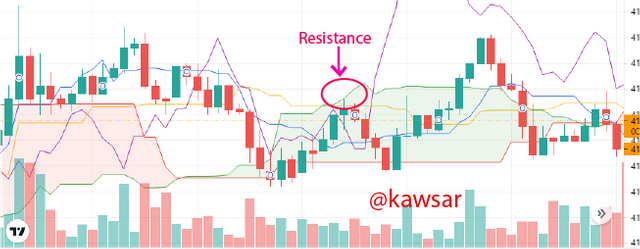
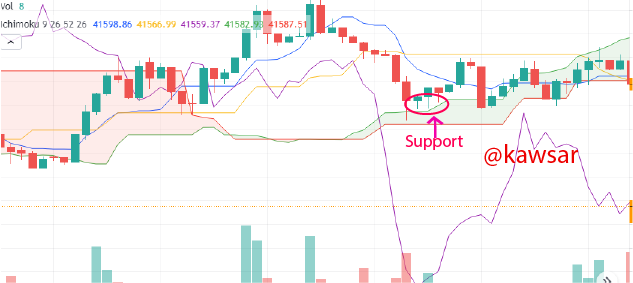
These Kumo cloud lines often act as a good support or resistance. Many times it is seen that as the price rises, it collides with the cloud at the top and starts falling down again as a resistance. Again a lot of the time the price starts to rise up as support as it pushes along the declining line. So we can also call it support and resistance.
Resistance:
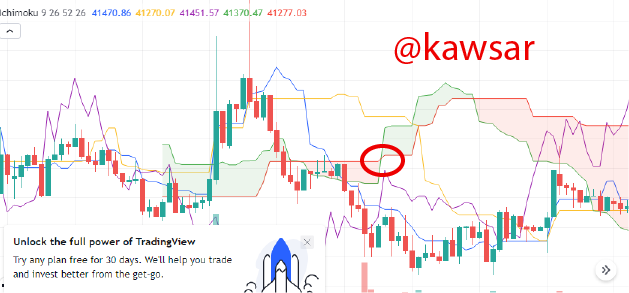
From this screenshot below we can see that Price once tried to go from the bottom to the top but, after colliding with the kumo cloud, the price went down again. Sometimes this Kumo cloud also acts as a resistance.
Support:
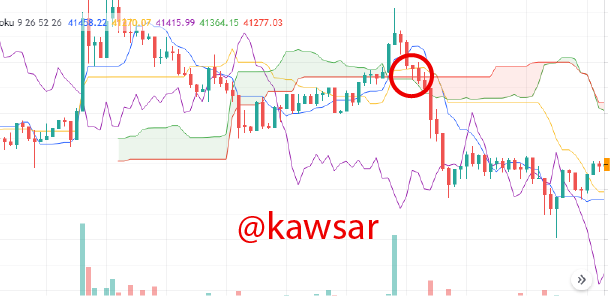
From this screenshot below we can see that the price tried to go down further and lower, but the price could not go down after colliding with this kumo cloud. So this kumo cloud is working as support here.

3. How and why is the twist formed? And once we've "seen" the twist, how do we use it in our trading? (Screenshot required)
How and why is the twist formed?
Twist is an event where both senkou span A and senkou span B change their position. These will shift their lines. Such things could be like this: Suppose at this moment, Senkou span A is above Senkou span B. In this case, Senkou span A will go up and Senkou span B will go up and Senkou span A will go down. Similarly, if Senkou span B is above Senkou span A, then Senkou span A will go up and Senkou span B will go down.
Whenever there is a twist like this, the color of this cloud will change, that is, if it is red, it will turn green, and if it is green, it will turn red. Using kumo twisting we can easily identify it before it becomes a trendy reversal. Through this kumo twist we see the trend of two changes. An uptrend is another downtrend. If Senkou span B passes Senkou span a below, then it is bullis or uptrend
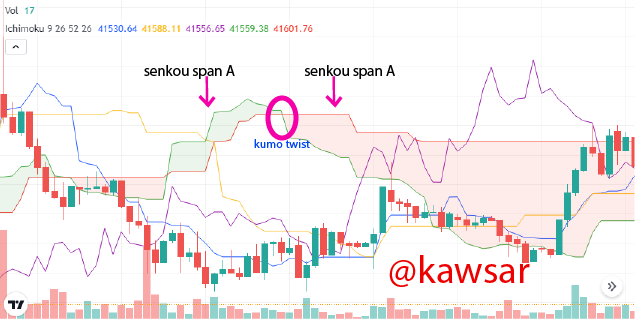
From this screenshot above we can see that the color of this kumo changes whenever it is twisted.
How do we use it in our trading?
We already know that a twist always predicts a change in trend and we can use it as an initial signal to enter the market. And if we're in an uptrend and there's a twist, we realize that a change can happen now, a change in a downtrend.
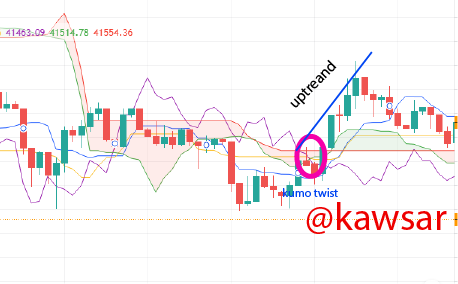
From the screenshot above we can see a twist and after this twist we can see an uptrend in the market that has started to go a little uptrend since the twist in the market. This way we can easily trade from this kumo cloud and get good results.

4. What is the Ichimoku trend confirmation strategy with the cloud (Kumo)? And what are the signals that detect a trend reversal? (Screenshot required)
We already know that as long as this candlestick stays above the cloud, it means that the market is on an uptrend now that the market is going up, so we can buy buy from here. When the candlestick is under the cloud, it means that the market is going downtrend, which means we can sell from here. And when this market is inside the candlestick, it is not possible to say anything about the market, so it is better not to trade when the market is inside this candlestick. There are also more ways through which we can trade when and how. We can understand when the market will be uptrend and down trend.
Twist & Cloud Break:
When we see a twist in the market, we realize that the market is about to change. If the market is in up trend then we understand that the market is going in downtrend now and if the market is in up trend then I can understand that the market may go in downtrend now. So when we see the market downtrend, we can understand that the market is now on the up trend and we can take buy orders from there if we want.
The reversal price for the trend must be surpassed by the cloud. Price must break through the cloud. Because a lot of the time the market can go inside the cloud. So of course the cloud has to be broken for the reversal of the trend.

5. Explain the trading strategy using the cloud and the chikou span together. (Screenshot required)
If candlesticks fall below Kumo, the downtrend doesn't start immediately. It is often seen that candlestick. After being inside the cloud for some time or below the cloud, it goes up again, that is, the uptrend starts again. Similarly, the yellow / green line or Chikou-Span will help us to make the right trade decision when it is seen that the candle breaks through the clouds from time to time and then moves below or inside the clouds again.
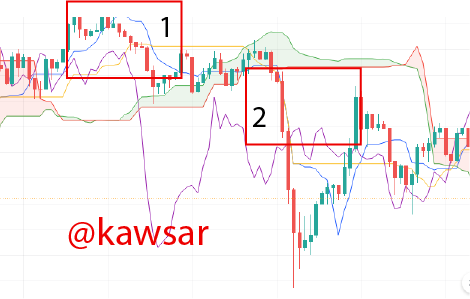
See the example below, the candlesticks in the picture No. 1 have risen above the clouds, and after a while the yellow and the clouds have risen above the clouds and subsequently a strong uptrend has been seen in the market. In the second candlestick we can see that the candlesticks are coming down through the cloud and the yellow Chikou-Span is coming out by itself and from here the long down train has started.

6. Explain the use of the Ichimoku indicator for the scalping trading strategy. (Screenshot required)
By scalping trading we usually mean a short trade. A trader trades a lot throughout the day and these trades are very short term i.e. very short lasting full. For example, if you want less than one minute a day, 1 minute, 2 minutes or five minutes, 15 minutes is used in this scalping trading.
This happens in a very fast time and through this scalping trading a trader tries to make a profit in a fast time. So using this scalping trading a trader can trade through it. And since there are so many shorts, he can trade a lot through this scalping trading of a trader.

We have already learned that when Senkou span a and Senkou span B change, it is called a como twist. And if this Como twist, then a lot of changes can be seen in the market. For example, if the market is up there then the market goes down because of this como twist and if the market is down then the market goes uptreand from here. In that case we can see through the screenshot below that the market is going up now then we can place a buy order from here. And for short time trading, of course, the Kijum line has to sell when the price breaks. So we will sell it.

7. Conclusion
This Ichimoku-kinko-hyo Indicator is very important for a trader and with the help of Ichimoku-kinko-hyo Indicator a trader can take his trading idea and his trading experience a long way. Especially short time traders can trade very well with it and expect a good result. However, if you want to trade, you must have a lot more trading technical analysis. In addition, this Ichimoku-kinko-hyo Indicator provides many ideas and some future ideas.
Hello @kawsar,
Thank you for participating in the 5th Week Crypto Course in its third season and for your efforts to complete the suggested tasks, you deserve a 3/10 rating, according to the following scale:
My review :
An article with poor content due to the absence of analysis for several aspects of the topic, and here are the details.
Your interpretation of the cloud was good and clear, however, you did not deepen the analysis of the two lines that make it up.
As for the relationship of this cloud to the price movement, it can be determined according to the thickness of the cloud, where the higher the density of the cloud, this indicates the high volatility of the market in that period. The increased price movement and its volatility will lead to the divergence of the two lines, which gives us the impression of stronger fluctuation in the price movement.
As for determining the levels of support and resistance based on the Ichimoku cloud, it differs from the traditional method, and this is what you are asked to interpret.
About the twist, you forgot to mention the case of entering a neutral trend (range), because very often when the cloud twists after a period of trend, prices enter a range (in 75% of cases). The twist indicates a weakening of the trend and in no way a change in the trend to come.
You did not explain well the signals from KUMO to observe the trend change.
In the fifth question about using the cloud with chikou span line in trading, your answer was superficial and did not provide the required information.
Thanks again for your effort, and we look forward to reading your next work.
Sincerely,@kouba01
Downvoting a post can decrease pending rewards and make it less visible. Common reasons:
Submit