Today in this post I will share with you my Homework Task (Season 6/Week-2) for Professor @fredquantum. The course that the professor @fredquantum has discussed with us "Crypto Trading Strategy with Triple Exponential Moving Average (TEMA) Indicator". I have learned a lot about The Triple Exponential Moving Average (TEMA) from this lecture of the professor.


Triple Exponential Moving Average (TEMA) is basically a kind of technical indicator, through which a trader can easily understand the current state of the market. We know that Moving Average is a very important indicator for crypto trading and all types of traders use this Moving Average. This is because the moving average is very easy to use and through it the current situation of many markets can be understood and the market can be analyzed. With Triple Exponential Moving Average (TEMA) we can easily identify the current market trends.
If we add this Moving Average to our chart, then with the help of this Triple Exponential Moving Average (TEMA) we can easily see a lot of things. Such as trend reverse, support, resistance market trends and so with the help of a trader can analyze when to enter the market and when to leave the market. If we use it with other indicators, we will be able to easily filter all the false signals we receive from other indicators with the help of this Triple Exponential Moving Average (TEMA).
It has some differences with other moving averages in general. It allows us to create signals with some space. With this we can easily get some signals according to the current situation of the market. For example, if the slopes move upwards, then we have to understand that it is now giving us an uptrend signal and if it looks downwards then it is a bearish market signal.
Triple Exponential Moving Average (TEMA) shows us the calculation by changing the price data and it can give us a very quick response to the current market situation according to the current price movement. Since it responds to us very quickly, we can easily understand the current position of the market and enter the market. This is a very useful and widely used tool for traders. We will learn more about it in the following tasks of this course.

Formula is Triple Exponential Moving Average (TEMA)

Calculating Triple Exponential Moving Average (TEMA)Averages:
All EMAs that are used to calculate TEMA are set at the same time. Triple Exponential Moving Average (TEMA) is calculated with the image above.
Adding TEMA to my chart
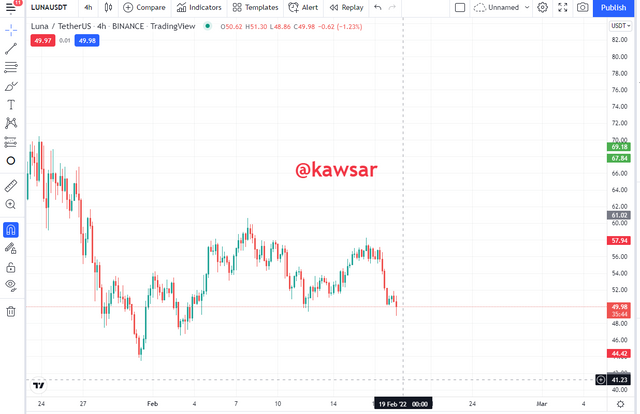
STEP-01: at first i go to tradingview.com and click indicators.
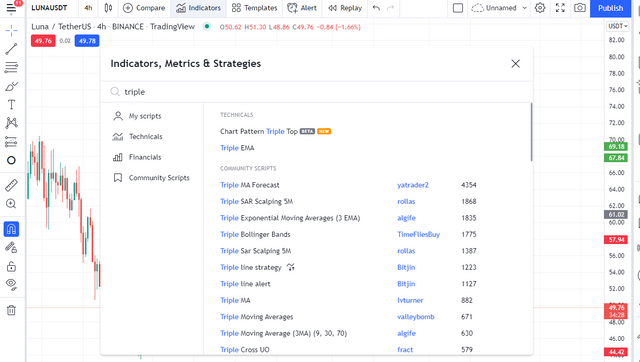
STEP-02: then when click indicator a search bar will appear me. i search here "triple" and select Triple Exponential Moving Average (TEMA) indicator. i click triple EMA.
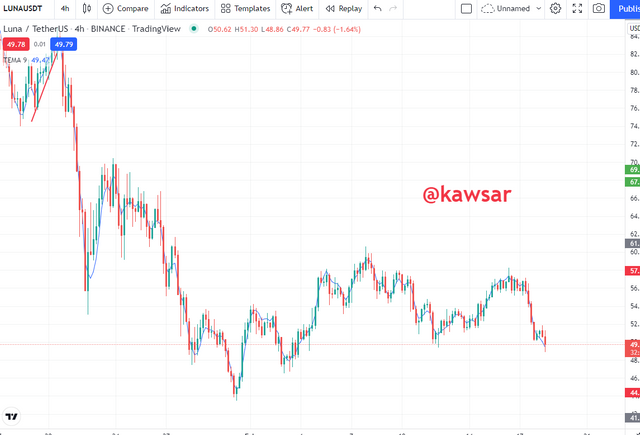
STEP-03: we can see, Triple Exponential Moving Average (TEMA) added in my chart.
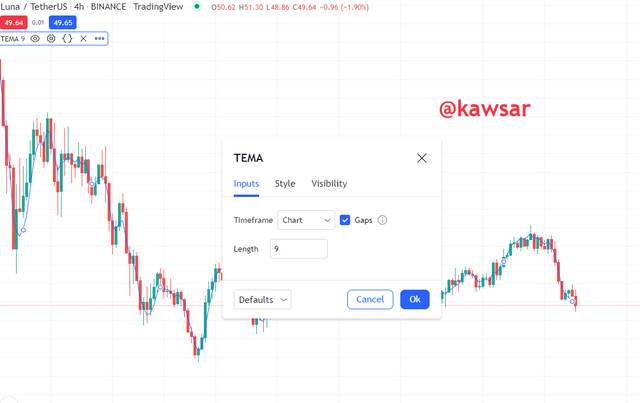
STEP-04: now i can change this indicators using settings option. i click settings button and inputs 9 then click ok.

So far we have known about Triple Exponential Moving Average (TEMA) and I mentioned earlier that there are some differences between Triple Exponential Moving Average (TEMA) and other general moving averages. So at this stage I will discuss what is the difference between Triple Exponential Moving Average (TEMA) and other moving averages. Today I will show the difference between EMA and SMA with Triple Exponential Moving Average (TEMA).
We must know that Triple Exponential Moving Average (TEMA) can respond to our current market conditions very quickly and we can respond to the current market very quickly. This is because the Triple Exponential Moving Average (TEMA) gives us signals very quickly based on the current market price action. But in the case of EMA, it signals us to be late, and because of this we are late to enter the market. Although it reacts very quickly with SMA prices, sometimes the signal can be wrong.
The Triple Exponential Moving Average (TEMA) gives us a very reliable price that eliminates the lagging factor completely, which is very sure or accurate. In the case of EMA, we see that a price is presented to us considering the average price of everything, excluding the lagging factor. Which is not entirely reliable. SMA's signal is also not completely reliable.
While TEMA acts as dynamic support, both EMA and SMA act as dynamic resistance. And while TEMA acts as dynamic resistance, both EMA and SMA act as dynamic support.

We have already learned a few things about Triple Exponential Moving Average (TEMA). At this stage we will try to find the bullish trend, bearish trend, support and resistance level through Triple Exponential Moving Average (TEMA).
Bullish Trend
When an uptrend starts, we see that the Triple Exponential Moving Average (TEMA) is going up along with the price chart and Triple Exponential Moving Average (TEMA) is acting as support from time to time. The position of Triple Exponential Moving Average (TEMA) is in the price chart. It will be down. If we see such a time, we will understand that the market will now go uptrend.
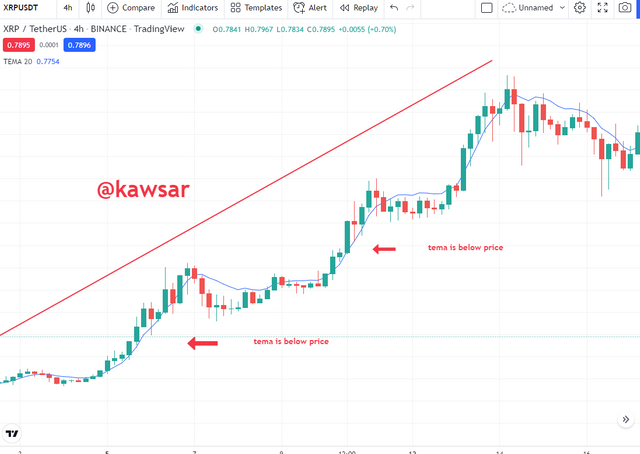
In the screenshot above we can see that Triple Exponential Moving Average (TEMA) is at the bottom of the price chart and the market is moving towards uptrend.
Bearish Trend
When a downtrend starts, we see that Triple Exponential Moving Average (TEMA) is going down along with the price chart and Triple Exponential Moving Average (TEMA) is acting as resistance from time to time. The position of Triple Exponential Moving Average (TEMA) will be at the top of the price chart.
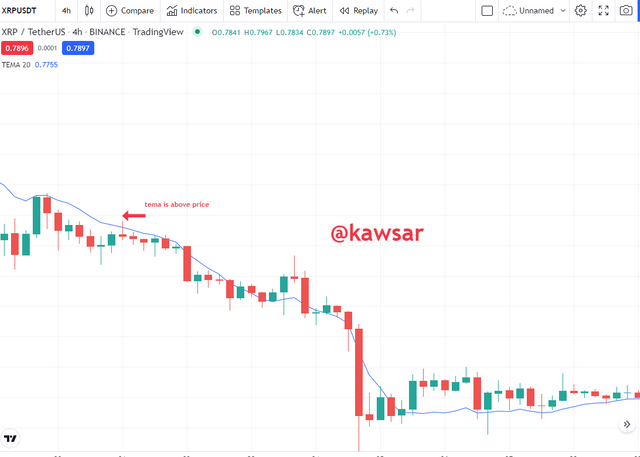
In the screenshot above we can see that Triple Exponential Moving Average (TEMA) is at the above of the price chart and the market is moving towards downtrend.
Support
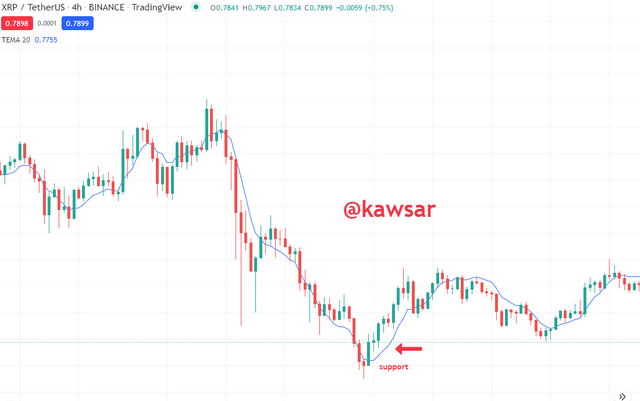
we know, Triple Exponential Moving Average sometimes acts as support in the chart. Below I have given a screenshot and the screenshot shows that Triple Exponential Moving Average (TEMA) is acting as support, it is acting as support label when going from downtrend to uptrend.
Resistance
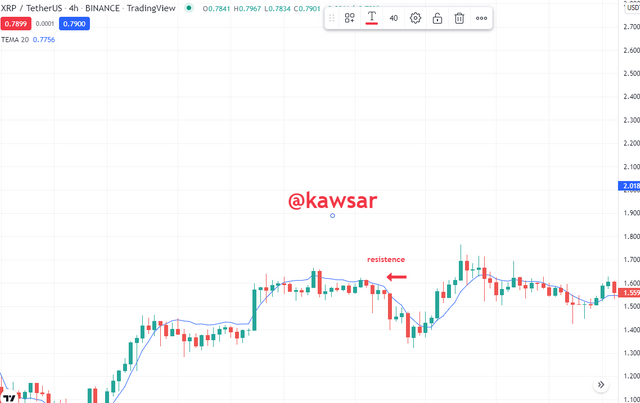
We've said before that Triple Exponential Moving Average (TEMA) sometimes acts as a resistence. Below I have given a screenshot and the screenshot shows that Triple Exponential Moving Average (TEMA) is acting as a resistance. It acts as a resistance label when going from uptrend to downtrend.

So far we have learned about Triple Exponential Moving Average (TEMA) and we have realized that Triple Exponential Moving Average (TEMA) is very important for us to understand the trend reversal, support resistance. It can make us react very quickly to the price, so sometimes it can give us the wrong signal. So to avoid these erroneous signals, if we add one fast Triple Exponential Moving Average (TEMA) to another slow Triple Exponential Moving Average (TEMA), we can filter and use it and refrain from many false signals. Also when the 2 o'clock will be crossing, we will realize that if the market can breakout now. That is, if the market is down trend, the market may go uptrend and if the market is uptrend, the market may go down trend.
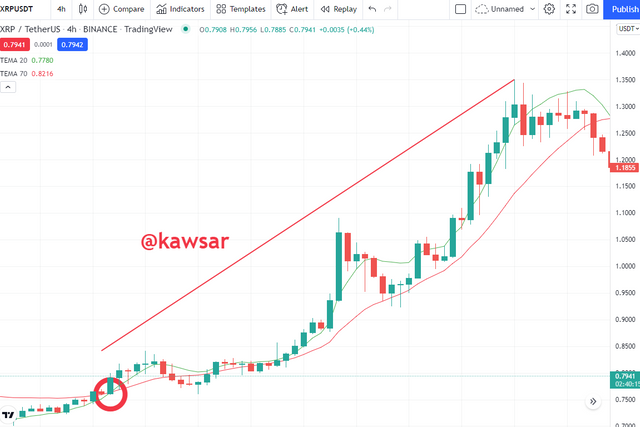
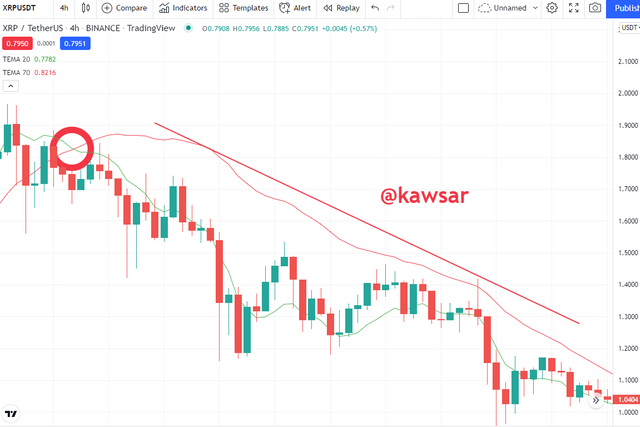
I have added in my trading view chart 20 Triple Exponential Moving Average (TEMA) and 70 Triple Exponential Moving Average (TEMA). If we ever see in the market that 20 Triple Exponential Moving Average (TEMA) has crossed 70 Triple Exponential Moving Average (TEMA) upwards, then this is the signal of bullish market and here we can take buy entry. If we ever see that the 20 Triple Exponential Moving Average (TEMA) has crossed the 70 Triple Exponential Moving Average (TEMA) downwards, then we understand that the market is now occupied by the sellers and we can take sales entry here.
In the screenshot below we can see that 20 Triple Exponential Moving Average (TEMA) has crossed 70 Triple Exponential Moving Average (TEMA) upwards and then bullish movement has started in the market. So if we put a buy order here, we could make a good profit.
In the screenshot below we can see that 20 Triple Exponential Moving Average (TEMA) has crossed 70 Triple Exponential Moving Average (TEMA) downwards and then bearish movement has started in the market.

Earlier we learned about Triple Exponential Moving Average (TEMA) and we also saw how we can identify bullish market and bearish market. This is why we have quickly combined the Triple Exponential Moving Average (TEMA) with another slow Triple Exponential Moving Average (TEMA) to identify and adjust Can use.
Buy Entry and Exit:
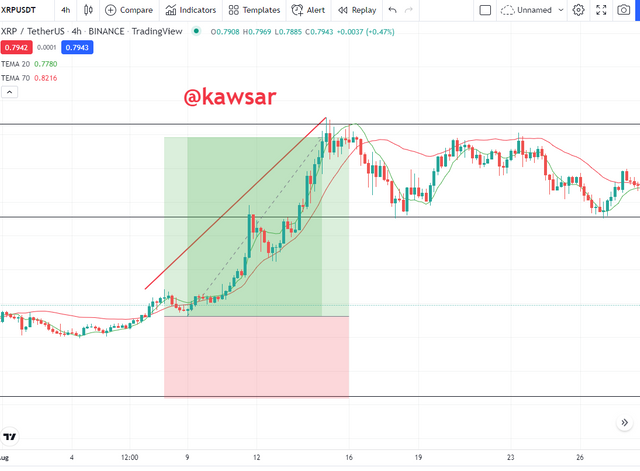
We already know that 20 Triple Exponential Moving Average (TEMA) crosses 70 Triple Exponential Moving Average (TEMA) upwards, then we can place a buy order here. As we can see in the screenshot below, the green line has crossed 20 Triple Exponential Moving Average (TEMA) 70 Triple Exponential Moving Average (TEMA) at the top. So I can take a buy order here and we will set take profit below the next resistance above and we can give stop loss where there is support below. In this case we must set 1: 1 or 1: 2 ratio.
Sell Entry and Exit:
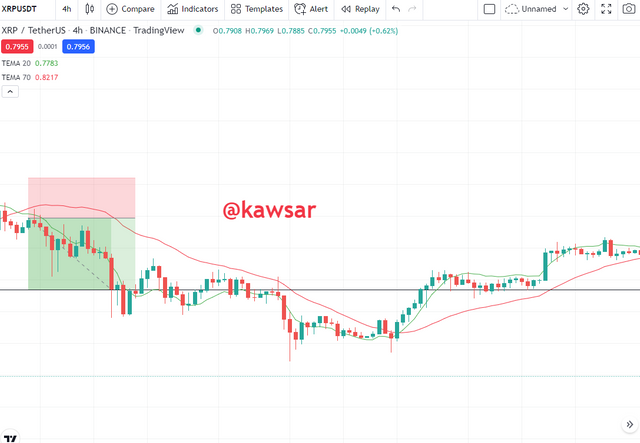
We already know that 20 Triple Exponential Moving Average (TEMA) crosses 70 Triple Exponential Moving Average (TEMA) downwards, then we can place a cell order here. As we can see in the screenshot below, the red line has crossed 20 Triple Exponential Moving Average (TEMA) 70 Triple Exponential Moving Average (TEMA) down here. So I can take a sell order here and we will set a stop loss near resistance at the top and take profit at the support below. In this case we must set 1: 1 or 1: 2 ratio.

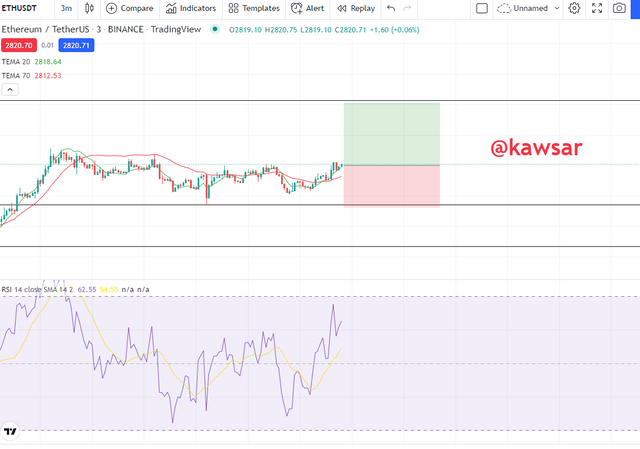
I'm sharing a screenshot below from one of my many favorite platforms Tradingview and in this screenshot I showed that. Here I saw a buy entry. Here I have selected ETH/USDT the pair. Here i can see in my trading view chart 20 Triple Exponential Moving Average (TEMA) crosses 70 Triple Exponential Moving Average (TEMA) in upwards. I have added RSI to Triple Exponential Moving Average (TEMA) so I thought of placing a buy order here and I set the take profit at the level of Resistance and Stop Loss the level of support. This is how I traded a demo. Here I have followed the 1: 1.5 ratio.

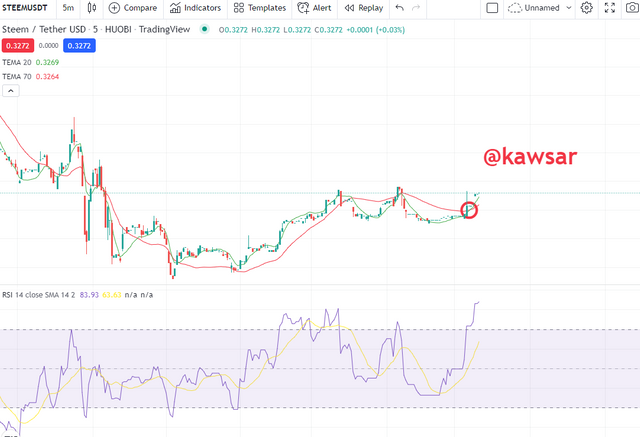
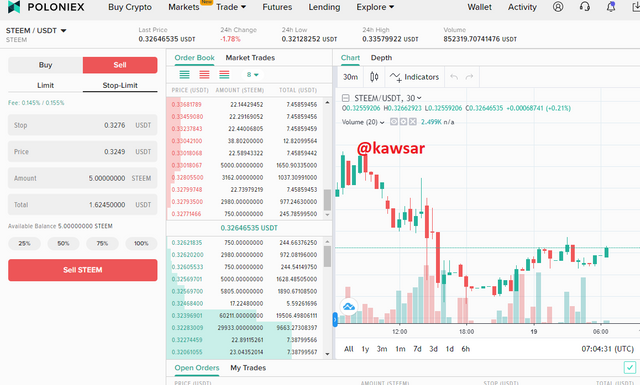
Below I am sharing a screenshot and in this screenshot I have shown that here I have seen a buy entry. Here I have selected STEEM / USDT pair. Here i can see in my trading view chart 20 Triple Exponential Moving Average (TEMA) crosses 70 Triple Exponential Moving Average (TEMA) in upwards. I have added RSI with Triple Exponential Moving Average (TEMA) for my trading in this Strategy . So I thought of placing a buy order here and I set the stop loss at the support below and the resistance level at the level above which I set the take profit. This is how I traded a demo. Here I have followed the 1: 1 ratio. I made this trade from poloniex


Everything has its advantages as well as its limitations. Similarly, Triple Exponential Moving Average (TEMA) has its advantages as well as its disadvantages. So today I will discuss the advantages and disadvantages of Triple Exponential Moving Average (TEMA).
| Advantages | Disadvantages |
|---|---|
| Triple Exponential Moving Average (TEMA) is very easy to understand and use, so all types of users, new and old, can use it. | Triple Exponential Moving Average (TEMA) can sometimes give us false signals. |
| Through Triple Exponential Moving Average (TEMA) we can quickly learn about the current market situation. | Triple Exponential Moving Average (TEMA) works well in the trending market, not suitable for the sideway market. |
| Triple Exponential Moving Average (TEMA) responds very quickly to prices. | Triple Exponential Moving Average (TEMA) should not be used alone, as there is a risk of loss of business if you trade on it completely. |
| With Triple Exponential Moving Average (TEMA) we can easily learn about trends and trend reversals. | Reacting too quickly can lead to false signals in volatile markets. |
| With Triple Exponential Moving Average (TEMA) we can easily understand about buy and sell entries. | |
| Triple Exponential Moving Average (TEMA) can be used for long term and short term business. |

Finally, I would like to say that the strategy that we have learned today is a very effective strategy. However, no indicator is 100% accurate, so I think if we can add other indicators and filter with this technique. Then we can protect ourselves from many mistakes and also protect ourselves from loss and make profit.
I am very grateful to the professor @fredquantum and would like to thank him very much for teaching us a very effective technique [Crypto Trading Strategy with Triple Exponential Moving Average (TEMA) indicator] on such an important subject and for giving us a very well explained lecture.