Today in this post I will share with you my Homework Task (Season 6/Week-3) for Professor @kouba01 . The course professor @kouba01 has discussed with us "Crypto Trading Using Trix Indicator". I have learned a lot about Trix Indicator from this lecture of the professor.

The professor discusses with us today What is Trix Indicator, How to work Trix Indicator, Trix Graph & Calculation, Selling & Buying Areas using Trix Indicator and many more, which are very important for a trader. So i start great importance to this task today and I think it is very important for cryptocurrency trading.

What is Trix Indicator
Trix Indicator is a Momentum Based Indicator. We also know Trix Indicator as Triple Exponential Moving Average, because this Trix Indicator is made up of three Exponential Moving Averages. This Trix Indicator is a combination of three exponential moving averages. This Trix Indicator combines the averages of the three exponential moving averages and presents its price movement issues.
We know that there are several types of moving averages in the market: General Moving Average, Exponential Moving Average, Weighted Moving Average. And the Exponential Moving Average can react very quickly with the price compared to the Simple Moving Average and because of the very fast response it sometimes gives us the wrong signal. If we get that wrong signal and don't make our trading decisions, then we have to face loss for this.
And that's why Trix Indicator combines 3 exponential moving averages. It filters out false signals and unnecessary 'price fluctuations' and presents us with the right signal. By combining the three exponential moving averages, this Trix Indicator can help us solve the limitations of the exponential wing average.
Although the Trix Indicator does not give us an indication of when to enter the market and when to exit or cell entry, exit entry does not give us. But it does help us a lot to understand the market movements and trends and through it we can imagine what might happen in the future. And with that idea we can make our trading decisions. Also, if we filter using Trix Indicator as well as other indicators, we can protect ourselves from our trading losses.
How to work Trix Indicator
With the Trix Indicator we can filter out the problems that we used to face in the Exponential Moving Average and the false signals that we received. Because we know that the Exponential Moving Average reacts very quickly to the market and often gives us false signals, it has been created by combining three Exponential Moving Averages so that we can protect ourselves from those false signals.
The Trix Indicator works much like the Exponential Moving Average, since it is a trend based indicator. However, Exponential Moving Averages combines three moving averages to correct errors. We can find solutions to the problems we get using Exponential Moving Averages using Trix Indicator. This means that the Trix Indicator is designed to protect against the false signal of the Exponential Moving Average.
The Trix Indicator is oscillating below and above the 0 line and this Trix Indicator is sometimes above that 0 line, sometimes below it and it gives us information about the movement in a market. If the Trix Indicator crosses above the bottom of the zero line, it gives a bullish signal and if the line goes down from the top, it gives a bearish signal. This means that we use this Trix Indicator to identify the trend reversal in the market.

In the previous section we discussed what Trix Indicator is and how Trix Indicator works. At this stage we will discuss how to calculate the Trix Indicator, how to configure it and whether it needs to change its settings.
Technical analysis is very important in trading, and we have to use technical indicators for technical analysis. The technical indicators use the data prior to the market price to calculate the opening price, closing price, high price and low price. The previous data of these is presented to us by calculation.
And the indicator we will talk about today is Trix Indicator, Trix Indicator is based on 3 Exponential Moving Averages. And for this we first need to know how to calculate the exponential moving average. The Exponential Moving Average presents it to us considering the closing price of the previous data point. At this stage we will look at the calculation method of Trix Indicator.

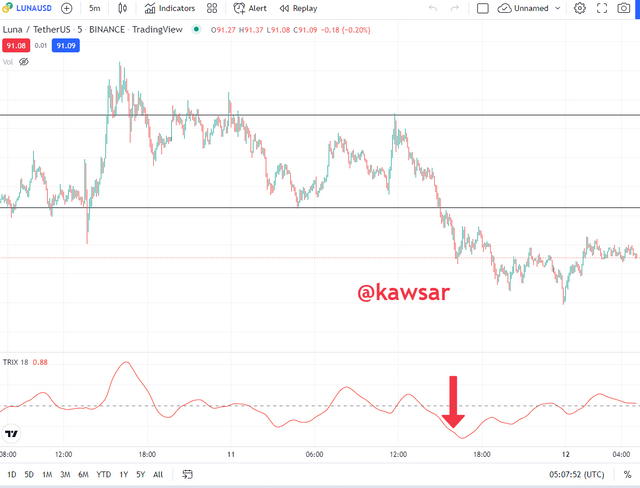
This is how the Trix Indicator is calculated and after the calculation is presented to us graphically in the chart. I have given a screenshot in the chart below
Configure the Trix Indicator
To configure the Trix Indicator we will click on the settings button and after clicking on the settings button we will see some options inputs, Style, visibility. Length of this indicator will be 18 by default. And after clicking on the style, the indicator 0 line will be given in black color and the indicator will be given in red color. We can change the color from here if we want.
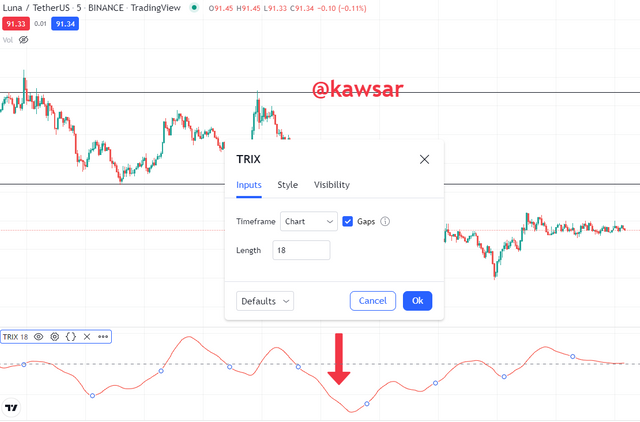
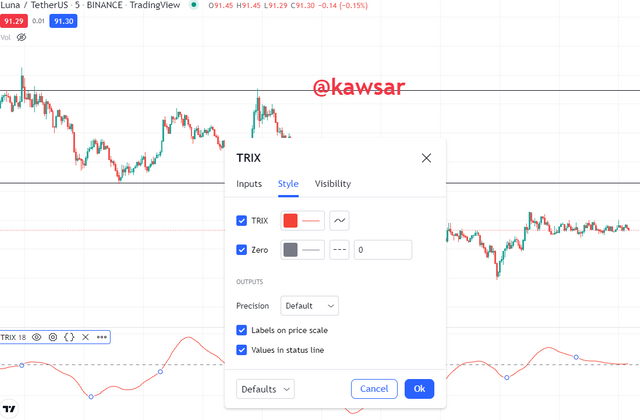
it advisable to change its default setting?
I think it's best to use what is given here by default, and I think this will lead to better results. However, if one uses the intraday trading strategy, it can be reduced. Also everyone has their own strategy, he trades in his own style. Then those who have experience can use it as they wish by reducing or increasing it if they want.
But I think it would be better not to do it and if we reduce or increase it, we can get the wrong signal from here and in that case many wrong decisions may be made for our trading research.

Trend identification is a very important issue for a trader. Because when a trader makes an entry in a trade, he must first identify the trend. And it is very difficult to enter any trade without identifying the trend. With the help of Trix Indicator it is very easy to estimate the market trend and through this a trader can easily estimate the market trend.
If we install the Trix Indicator in our chart then we will see that there is a 0 line and if the Trix Indicator goes from the bottom to the top of the 0 line then we mean that the current market is going to an uptrend. In other words, if the Trix Indicator crosses the 0 line from the bottom to the top, then we understand that the market will now go from bearish to bullish mood. If this happens then the buyers buy the assets, because the market will go from bearish to bullish mood.
If we see that the Trix Indicator crosses the 0 line from top to bottom, it means that we will see a bearish market signal. If this happens in the market then traders get a hint to sell their assets from here, as the market will go from bullish to bearish mood. That means we are getting hints of a trend reversal from here. Below we will look at an example of an uptrend market and a downtrend market on the subject we mentioned above.
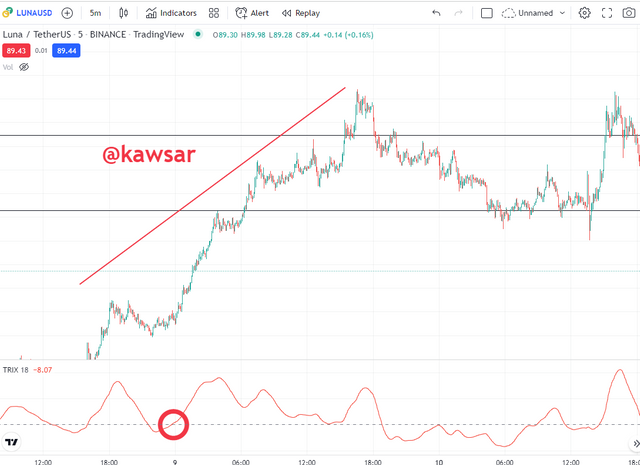
Below I have shared a screenshot. I have taken this screenshot from the TradingView platform and in this screenshot we can see that an uptrend market has been created. If we look at the Trix Indicator below, we will see that the Trix Indicator has crossed the T0 line from bottom to top and then the market has moved upwards. This way we understand when the market will go uptrend and when it will go downtrend.
Below I have shared a screenshot, in this screenshot we can see that a downtrend market has been created. If we look at the Trix Indicator below, the Trix Indicator crosses the T0 line from top to bottom and then the market goes down. In this way we understand when the market will go downtrend.
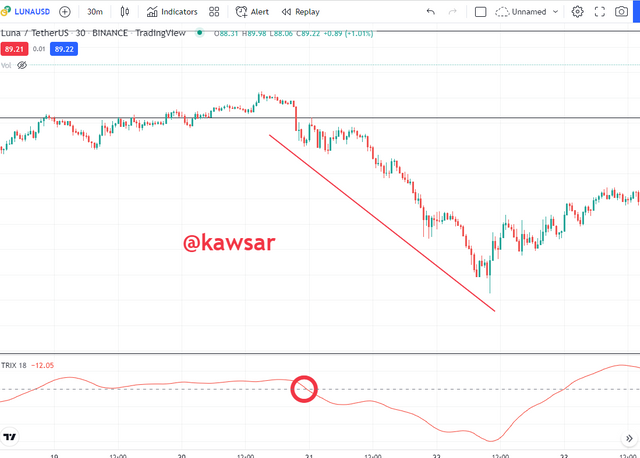
We can know the current price movement through Trix Indicator and at the same time it also filters the market movement and presents it to us and because of this we can remove ourselves from the wrong signals we get from the market. And for that we can survive the loss. So this is a very important indicator for a trader.
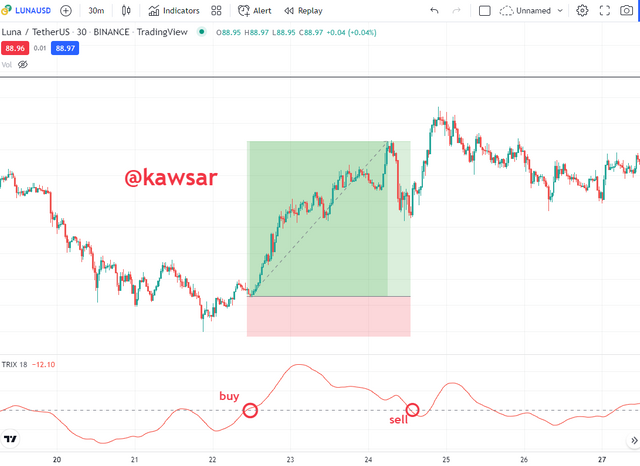
This allows traders to understand the market's trend as well as where to buy and sell. We have already discussed the issue that the trader will buy here when the Trix Indicator rises above the zero line and if the Trix Indicator is seen to go down then it should be sold there.
I have given an example below which we can see that if we would place a buy order here when the indicator was crossing from the bottom and then we would sell when the indicator is down from the top, we could make a much better profit. In this way Trix Indicator helps us to understand the market trends as well as where I need to buy and where to sell. Then in addition to Trix Indicator we will filter using other Indicator, then we will be able to trade more confidently and avoid mistakes.

At this stage I will compare Trix Indicator with MACD Indicator and with Trix Indicator I will add nine period exponential moving averages. We have discussed in the previous episode how to understand trends using Trix Indicator and how to go from bullish to bearish market and how to go from bearish market to bullish market, just by crossing a zero line.
I added Trix Indicator and 9 period exponential moving averages to my chart. If we see that the Trix Indicator has crossed the T9 Period Exponential Movie Average from the bottom to the top, then we understand that a buy signal and when the Trix Indicator will cross the T9 Period Exponential Moving Average from the top down. I mean cell entry.
At this point I have added Trix Indicator and 9 Period Exponential Moving Average and MACD Indicator to my chart. I will compare MACD Indicator with Trix Indicator and 9 Period Exponential Moving Average. Trix Indicator and MACD Indicator will be given as default. This time I will share a screenshot below.
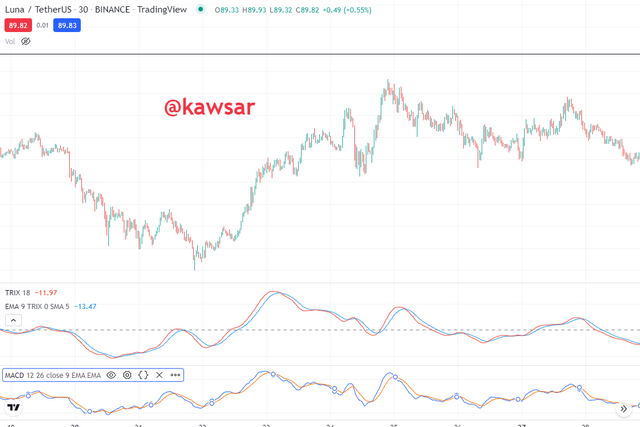
Above I shared a screenshot and I took this screenshot from the TradingView platform on the Luna / USDT pair, in a 30 minute timeframe. Here I have added indicator indicator and Trix indicator and MACD indicator.
If we take a closer look at the chart above, we can see that the Trix Indicator lines are much smoother than the MACD Indicator. The MACD Indicator is giving us signals of unnecessary price fluctuations, due to which its line is showing noise. But since the Trix Indicator has unnecessarily fielded price fluctuations, it is presenting a very smooth line to us.

We know that there is a zero line in the Trix indicator, and through this zero line we can get very strong signals. And the zero line is a very important factor inside this Trix Indicator. Because we already know that if the Trix Indicator goes above the 0 line, then we understand that the market will go up and here we can get the buy signal, it indicates a bullish market. If we ever see that the Trix Indicator goes below the 0 line, then we can understand that the bearish market. Now the market will go down. This way we can easily know the future of the market through the zero line.
Through divergences we can understand the weakness of a trend and the reversal of value. During a bullish divergence we naturally see that prices create lower lows, through which we understand that sellers will move away from the market and then buyers will occupy the market. This time we see that Trix Indicator makes higher low. During a bearish divergence we naturally see that the higher the price, the more we understand that buyers will move out of the market and then sellers will take over the market. This time we see that Trix Indicator makes lower lower.
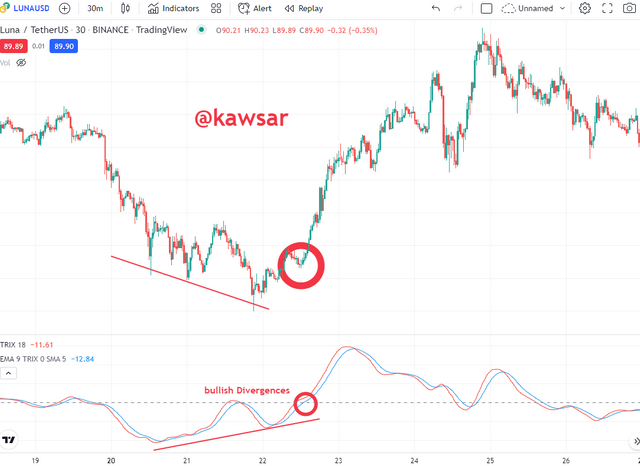
If we look at the chart, we can see that the market is heading for a downtrend but here the Trix Indicator is showing a bullish movement or a bullish divergence, meaning the downtrend is very weak here. After that the market is likely to move to the bullish market and after a while we can see in reality the bullish movement has started in the market and before the bullish movement started it crossed the zero line here we can take a buy trade.

No matter how well an indicator works, we cannot fully trust that indicator. Because no indicator can give us any signal 100% accurately. In that case if we never rely on an indicator and there is no trade entry, then we will be much more likely to lose in many trades. Because many times we see an indicator working well, but sometimes it gives us the wrong signal.
And if we want to avoid that mistake, then of course the first thing we have to do is use another indicator. In that case if we use two or three indicators together and if three indicators give us a positive signal, then we can accept it. Because three indicators can't give us the wrong signal. So even if we do a good job with any indicator, we will add other indicators along with it. Today I will use Trix Indicator and add another Indicator.
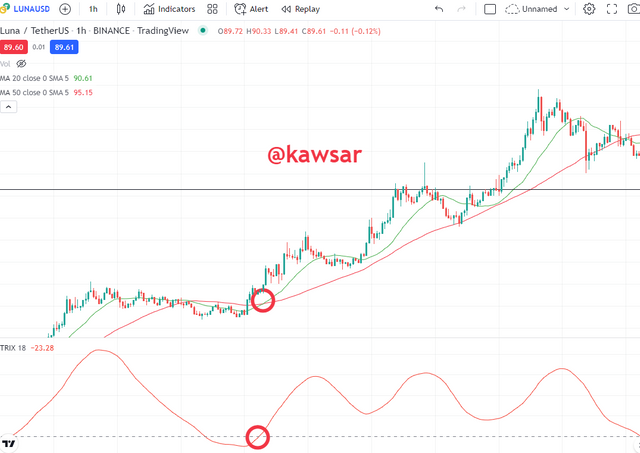
Above I shared a screenshot and I took this screenshot from the trading platform. Here I have added two moving averages to my chart along with the Trix indicator. The green color has a moving average of 20 periods and the red color has a moving average of 50 periods. And we know that if the 20-period moving average crosses the 50-period moving average upwards, we call it the Golden Cross, and if this is the Golden Cross, the market goes uptrend. And we also see in the market that the market has gone up after the golden cross.
In that case we can see in Trix Indicator that this is what happened. The Trix Indicator has crossed the zero line upwards, meaning the Trix Indicator is updating me. The market will now go upwards.

Pros of Trix Indicator
- With the Trix Indicator, we can easily determine the buying and selling position of the market through the 0 line.
- The Trix Indicator can filter out unnecessary market fluctuations.
- The Trix Indicator can filter out false signals compared to other indicators.
- Trends can be easily detected with Trix Indicator.
- Good results are obtained when the Trix Indicator is used in conjunction with other indicators.
Cons of Trix Indicator
- The Trix Indicator is a lagging indicator, many times the trend has started but the Trix Indicator indicates a late start of the trend.
- I have said before that no indicator is 100% accurate. So this indicator cannot be used depending entirely on. You need to use another indicator with this.

Finally, I would like to say that Trix Indicator is a very important indicator for a trader and a very effective tool for doing technical analysis. A very good indicator for making trading decisions, with the help of Trix Indicator a trader can get an idea about the future of a number of market issues. However, no indicator is 100% accurate, so you must use this indicator as well as any other indicator. However, the errors in the Trix Indicator can be corrected and can be profited in trading.
I would like to express my deepest gratitude to the professor for discussing such an important issue with us so openly. He gave us a very well explained lecture today.