Today in this post I will share with you my Homework Task (Season 5/Week-7) for Professor @kouba01. The course that the professor @kouba01 has discussed with us "Crypto Trading With SuperTrend Indicator". I have learned a lot about The SuperTrend Indicator from this lecture of the professor.

Question-01
Show your understanding of the SuperTrend as a trading indicator and how it is calculated?
SuperTrend
SuperTrend is a trend following indicator. In addition, the SuperTrend indicator helps us a lot in identifying asset trends and trend reversals. We can use this indicator on the charts of any of our trading platforms to determine whether the value of the property will rise, fall or stay side by side. Apart from this, the issue of depreciation can also be taken into consideration through this indicator. One of the great advantages of the SuperTrend indicator is that it can be used by experienced traders as well as new traders. Because this indicator is very easy to use and understand.
This indicator is basically above or below the price. When an uptrend market is created, the indicator stays below the price and this indicator then acts as support. This indicator is above the price when there is a downtrend and this indicator acts as a resistance. If a strong movement is created in the market, then it is reversed. In this way it indicates a change in trend. We see two colors in this indicator. One is green, the other is red. Green appears during the uptrend and red during the downtrend
This indicator works best for intraday. So it is very useful for intraday use, traders can easily use it for intraday by filtering out the false signals from here. However, it is also useful to use in the long run, in which case any signal received from here must be filtered along with other indicators and verified whether the signal is false.
How it is calculated?
We must know that SuperTrend indicator has two parameters, one is period and multiplier factor. So we will calculate it based on these two. This time I will show the formula of Super Trend Indicator.
Formula is, Mathmetically
Up = High Price + Low Price / 2 + Multiplier x ATR
Down = High Price + Low Price / 2 - Multiplier x ATR
The Average True Range (ATR) indicator is also used for market trend range.
Question-02
What are the main parameters of the Supertrend indicator and How to configure them and is it advisable to change its default settings? (Screenshot required)
The main parameters of the supertrend indicator are ATR Length and Factor. By default ATR Length 10 and the Factor 3 are given. Any trader can adjust the parameters as he wishes. However, most traders use any indicator that is given by default and it works much better. However, not all traders' strategies work the same way, each one researches individually. So for those who are experienced traders, it can be changed and used as your own.
In the screenshot below we can see that I have added the SuperTend indicator to my chart and I have clicked on the settings button. After clicking on the Settings button of the SuperTend indicator, a new interface has opened with us. Here are two things that ATR Length and Factor above that we said ATR Length 10 and the Factor 3 will be given by default. If we want to keep everything that way, we can press the OK button. And if you want to change, then change the text and click on the OK button, it will change.
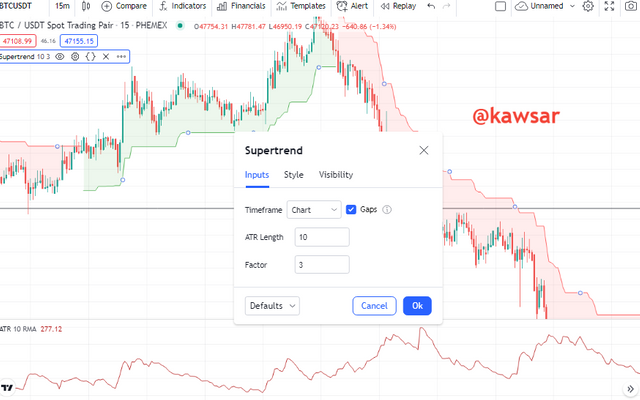
ATR Length 10 and the Factor 3:
I have taken the screenshot below in the same way that the settings are given by default. I haven't made any changes here. By configuring these settings we can get some signals and from here we can trade successfully. Which I have shown in the screenshot below.
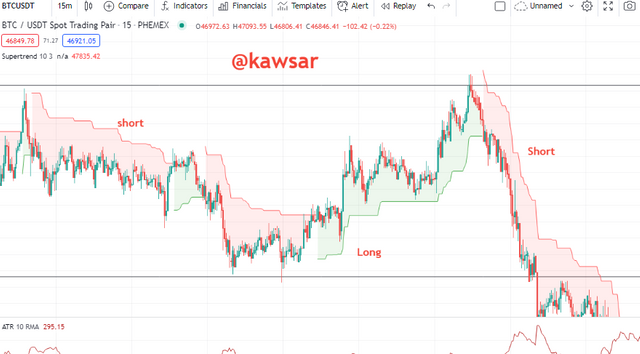
ATR Length 10 and the Factor 4:
This time I changed the default settings a bit and replaced Factor 3 with 4. By making changes we can notice some changes in our chart and using these parameters we get some signals. Which I have shown in the skinshot and I can use it successfully.
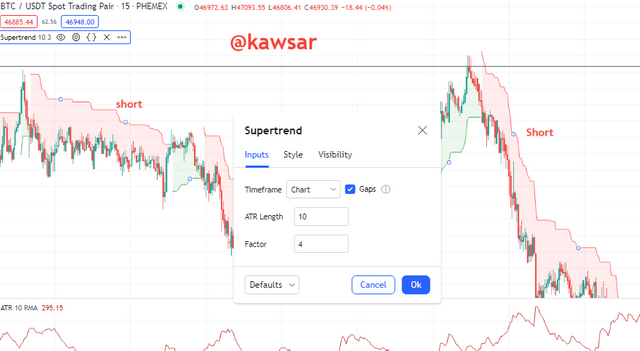
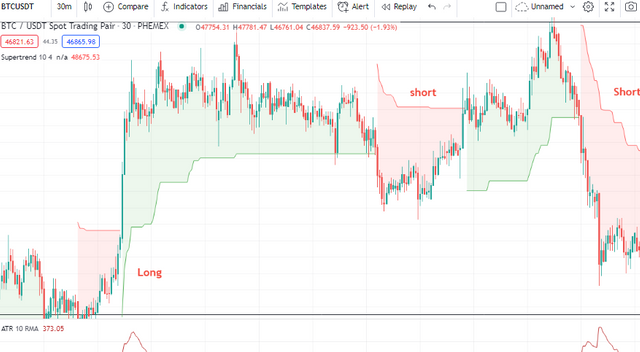
How do we change the default settings? In that regard, I would like to say that the trader who feels comfortable to trade or analyze such parameters should use those parameters. When we make a change, it gives us different results. However, I think that when using any indicator, newcomers must use it by default. However, with some changes we can do different analyzes. We will take it from the parameter on which we find something good and at the same time we must use other indicators to check if it gives a false signal.
Question-03
Based on the use of the SuperTend indicator, how can one predict whether the trend will be bullish or bearish ?
We already know that the SuperTend indicator indicator will be very good as it helps us a lot to identify the market trends. Whether the market is in a bullish market now or in a bearish market, this indicator allows us to understand it perfectly. There are two colors by which we can understand how the market is now or in what position.
Bullish Trend:
We can easily understand that it is uptrend in the market now through SuperTend indicator. As I said before, any new entrepreneur can understand this. In the bull market, the color of the SuperTend indicator is green and its position is below the price. When we see this after installing SuperTend indicator in our chart, then we will understand that the market is now in uptrend movement. Then normally we will try to buy order, after understanding the market movement.
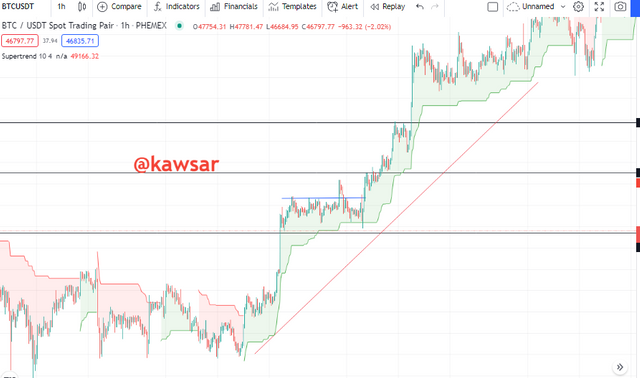
As we can see in the screenshot above, the market is on an uptrend now. The SuperTend indicator is located below the price chart, it acts as a support and through this I understand that the market is now on an uptrend.
Bearish Trend:
With the SuperTend indicator we can easily understand that the market is now on a downtrend. In the bearish market, the color of the SuperTend indicator is red and its position is above the price chart. When we see this in our chart, we realize that the market is on a downtrend now. Then normally we will try to order the sell.
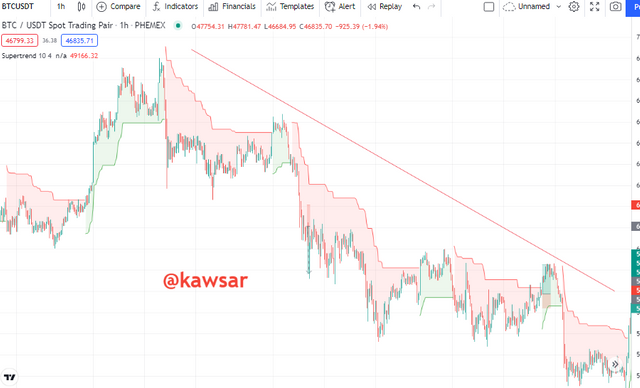
As we can see in the screenshot above, the market is now on a downtrend. The SuperTend indicator is located above the price chart, it acts as a resistance and through this I understand that the market is now on a downtrend.
Question-04
Explain how the Supertrend indicator is also used to understand sell / buy signals, by analyzing its different movements.(screenshot required)
With the help of Supertrend indicator we can find the buying and selling signals. It is very easy to understand where to buy and sell using Supertrend indicator. Because one of the great things about Super Trend Indicator is that it provides details through trend colors. For example, if we look at the green color, then we understand that it is a bullish market or the market is uptrend now. If I look at the red color then I understand that it is bearish or the market is on the downtrend now. We get the buy signal through the green color and we get the sell signal through the red color. We can easily get buy-sell signals in this way, which is very easy to load for a new trader. With the help of Supertrend indicator we can understand where to buy and sell. With this Supertrend indicator we can get a buy-sell when a new trend starts, it turns upside down.
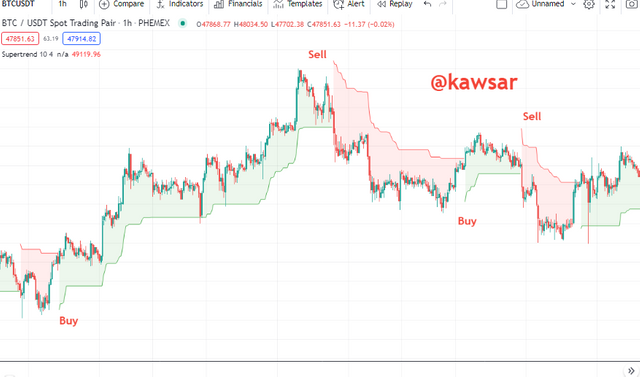
From this screenshot above we can see that when a trend changes, the color changes here. For example, when it is made from bearish market to bullish market, it turns from red to green. And when it goes from bullish market to bearish market, it changes from green to red. So when the market turns from red to green, it will give us a buy signal. Then we get the buy signal from here and when it goes from green to red, we get the sell signal. This way we can easily get buy and sell signal through Super Trend indicator.
Question-05
How can we determine breakout points using Supertrend and Donchian Channel indicators? Explain this based on a clear examples. (Screenshot required))
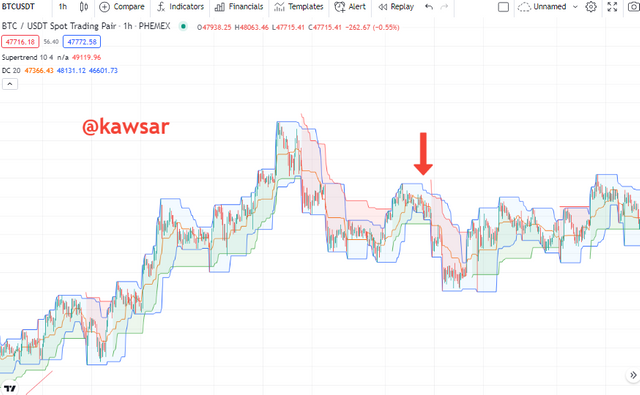
At this stage I will try to find out the breakout points using Supertrend indicator as well as Donchian Channel indicators. For this I will first install the breakout points in my chart, first I will click on the indicators button from the chart to install, after clicking on the indicators button a search bar will appear here after typing "donc" the first Donchian Channel indicators will appear. Clicking on Donchian Channel indicators will add Donchian Channel indicators to our chart.
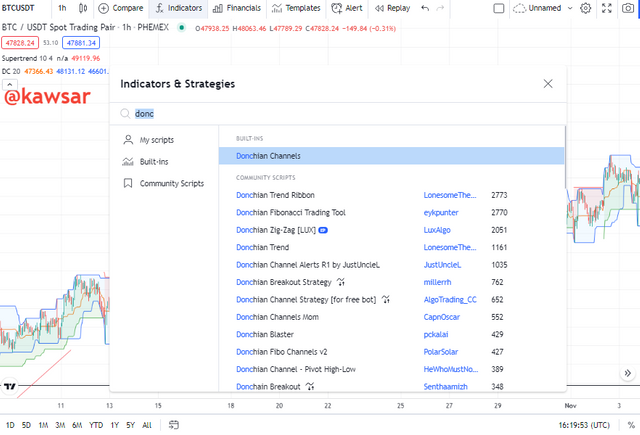
Donchian Channel indicators have been added to our charts. We can see that in the screenshot below.
Bullish Breakout
If we want to get a buy signal, we must find the breakout points. And we will find the buy signal by filtering with Super Trend Index as well as Donchian Channel indicators. For this there must be a break in the top line of Donchian Channel indicators. But before entering, we must remember that this break must be two drawn candles. However, we can take a buy entry here. This is how we can understand a buy entry with the help of these Donchian Channel indicators.
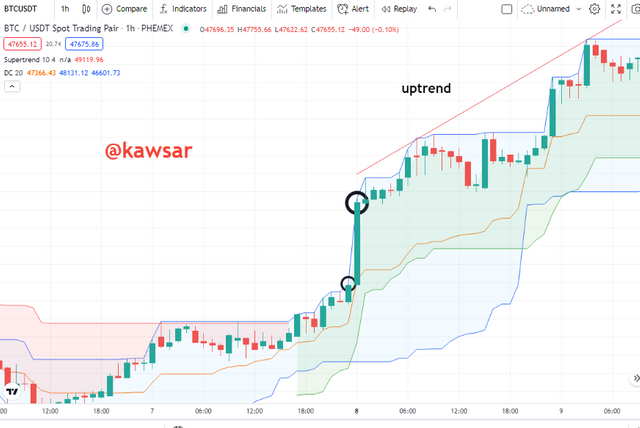
In the screenshot above we can see that there is a bullish market. There has been a breakout. We received the signal through the Donchian Channel indicators before the breakout. Because I have marked the black circle in the screenshot above, the two candles have broken up at the top of the Donchian Channel indicators.
Bearish Breakout
If we want to get a sell signal, we need to find a breakout point. And we will search for sales signals by filtering with Super Trend indicators as well as Donchian Channel indicators. There must be a break in the line below the Donchian Channel indicators. But before entering, we must remember that this break must be two drawn candles. But we can take a sell entry here. This is how we can understand a sell entry with the help of these Donchian Channel indicators. Below we will see an example.
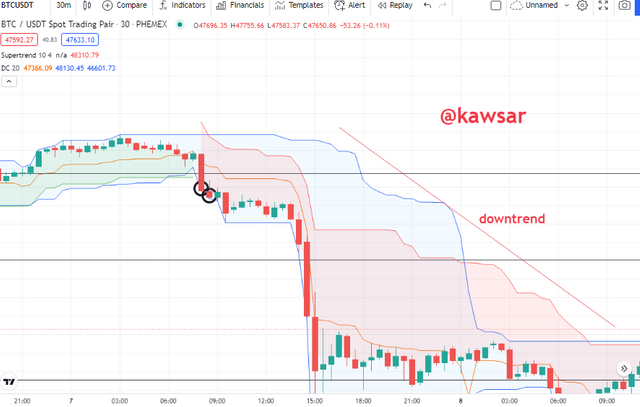
As we can see in the screenshot above, there is a bearish market. There has been a breakout. We received the signal through the Donchian Channel indicators before the breakout. Because I marked the black circle in the screenshot above, the two candles break down at the Donchian Channel indicators.
Question-06
Do you see the effectiveness of combining two SuperTrend indicators (fast and slow) in crypto trading? Explain this based on a clear example.
This time we will use combining 2 SuperTrend indicators. One since we have already installed, which will be given by default. We will install and set another one, the parameter I have given in this case is (ATR Length 21 and the Factor 2).
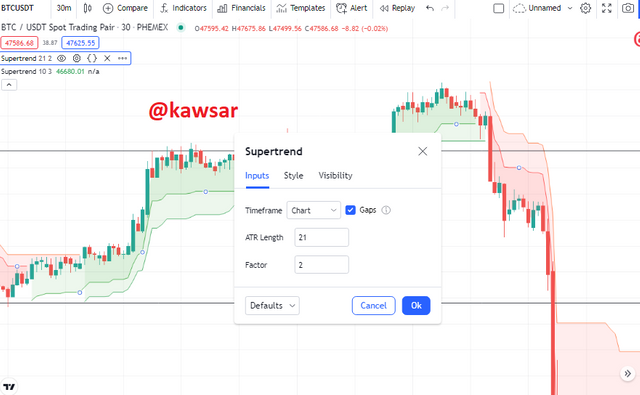
At this stage we will use a strategy of SuperTrend indicators. Here we will use two SuperTrend indicators. Given by default, (ATR Length 10 and the Factor 3) this is the slow parameter and we will use another parameter, which we set in the settings that I have already shown, this is the fast parameter. I will show below how we can get buy and sell signal from here.
If we use this SuperTrend indicator twice, it can give us a lot of accurate signals. We can filter any false signal through it. In that case, if we ever get a false signal from SuperTrend indicators, we will understand that and I will be able to exempt myself from all those trades. So we can use SuperTrend indicators twice (fast and slow). It is quite effective.
Buy Signals:
We have installed two super indicators in our chart to get the buy signal. One is slow, the other is fast. When these two speeds and slows move to the green line, we will understand that the market is bullish now and since 2 indicators are giving a signal to buy. So we can assume a strong position here, below I will show an example.
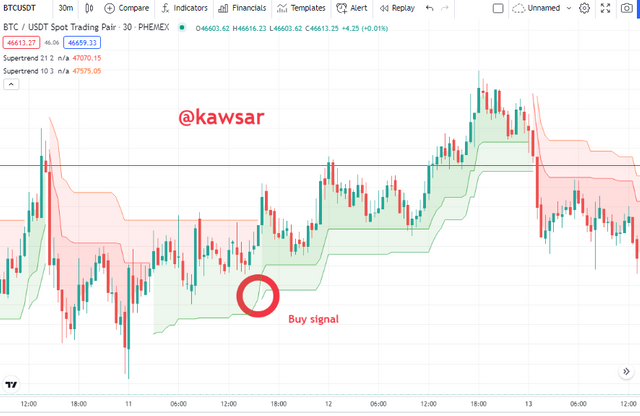
As we can see in the screenshot above, I marked it with a red circle. Both the indicators have taken the green color in the specified place. So we can take a buy entry here and then see the market go up.
Sell Signals:
We have installed two super indicators in our chart to get the sell signal. One is slow, the other is fast. When both the fast and the slow turn red, we realize that the market is bearish now. When the fast line goes below the slow line, we can make a sell entry from here or exit the market. Below I will show an example.
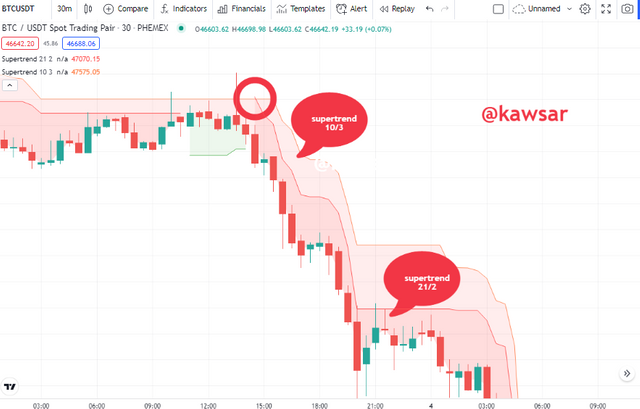
As we can see in the screenshot above, I marked it with a red circle. Both indicators are red color now and the fast line is below the slow line. So we can take a sell entry here.
Question-07
Is there a need to pair another indicator to make this indicator work better as a filter and help get rid of false signals? Use a graphic to support your answer. (screenshot required)
One thing we must know is that no indicator can give a 100% sure signal. Sometimes any of the indicators can give us false signals. In that case if we want to trade successfully or keep ourselves away from wrong signals. Then of course we will use any indicator as well as other indicators. When we get a confirmation pub entry from two such indicators, we will take the entry there. So I must think that in addition to using the Supertrend indicator if we want to get better results from here and to refrain from the wrong signal. Then we should use other indicators besides Supertrend indicator.
For this I will use another indicator besides Supertrend indicator. One of my favorite indicators is RSI. Today I will install RSI indicator in my chart for filtering along with support trend indicator. Therefore, after clicking on the indicator button from the chart, the search bar will open. If you search by typing "RSI" there, the first click on the indicator will show that the RSI indicator will be installed in our chart.
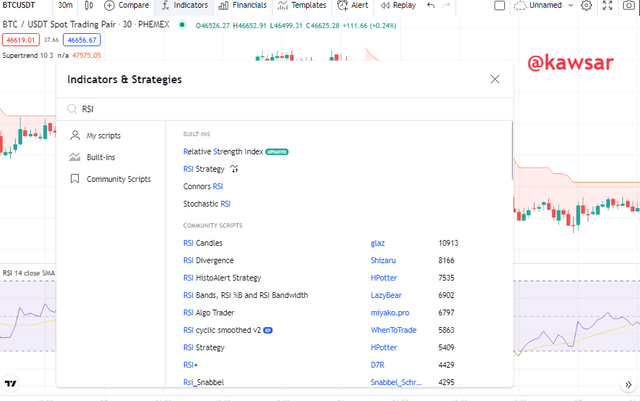
The RSI indicator has been added to my chart, which I can see in the screenshot below.
Example
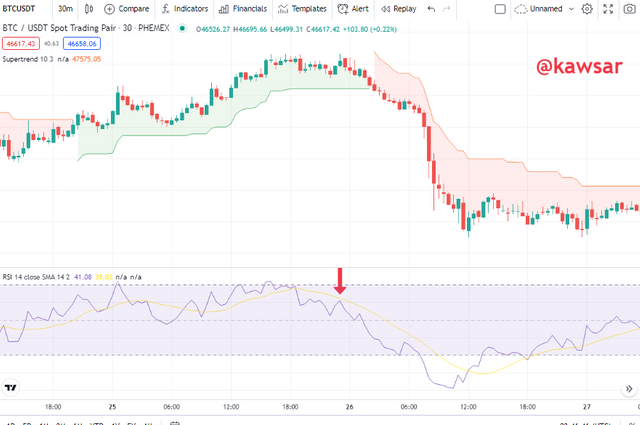
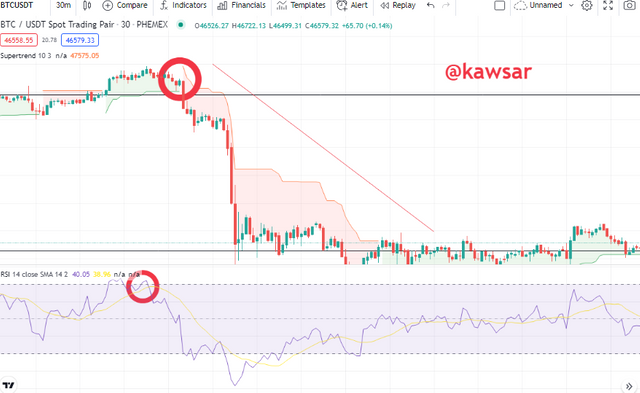
In addition to the Supertrend indicator in our trading view chart, I have taken the RSI indicator. We will try to find any signal through these two indicators and we will take the help of RSI indicator to confirm the signal that Supertrend indicator is giving us. We will also see if the Supertrend indicator is giving us a signal, the RSI indicator is giving us the opposite signal or is giving a signal for it.
We can see in the RSI indicator of our chart that there is a signal here, which we have circled with a red mark in the screenshot below. So we got a sell signal here through more RSI indicators.
We can see in the screenshot that we have received a sell signal through the Supertrend indicator, the indicator has changed from green to red. And we must know that when the indicator comes in red, it means that we understand that it is a sell signal. Then we can take a cell entry here. This means that we understand that the Supertrend indicator is giving a signal here and the RSI indicator is giving us a sell signal. So we are getting a sell signal from here through 2 indicators. We can thus consider our trading Supertrend indicator as well as any other indicator signal.
Question-08
List the advantages and disadvantages of the Supertrend indicator:
From each indicator we can get some signal through which we can benefit. However, no indicator can guarantee that it will give us 100% correct signal. So these indicators can sometimes give us the wrong signal. We have to refrain from all those signs. At this stage I will talk about the advantages and disadvantages of the indicator.
Advantages of the Supertrend indicator
- This is an indicator that can be used by both new and old traders, as it is very easy to understand.
- With Supertrend indicator we can easily understand the trend reversal. It helps us to understand that it changes from red to green when it is uptrend and from green to red when it is downtrend.
- We can easily understand when to take Sell entry and when to take Buy entry from here.
- Another advantage of the supertrend indicator is that it acts as a dynamic support and resistance.
- Good results can be obtained by using the Supertrend indicator with other indicators.
Disadvantages of the Supertrend indicator
- Supertrend indicator sometimes gives false signal in the trending market.
- Supertrend indicator will not work well in all cases or for all Position.
- The signal we receive through the Supertrend indicator cannot be used alone, it should be used with other indicators.
- While this may work well for the trending market, it will not be suitable for the sideway market.
Question-09
Conclusion:
Finally I can say that SuperTrend indicator is a trend following indicator, it helps a trader a lot for the trend market of the market. The great thing is that it can be used by everyone, new and old. Because it is very easy to understand and use. But of course the signals we get using the SuperTrend indicator, if we want to be successful in trading. But we should use it as well as we will check with other indicators. We can take entry here if it seems acceptable to us.
The professor has discussed the SuperTrend indicator with us very nicely. I am so grateful to the professor for giving us a well-explained lecture on such a beautiful topic.