
Hello mates. Another week of great lessons from the Crypto Academy. Thanks to @remminscence01 for this lecture. This is my submission for the homework task from the lecture.
Candlesticks in charts are more or less like indicators traders use to predict and determine the price movement of an asset. With distinct characteristics and features, the various kinds of candlesticks have their own interpretation for price movement in the chart.
In your own words, explain the psychology behind the formation of the following candlestick patterns.
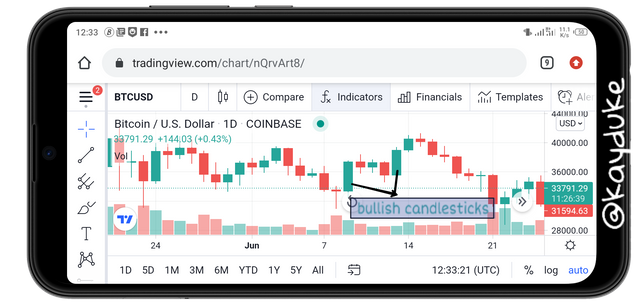
A bullish candlestick is associated with an uptrend. An uptrend in the market means there are more buyers than sellers in the market pushing the price of the asset up. A bullish engulfing candlestick pattern is normally followed after a bearish candle indicating more buyers than suppliers in the market and is characterized by a long green real body. A bullish engulfing candlestick pattern is a strong reversal candlestick pattern when it is appearing at the bottom of a downtrend pattern whereas a bullish engulfing candlestick pattern appears in an already existing uptrend, then it is an indication of continuous uptrend.
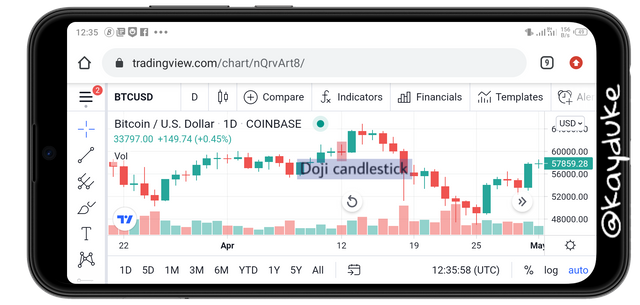
A doji candlestick pattern is a rare incidence in the market where the open and close price of the asset is equal. It's characterized by no real body but long shadows. A Doji candlestick indicates a reversal in the market. When a Doji candlestick is seen in an uptrend, it means buyers equal suppliers and a downtrend is likely to occur, the opposite happens when it appears at the bottom of a downtrend. There are 3 kinds of Doji candlestick pattern:Doji candlestick, Dragonfly Doji candlestick and Gravestone Doji candlestick.
Just like the shape of a hammer, the hammer candlestick looks as such or the letter 'T'.
The morning and evening Star candlestick pattern.
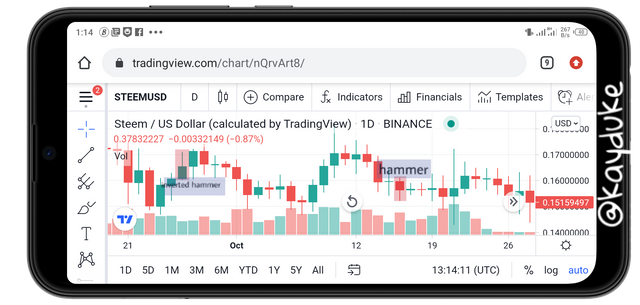
The hammer candlestick is identified as a strong reversal candlestick and depending on where it appears, the market trend reverses. There will be an uptrend reversal when the hammer candlestick appears at resistance and a downtrend reversal when it appears at support.
The hammer candlestick is characterized by a small real body and a long shadow about twice the size of the body. There are 2 kinds of hammer candlestick.
- Hammer: Usually seen at the bottom of a downtrend or support area indicating the possible start of an uptrend.
- Inverted hammer: Seen at the top of an uptrend or resistance area indicating the possible start of a downtrend.
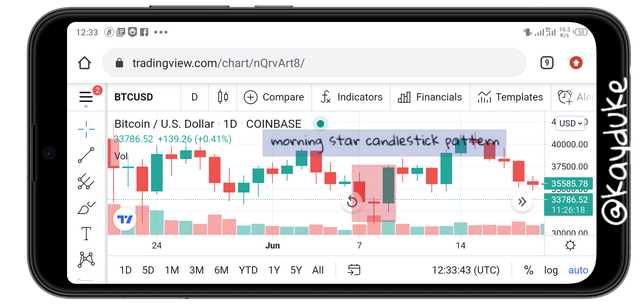
The morning star candlestick pattern is a pattern of 3 candlesticks usually associated with an uptrend. These 3 candles show how the market exit a downtrend and enters an uptrend. The first candlestick is a strong bearish candle where the price of the asset is low usually because sellers are selling off the asset or excess supply of the asset.
The second candlestick is a weak bearish candlestick and this is where buyers almost equal sellers in the market indicating a possible uptrend.
The last candlestick is a strong bullish candlestick confirming the start of an uptrend. This is where more buyers are buying the asset pushing the price up.
This is the direct opposite of the Morning star candlestick pattern. A pattern of 3 candlesticks associated with a downtrend. These 3 candles show the market enters a bearish trend or downtrend after an uptrend.
The first candlestick is a strong bullish candlestick. This is where the price of the asset is up because there are more buyers of the asset in the market. The second candlestick is a weak bearish candlestick and this is where buyers almost equal sellers in the market indicating a possible downtrend. The third candlestick is a strong bearish candle where the price of the asset begins to fall usually because sellers are selling off the asset or excess supply of the asset in the market and is an indication of the start of a downtrend.
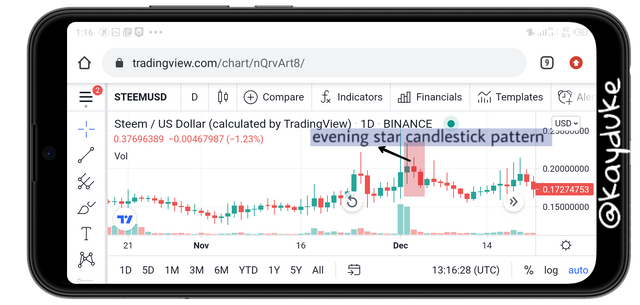
Identify these candlestick patterns listed in question one on any cryptocurrency pair chart and explain how price reacted after the formation.
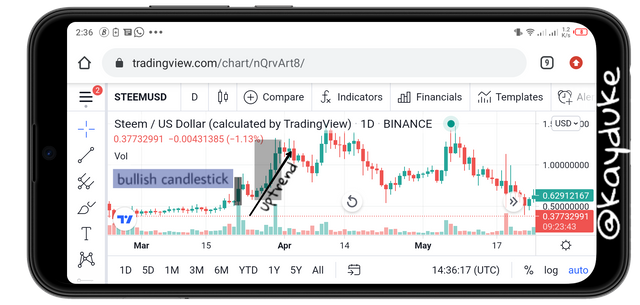
A bullish candlestick as already discussed, is associated with an uptrend in the chart. From the chart, we see the price of the asset increase steadily and we see more bullish candlesticks after each day causing the uptrend pattern. This indicates that the asset is being bought more hence pushing the price up.
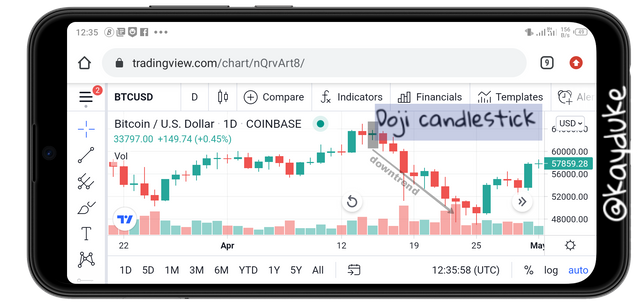
The Doji candlestick appears when the open and close price are equal. In the chart, the Doji candlestick appeared around the resistance area and you see the end of an uptrend and the start of a downtrend right after.
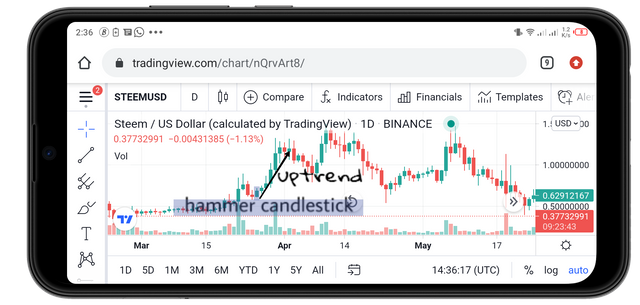
The hammer candlestick is identified as a strong reversal candlestick and depending on where it appears, the market trend reverses. In this chart, you see a continuous rise of the price of the asset after the hammer candlestick appeared. This validates the assertion that the hammer candlestick is a strong reversal candlestick.
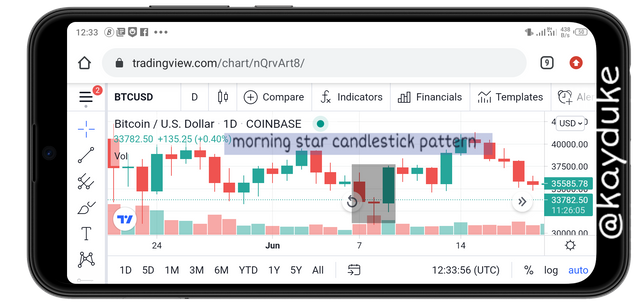
The morning star candlestick pattern is a pattern of 3 candlesticks associated with an uptrend. In this chart, you see the asset's price rise after the morning star pattern formed reverse the downtrend the asset was experiencing.
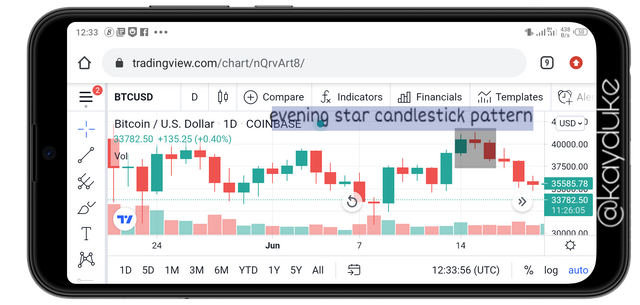
A pattern of 3 candlesticks associated with a downtrend. In this chart, we see the asset enter a downtrend after the evening star formed.
Using a demo account, open a trade using any of the Candlestick patterns on any cryptocurrency pair. You can use a lower timeframe for this exercise.
To do this, I logged in on Trading View and traded BTC/USD on Paper view. This is the chart as at the time of trade.
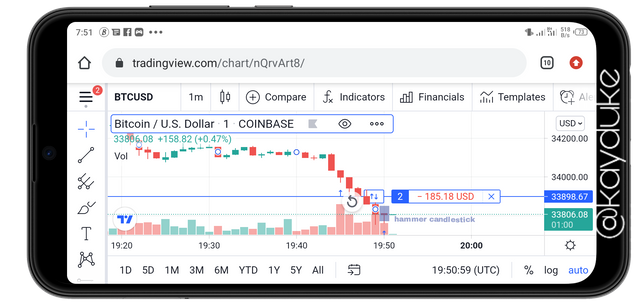
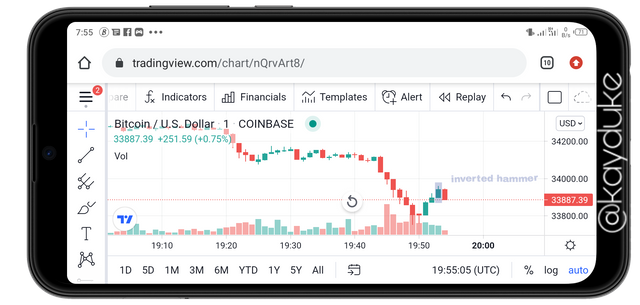
Having identify a hammer candlestick around the support area, I quickly bought the asset in anticipation of an uptrend and Yes it worked. The asset's price rose a little over the price I bought it and I sold it off after an inverted hammer formed which usually indicates the end of an uptrend and the start of a downtrend. See below:
Conclusion
Candlesticks are very important tools that need to be considered. Like indicators, their special characteristics can help traders predict price movement and make informed trading decisions.
Thanks @reminiscence01 for this one. Can't wait for the next.
Hello @, I’m glad you participated in the 4th Week of the Beginner’s class at the Steemit Crypto Academy. Your grades in this task are as follows:
Recommendation / Feedback:
Thank you for submitting your homework task.
Downvoting a post can decrease pending rewards and make it less visible. Common reasons:
Submit