In this world ,where Cryptocurrencies have their prices changing and trending there we deduce terminologies responsible for this changes .
I am @kelechisamuel and this is my homework post for @lenonmc21
QUESTION 1: Define in your own words what is a "Trend" and trend lines and what is their role in charts?
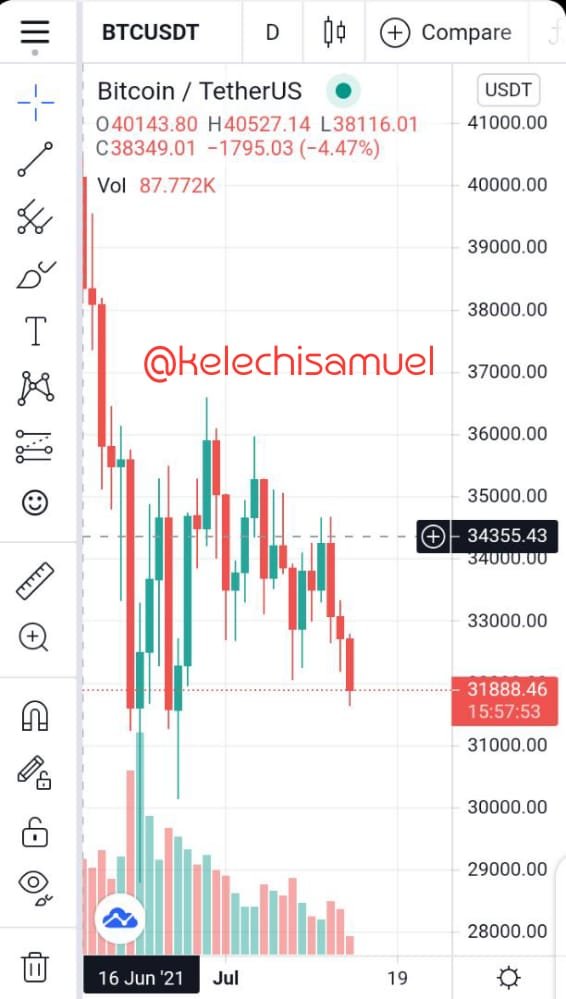
Firstly we would be considering what a trend is ..
*A Trend ; A trend , normally could be seen as a general direction or way towards something is changing or developing . In the Cryptocurrency world ,we see trends as a pattern formed when the price of an asset begins to go to a particular direction .
In other words they could be seen as ascertained chances of the Cryptocurrency markets to move in a particular direction over a period of time .We could also hold in facts that trends are based on pre-performances of the markets and every other movements are assumed .We could also see that everytrend of the market has a benefit either from selling or buying traders
- Trend lines : Secondly ,we have the consideration of trend lines as lines properly connecting the bullish maximum points and bearish minimum points .They are seen as lines used to be check how strong a market trend is ,over and over again
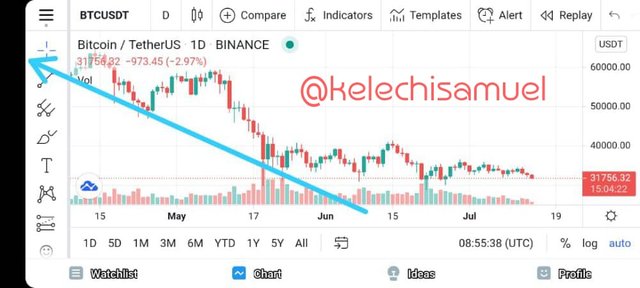
Better put ,we could say that in a bullish trend ,the price trendline is gotten by the line drawn on all the minimums positions
And in a bearish trend ,the price trendline is gotten by the line drawn by the maximum positions.
- Next ,we would be considering the work of trendlines as we see them to be used for the preparation of technical analysis.
That is ,the trend lines ,help in the placement of the charts and in other words help to study the movements of the market.
They also aid in giving traders a good calculation of what their trade movements should be like during the varying value of an investment .
QUESTION 2:Explain how to draw an uptrend line and a downtrend line (Show a screenshot of each).
We would be looking at how to draw an uptrend and downtrend line in this part and
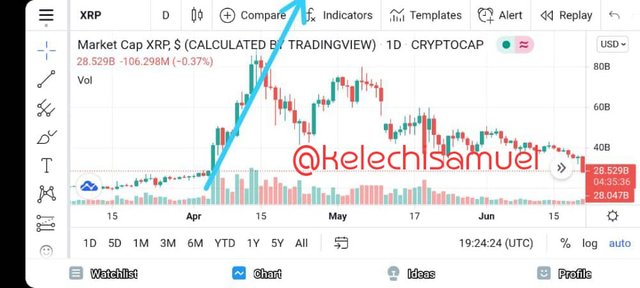
- Firstly the Uptrend lines ; We see this lines as ones that show the bullish trend of the market .
More so ,,we can draw the Uptrend lines by , joining the minimum points of the market together ie the places prices have been drastically low ,in the market together to form a line like we see below of the XRP movement with the Uptrend lines over a particular period
*Secondly ,the downtrend lines could be seen as lines that depict the bearish trend of the market .
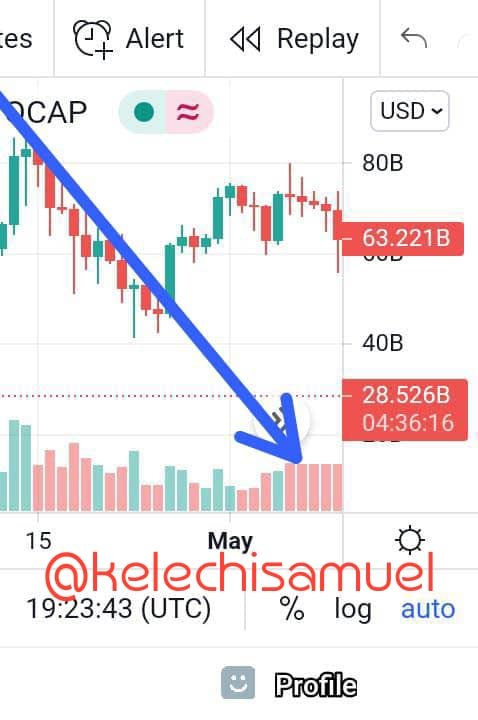
We could also draw the downtrend lines by connecting the maximum points of the market together and showing the significant slope down wards like in the XRP chart too below where we see the down trend lines .
QUESTION 3:Define in your own words what "Supports and Resistances are and how we can identify both zones (Show a screenshot of each one).
One of the major factors of the market moves are support and resistance and I'll defining them differently ;
- Support ;
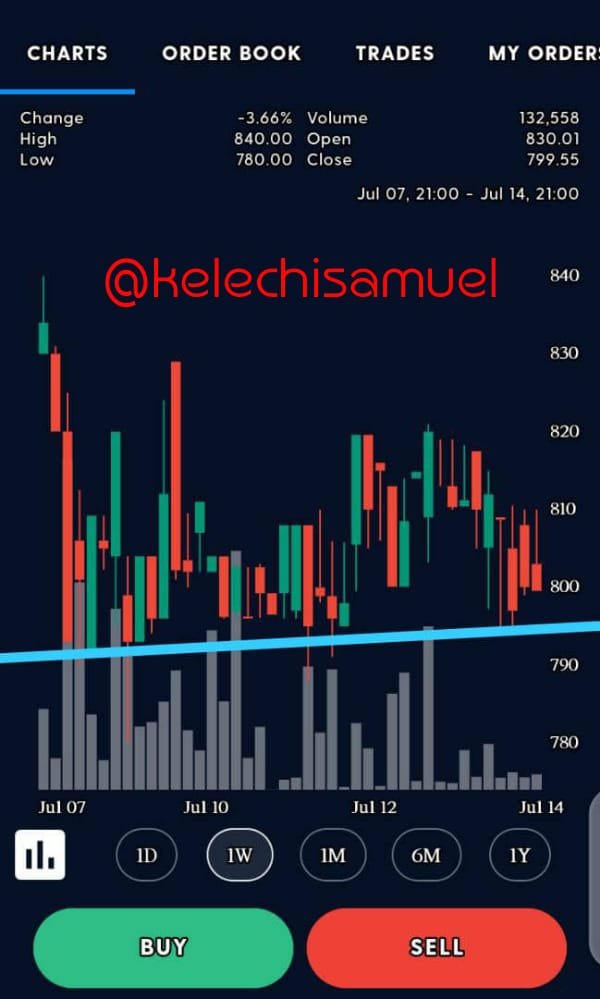
Support could be seen as a place where the downtrend lines ,like we've discussed in the above passages ,are expected to stop moving downwards from due to maybe ,an increased demand and buying interests due to the fact that traders tend to buy more during the bearish times .Like the name implies refers to a place where a thing has solace in .And bringing it down to the market ,we see support as a place in the market where prices tend to
bounce back after once they hit there like we see in the Crypto asset chart below where the support price lies at 800-795 naira
- Resistance
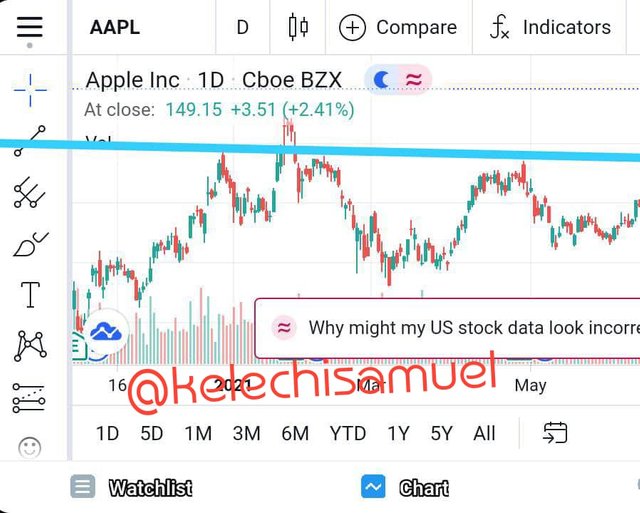
resistance on the other hand could be seen as a level where trendlines get bullish due to selling interest when prices are high .
We could deduce from this that Resistance could be seen as point where prices do not get above in a trendline chart .Like the name implies it resists prices from getting above it making every price that gets to that level fall .
Understandably too ,uptrend lines,bring up the resistance levels .Finally ,I could bring it up that the longer these levels hold up with their resistance,the more vulnerable they could be to break out in a moving trend
QUESTION 4:Explain in your own words at least 2 simple chart patterns with screenshots.
Here we will be considering two types of simple chart patterns including ;
- The double roof /top pattern ;
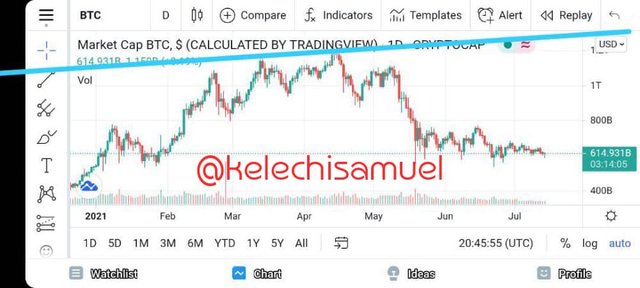
The double roof or top pattern chart could be seen as a very /utmost high technical return pattern that is made when the crypto assets makes a bullish price two steady times with a little reduction between the two highs .
We could also ascertain that the assets price becomes under a support pattern same to the low between the two previous highs.
They are also known to be able to identify trend changes in a chart and also the end of a main uptrend. The BTC chart below shows an example of a double roof /top pattern as it follows exactly its features in the chart
- The second chart we're going to be considering, is the Double floor pattern
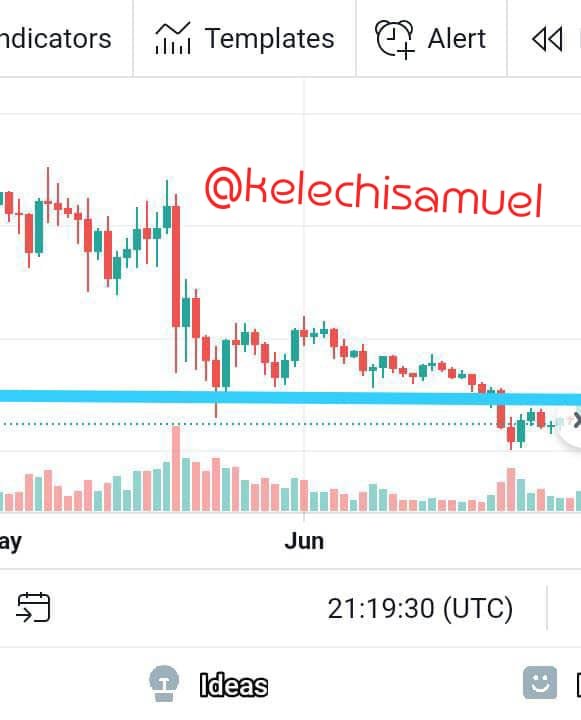
which could be explained as a a very low technical return that is made when price of crypto currencies make two bearish trends with a little reduction between the lows.
It explains a reduction in value of an asset and its re occurrence to drop to a similar way like the previous drop.
This graph is connoted by its way of forming the W letter in its trends. The double bottom chat pattern moreso could be seen as one of the perfect ways to measure the coming up and long period sight of the market. The graph we see below creates the double bottom impression and is seen as an example of the double bottom graph
Thanks for reading my homework post
Cc
@lenonmc21