It was a very great lecture by @kouba01 and to be candid I learnt a lot without wasting much time, I will dive into the homework post
1. What is the Relative Strength Index - RSI and How is it Calculated?
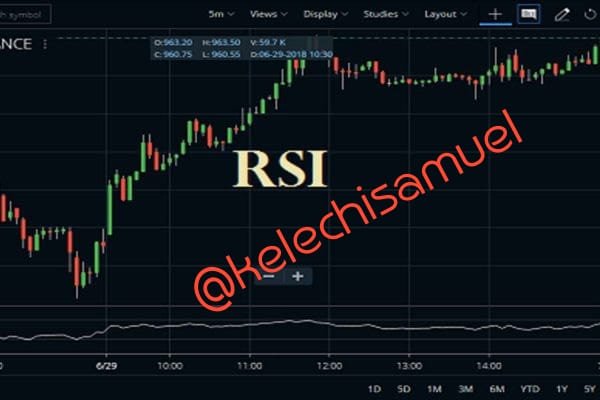
1a. Definition of RSI
A relative strength index is an indicator used to guage the price changes, and also check the activities of the overbought and oversold in the stock of an asset
It gives signal about bullish and bearish changes, an asset or stock can be seen as overbought if it is above 70% and vise versa oversold if below 30%
1b. How it is calculated
The RSI calculation is a little bit complex but I will do my best to narrow it down
The formular given and known for the RSI is written below
RSI = 100–(100 /1+RS)
Where RS = Relative Strength = AvgU / AvgD
AvgU = average of all up moves in the last N price bars
AvgD = average of all down moves in the last N price bars
Where U and D stands for ups and downs and N stands for periods
Having defined all the parameters, it will please you to know that the most common period for RSI is 14 and closing prices on 15
So to sum all parameters into the system we have
RSI = 100 - ( 100 / (Average gains in first 14days)* (14-1)) + current gain)/14)/ ( Average loss in first 14days) * ( 14-1)) + current loss)/ 14))
Using this expanded formula, your RSI can be calculated efficiently and accurately

2. Can we trust the RSI on cryptocurrency trading and why?
I can say yes that the RSI can be trusted on the crypto currency trading because as compared to the other indicators, RSI gives a more reliable reading when spread over a long period of time although one can not fully leave the work of the prediction as it's just an indication and may not be 100% accurate

3. How do you configure the RSI indicator on the chart and what does the length parameter mean? Why is it equal to 14 by default? Can we change it? (Screen capture required)
3aHow do you configure the RSI indicator on the chart
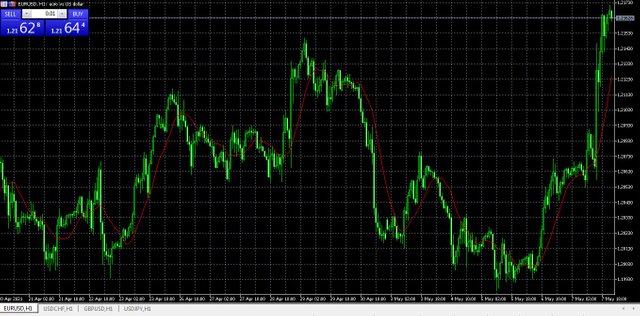
- Open the meta4 platform
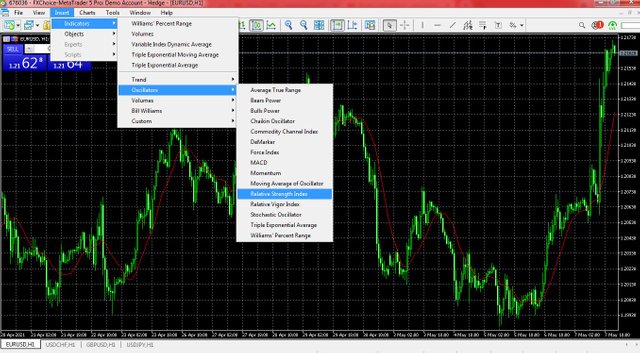
- Go to the insert tab, click on indicators, navigate to oscillators, then click on the relative strength index
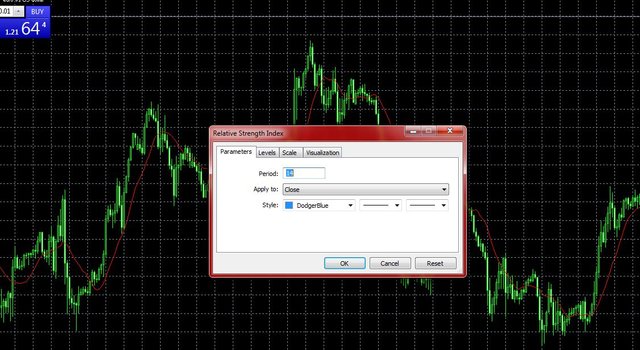
- Ensure the period is set to 14 and the apply to section is set to close
*If you look below and above. You will see a line above and below that is the RSI
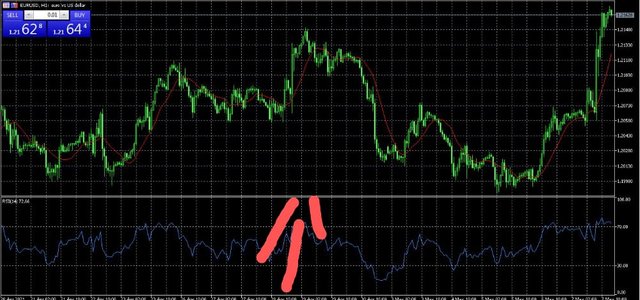
3b. What does the length parameter mean and why is it equal to 14
The RSI parameter is a timeframe measured on a scale of 0-100 with it's highs and lows on 70 and. 30 respectively
First if all , the RSI needs enough data , not too much, not too little to be able to calculate the overbought and oversold of the asset, so therefore 14 is more like a factual number that can be related within any period, it could be 14 hours, days, or weeks
3c. Can we change it
Yes of course it can be adjusted to a lower spread, or higher depending on ones scope of interest

4. How do you interpret the overbought and oversold signals when trading cryptocurrencies? (Screen capture required)
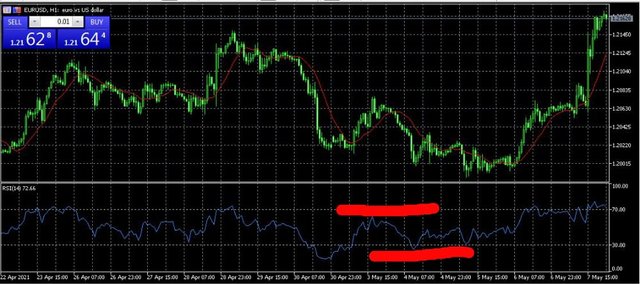
It's a bit simple , like I said earlier the RSI runs over a scale of 0-100 where signals above the 70 marks signifies overbought and signals below the 30mark signifies oversold
Looking at the image above, the upperline above the. 70 mark signifies the overbought signal bad the downwardline below the 30 mark signifies the oversold signal when trading

5. How do we filter RSI signals to distinguish and recognize true signals from false signals. (Screen capture required)
We can differentiate false signals from real ones when we allow the RSI for some time below 30 Mark or above 70 mark for longer than usual ignoring any sell or buy signal along the way
It could be tricky but requires a lot of patience
Take a look at the image below
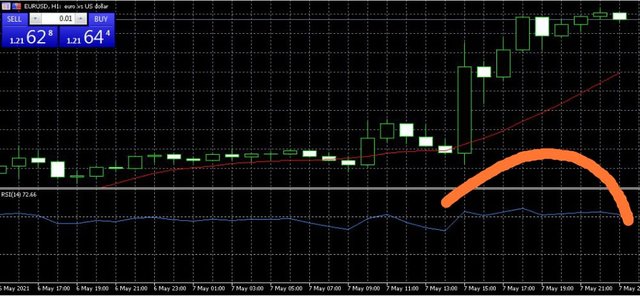
The image above is a zoomed picture inorder for us to get a clearer view , I tag this image as a false overbought signal because there were disturbances of sell and buy on the way
Also if we look at the image below
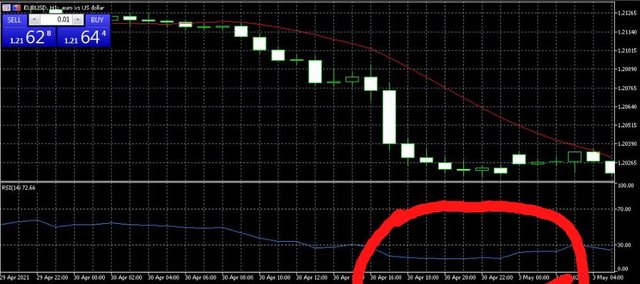
From the image we can discover that there was a long period of oversold and this could be considered real signal as there were no disturbances along the way

6. Review the chart of any pair (eg TRX / USD) and present the various signals from the RSI. (Screen capture required)
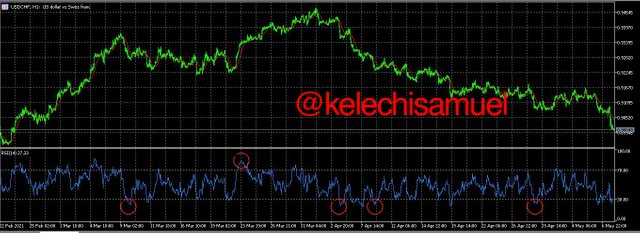
For this question, I will be reviewing the chart of USD/CHF us dollar vs Swiss franc as we can see the image below
On the 21st of March, we could notice an overbought signal higher than the 70 mark and this occurred after a drastic fall of the currency followed by a rapid increase
We can also see an oversold on the 9th of March, 2nd, 7th and 27th of April .
After the 21st March we notice fluctuations in the currency, from my prediction, I doubt there would be an overbought any time soon.

CONCLUSION
As we can all say it is the heart of every trader to have great trades and make cool profit
I would recommend the RSI indicator to any trader although it requires patience but compared to all I can say it is reliable and trustworthy to an extent
Thank you for reading through @kouba01
Hello @kelechisamuel,
Thank you for participating in the 4th Week Crypto Course in its second season and for your efforts to complete the suggested tasks, you deserve a 4/10 rating, according to the following scale:
My review :
Article with below-average content. You need to put more effort into your research so that your answers to the RSI questions and explanations become clearer. Try to take the time to understand the Relative Strength Index (RSI) trading indicator so that you can provide clear details about it.
Thanks again for your effort, and we look forward to reading your next work.
Sincerely,@kouba01
Downvoting a post can decrease pending rewards and make it less visible. Common reasons:
Submit