.png)
IINTRODUCTION

On this week's lecture by Professor @lenonmc21, we were taught about Harmonic trading with the AB=CD pattern. I will now attempt the homework assignment.

Question 1. Define in your own words what Harmonic Trading is?

Financial markets, much like the rest of life, move in phases and cycles. These cycles and phases are seen in micro and macro periods of any financial market. This basic principle is the basis of technical analysis' harmonic trading.
Often times, traders use technical analysis to try to predict the future movement of an asset market, through the study of previous market movements. There are often certain patterns observed in any market structure, and these market patterns often play out in certain ways.
For one to understand Harmonic trading, one needs to understand the idea behind the word "Harmonic." This implies the oscillating movement of a thing, in this case, an asset's price.
Harmonic trading takes advantages of these naturally occurring, and frequently observed market patterns and mathematics (i.e. Fibonacci ratios), in order to make a profit. That is to say Harmonic trading takes these market cycles/patterns and applies Finonacci ratios (which are naturally occurring ratios, seen, not just in trading, but in many aspects of nature) to them, based off former occurrences, in the hope that the market plays out how it has many times before.
The application of the Fibonacci ratios is used to set particular parameters for the validation of the patterns i.e. It validates pattern formation. It is also used for the definition of entry and exit points when trading these harmonic patterns.
There are different types of harmonic patterns that are easily found in many financial markets. In this assignment task however, we'll be looking at only the AB=CD harmonic pattern.

Question 2.Define and Explain what the pattern AB = CD is and how can we identify it?


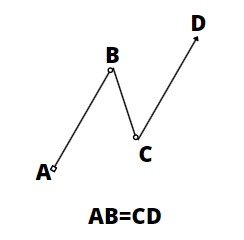
AB=CD harmonic pattern is one of those naturally occurring, frequently observed patterns in financial markets. It consists of four points, namely: A, B, C and D, connected by three lines: AB, BC, and CD. This pattern was first recorded by HM Gartley, a renowned technical analyst, and is of two types; the Bullish AB=CD pattern, and the Bearish AB=CD pattern. The bullish is observed when price is generally moving upwards, and the bearish, when price is generally moving downward.
How To Identify the AB=CD pattern.
Firstly, it is important to note that these patterns are usually validated by their adherence to fibonacci ratio parameters. Here are some of the characteristics of AB=CD patterns that one can use to identify them:
- The AB and CD lines are almost (not fully) parallel to one another.
- The AB and CD lines are almost the same length.
- Point C must not be greater than 78.6%, and must not be less than 61.8% on a Fibonacci retracement drawn from point A to point B.
- Point D must not be greater than 161.8%, and must not be less than 127.2% on a Fibonacci retracement drawn from point B to point C.
These features validate the AB=CD pattern.
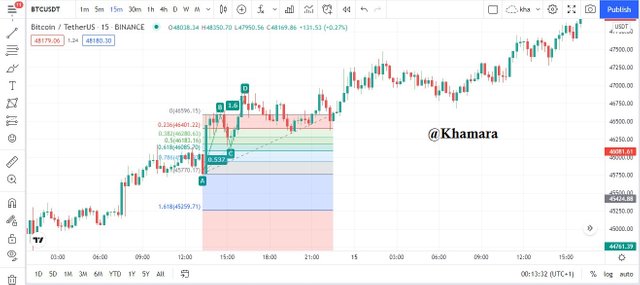
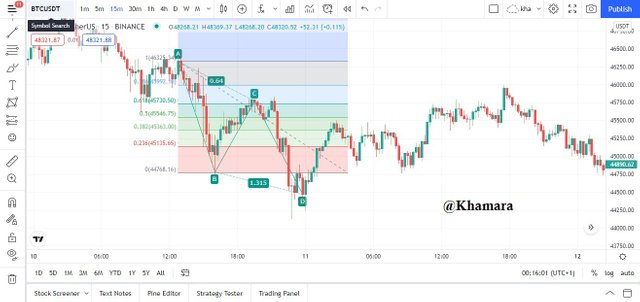
Here are some valid AB=CD patterns:


Question 3.Clearly describe the entry and exit criteria for both buying and selling using the AB = CD pattern?

Entry Criteria
The first criteria for entering a trade using the AB=CD harmonic trading strategy is to make sure that the pattern is validated by the Fibonacci retracements.
If the pattern is valid:
For a Bullish AB=CD pattern, we can expect a downtrend to occur after the point D, as such, one should wait for a red candle close, and then proceed to short.
For a Bearish AB=CD pattern, we can expect an uptrend to occur after the point D, as such, one should wait for a green candle close, and then proceed to long.
Exit Criteria
One can exit the market with profit or in loss.
For the Stop loss, it should be set at least 2% below or above the D point.
The Take Profit can be set at a 1:1 Risk/Reward from the Stop loss

Question 4.Make 2 entries (Up and Down) on any cryptocurrency pair using the AB = CD pattern confirming it with Fibonacci.

On the BTC/USDT chart, after finding a bearish AB=CD pattern, and confirming it with the Fibonacci retracement tool, a trade entry can be placed after the next bullish candle from the D point, with the stop loss set a little ways below the D point, and the Take profit at 1:1 Risk/Reward.

On the BTC/USDT chart again, after finding a bullish AB=CD pattern, and confirming it with the Fibonacci retracement tool, a trade entry can be placed after the next bearish candle from the D point, with the stop loss set a little ways above the D point, and the Take profit at 1:1 Risk/Reward.


CONCLUSION
This was an interesting lecture by Professor @lenonmc21, which i was glad to take part in.
NB: Unless otherwise stated, all pictures were taken from TradingView or designed by me in Canva.
You've got a free upvote from witness fuli.
Peace & Love!
Downvoting a post can decrease pending rewards and make it less visible. Common reasons:
Submit