
PROJECT NAME
CARDONA
Cardona is a decentralized blockchain platform that was founded by an Ethereum Co-founder by the name of Charles Hoskinson.
The open-source platform was named after Gerolamo Cardano a 16th-century Italian polymath. The Cardona platform is primarily aimed at creating a more secure and transparent community by redistributing power from various sources to individuals.
Its native token which is commonly known as Ada was named after a 19th-century mathematician by the name Ada Lovelace who is regarded as the world's first computer programmer.
The Ada token also helps in ensuring that the Cardona network is not centralized by granting holders the right to decision-making by allowing them to vote in favor or against any proposal on the platform.
The Cardona blockchain currently allows the operation of smart contracts alongside the development of DApps. The smart contract functionality was launched in September 2021 by Charles Hoskinson who initially announced it in August 2021.
The added use case caused the price of Asa to surge up to 116% in the proceeding months.
TOKENOMICS
| MARKET CAP | $35,799,369,266 |
|---|---|
| RANK | 7 |
| VOLUME | $3,151,361,174 |
| CIRCULATING SUPPLY | 33.71B ADA |
| MaX SUPPLY | 45,000,000,000 |

ANALYSIS
In this section, I will be explaining my technical analysis of the Cardona|USD pair on the MT5 trading platform.
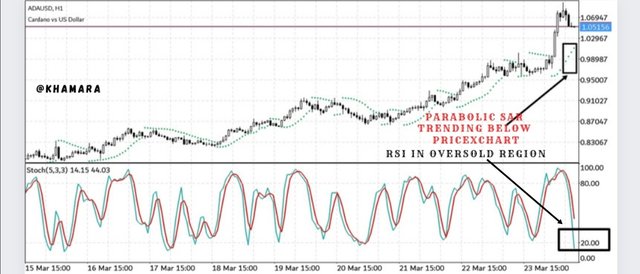
I started by applying a Parabolic Sar indicator and a stochastic oscillator indicator on a 1 hr timeframe.
On the 1hr time frame, I observed that the Stochastic Oscillator is at the oversold region which is below the 20 levels. This indicates a possible pride pullback or reversal.
Also, the parabolic Sar which is a trend-based indicator was found to be trending below the price chart which indicates a bullish trend.
Identifying the trend on a 1 hr timeframe was to help me avoid counter trading (trading against the current trend) which is very risky.
- Screenshot

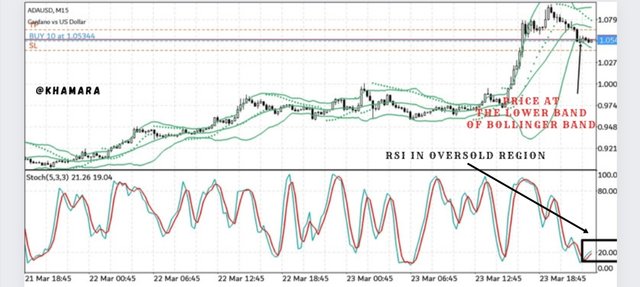
After observing the above on a 1 hr timeframe, I switched to a 15 mins time frame in other to identify a good entry which will help me reduce my stop-loss as a scalper.
On the 15mins timeframe, I saw the already added stochastic oscillator to be at the oversold region thereby signaling a bullish price reversal.
Because there was no obvious support area close to the price, I added a Bollinger band indicator and in addition, I saw that the price is at the lower band of the Bollinger band which serves as a dynamic support level.
Due to the various confluence I observed, I took a buy position.
- Screenshot

- EXIT
My exit was set in consideration of the Bollinger band which serves to identify dynamic support and resistance areas on the price chart.
My stop-loss was set just below the lower band of the Bollinger band and my take-profit set at the middle band which is at the horizontal support area. My stop-loss and take-profit now came to be in a ratio of 1:1.
- Result


CONCLUSION
So far the SteemitCryptoAcademy has been such a blessing to me. The fact that I was trading with a very low capital yet without fear of making losses is something I am grateful for.
All thanks to SCA for impacting me with a lot of priceless knowledge as regards trading.
Thank you professor @pelon53