
INTRODUCTION
This week's lecture was a wonderful one by professor @reddileep. He taught about the Heiken-Ashi candlestick chart and technique which can be used to identify trends and good trading opportunities. I have answered the questions of the homework assignment below.

Question 1:

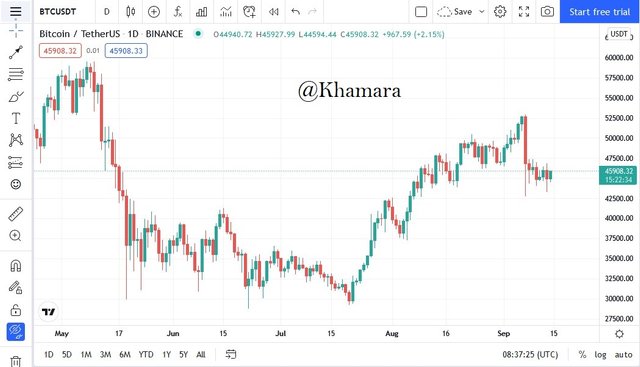
Muneisha Homma, the man who is considered to be the father of price action trading, was a rice merchant in 1700 Sakata, Japan, who created the traditional Japanese candlestick chart. Apart from the traditional Japanese candlestick chart, he also created another candlestick and chart type called the Heiken-Ashi candlestick.
The major aims/uses of the Heiken-Ashi candlestick type are to reduce price noise in the market, and for the identification of trends and demand/supply pressure in the market. This candlestick type really smoothes out the chart and makes it easier for traders to see the current direction of the market. Also, when used in conjunction with some other technical indicators can prove to be a formidable strategy fro traders in the market.
It is important to note that nothing comes without disadvantages, and some of the disadvantages of the Heiken-Ashi candlestick include the loss of some price data due to the averaging done in calculation of the points, which could adversely affect risk and risk management.

Question 2

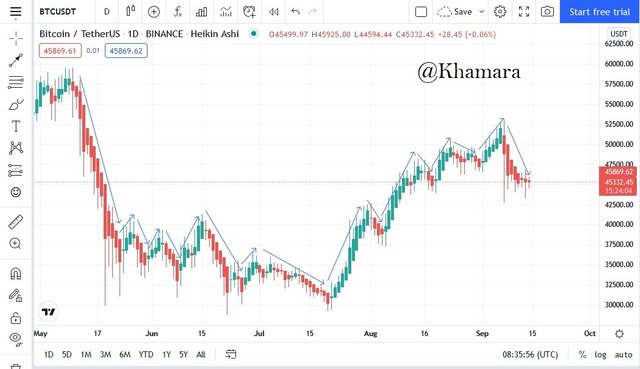
These two candlestick types are quite similar, however, they differ in some respects.
They both have four important points which are used to create the candlestick structure. These four points are the Open, High, Low and Close. However, one of the differences is that while the traditional Japanese candlestick sets these values based on time, the Heiken-Ashi candlestick uses a modified formula to calculate the values of these points.
Here are some more differences between the two types.
| Traditional Japanese Candlestick chart | Heiken-Ashi Candlestick chart |
|---|---|
| They include all the noise of price action changes | They smoothen out the noise from the chart by using an averaged version of price action |
| It can be difficult to identify continuing trends | It makes trend identification easier. |
| Candle color is changed by any price movement | Candle color changes only with major consistent price movement indicating trend change |
| Uses no information from previous candle to build current candle | Uses information from previous candle in construction of current candle |
| Current market price always corresponds with the current/closing price of current candle | Current market price is usually different from current/closing price of current candle |
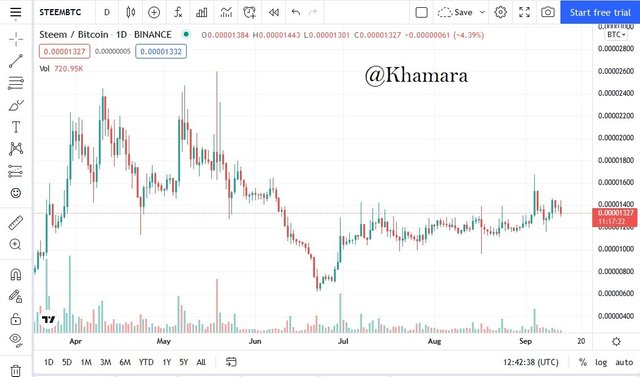
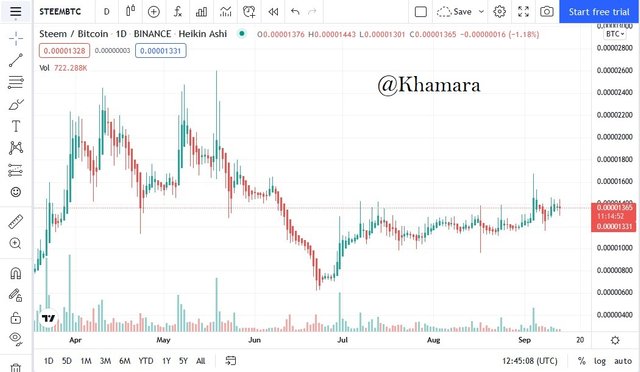
Here are two images of the same STEEM/BTC chart; One in traditional Japanese Candlestick format, and the other in Heiken-Ashi candlestick format. Some of the differences can be seen.

Question 3

As stated earlier, the four points of the Heiken-Ashi candle (Open, High, Low and Close) are not based on time but calculated using a formula. The formulas used for calculating these four points are:
Open: For the Open, the previous Heiken-Ashi bar's open and the previous Heiken-Ashi bar's close are added to one another, and the result is divided by two i.e.
Open = 1/2 (previous bar's open + previous bar's close)
Close: For the Close, the current traditional Japanese candlestick bar's open, close, high and low are added, and the value gotten is divided by 4 i.e.
Close = 1/4 (open + close + high + low)
High: To get the High of the Heiken-Ashi candle, the highest value betweeen the current traditional Japanese candlestick bar's open, close and high is taken for the high i.e.
High = Max (open, close, high)
Low: For the Low of the Heiken-Ashi candle, the lowest value betweeen the current traditional Japanese candlestick bar's open, close and low is taken for the low i.e.
Low = Min (open, close, low)
To illustrate all this, let us calculate the value of a Heiken-Ashi candle using the following parameters:
- Previous Heiken-Ashi bar's Open = 10
- Previous Heiken-Ashi bar's Close = 14
- Current traditional candlestick bar's Open =13.8
- Current traditional candlestick bar's Close = 15.7
- Current traditional candlestick bar's High = 16
- Current traditional candlestick bar's Low = 12
To calculate for the values of the current Heikin-Ashi bar...
Open = 1/2 (previous bar's open + previous bar's close)
Open = 1/2 (10 + 14)
Open = 24/2
Open = 12Close = 1/4 (open + close + high + low)
Close = 1/4 (13.8 + 15.7 + 16 + 12)
Close = 57.5/4
Close = 14.375High = Max (open, close, high)
High = Max (13.8, 15.7, 16)
High = 16Low = Min (open, close, low)
Low = Min (13.8, 15.7, 12)
Low = 12

Question 4

Trend Identification
The Heiken-Ashi Candlestick chart can help traders identify new and old trends in the market, and also give insight to traders on good trading opportunities. However, for us to understand how this works, we must first understand the major candle types that are seen in the Heiken-Ashi Candlestick chart.
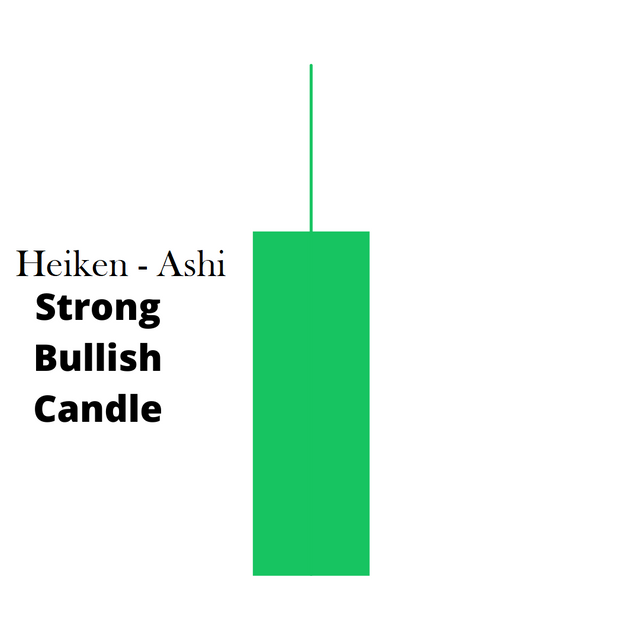
- Strong Bullish Candles: The color of these candles is, of course, dependent on the trader's preferences or the trading platform's default settings, however, these types of candles are usually colored green or white. Strong bullish candles are identified by their long wicks pointing upwards.
- Strong Bearish Candles: These are usually colored red or black, and are identified by their long wicks pointing downwards.
.png)
- Indecision candles: These can be bullish or bearish (colored green/white or red/black) and they are identified by two wicks, one pointing upward, and the other, downward.
.png)
With knowledge of these candle types, we can now identify different trends on a Heiken-Ashi Candlestick chart.
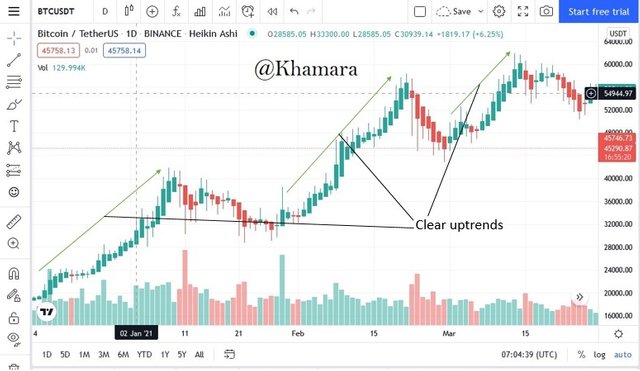
- Uptrends: These are characterized by successive strong bullish candles.
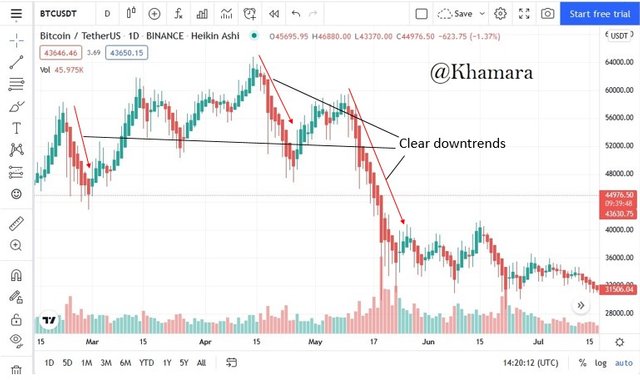
- Downtrends: These are characterized by successive strong bearish candles.
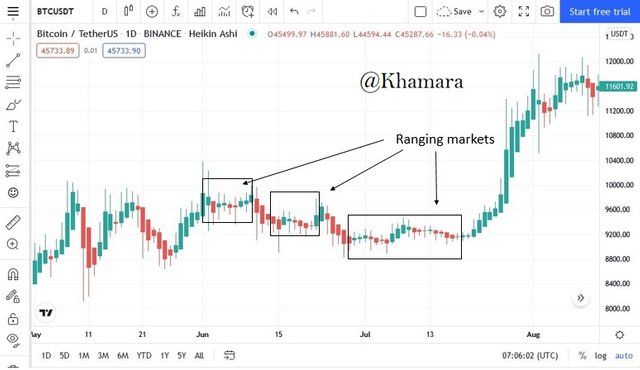
- Ranging markets: These are characterized by a majority of indecision candles.
Identification of Trading Opportunities
Traders know that any market moves in cycles. These cycles usually are made up of trends leading to ranging markets, which lead to new trends, and the cycle goes on.
The Heiken-Ashi candlestick chart can help a trader identify when a new trend is about to begin. On the Heiken-Ashi candlestick chart, a n indecision candle followed by one or two strong bullish/bearish candles, is usually the indication for a new trend.
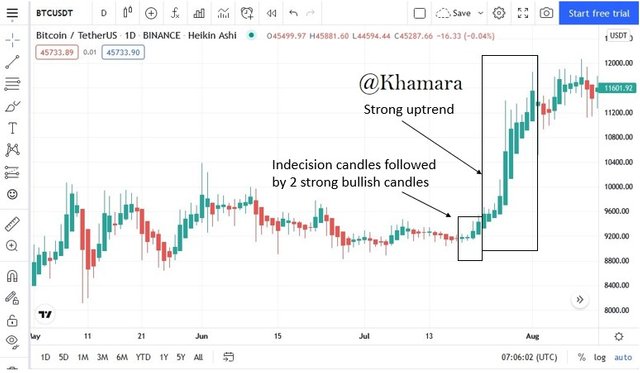
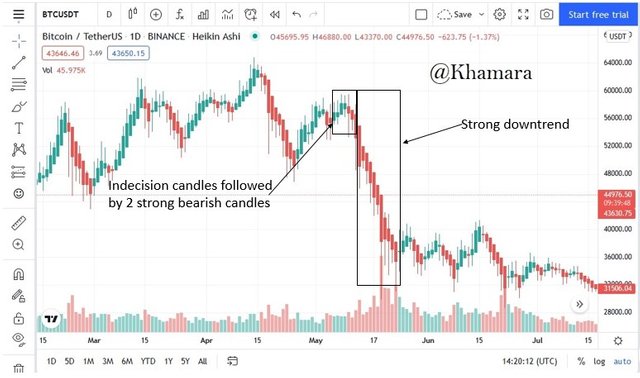
This presents a good trading signal to enter into the market. However, it is important to note that these markets are not rigid and do not always adhere to tendencies, and as such, these signals are never 100% accurate.

Question 5

Is it possible to transact only with signals received using the Heikin-Ashi Technique?
Yes.
Is it advisable to transact only with signals received using the Heikin-Ashi Technique?
Definitely not!
The Heiken-Ashi candlestick techique, while being a fairly reliable indicator of strong trends in the market, is, as all other strategies, not 100% accurate due to the flexibility and influence-ability of the market. Therefore, although you can use just the Heiken-Ashi candles to determine a good trading opportunity, it should always be confirmed with the help of other indicators. Some examples of good indicators it can be combined with include the 55-EMA, the 21-EMA, the RSI and the MACD.

Question 6

The Heiken-Ashi Technique is often combined with Exponential Moving Averages to generate better signals and determine entry points and stop loss. Some of the best values for the EMA are 55 and 21. I will now demonstrate trading with a signal from this combination.
First to try out this strategy, we need to enable both EMAs on our chart, as well as the Heiken-Ashi candlestick.
To enable the Heiken-Ashi Candlestick:
- Open TradingView and go to the chart.

- On the Chart, click the candle icon.
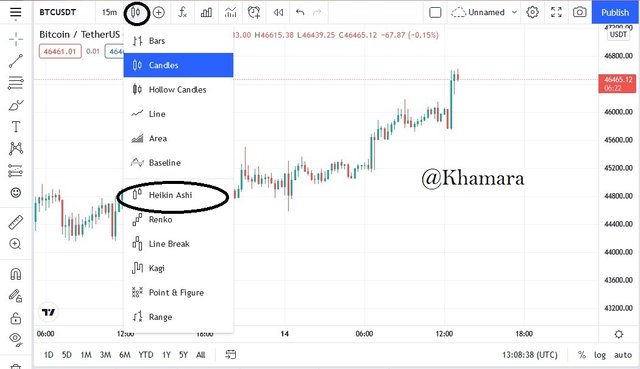
- Select "Heiken Ashi"
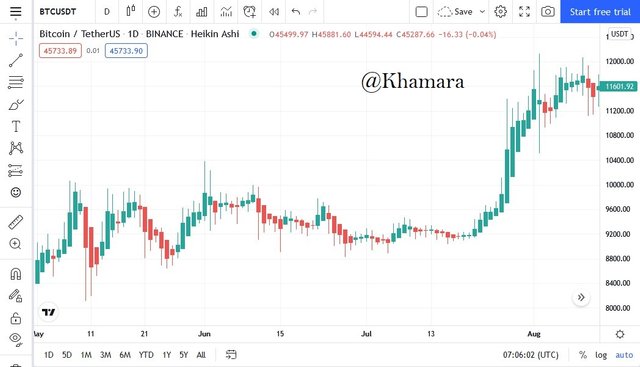
This will enable the Heiken-Ashi candlestick type.
Next, to enable the 55-EMA and the 21-EMA
- Click on the indicator icon to bring up the indicators pop-up menu
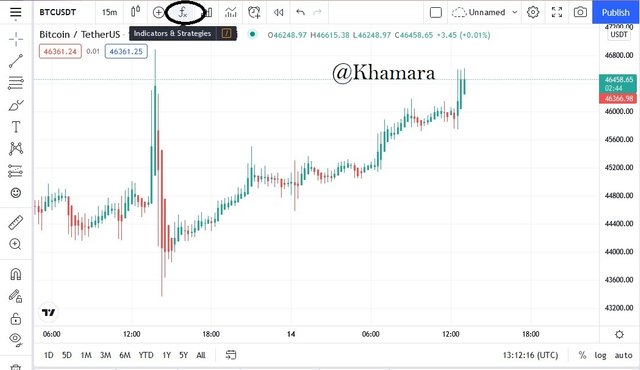
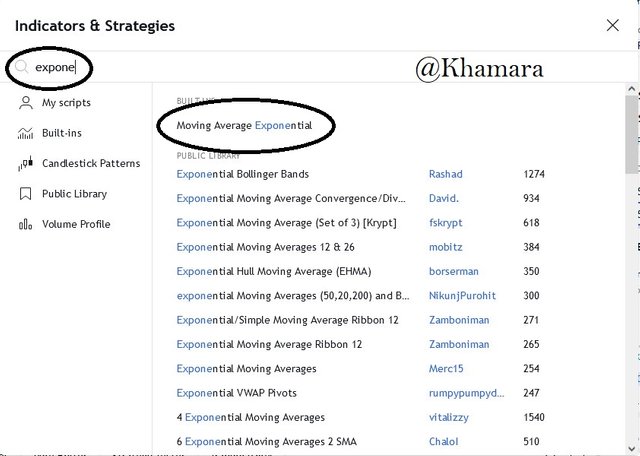
*Search for and click on the Moving Average Exponential ( We'll be adding two so click twice)
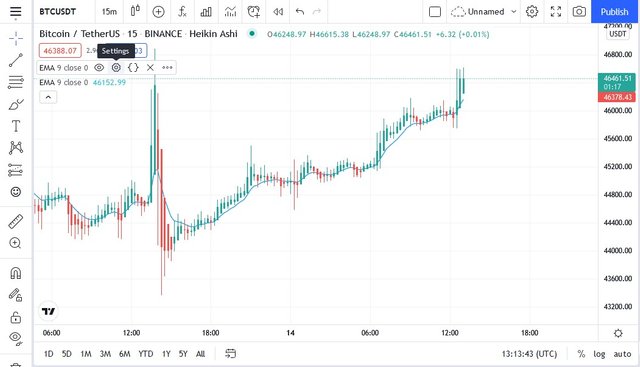
- To configure it, click on the settings icon for the indicator
- Insert the length required. For the first that would be 55, and for the second, 21.
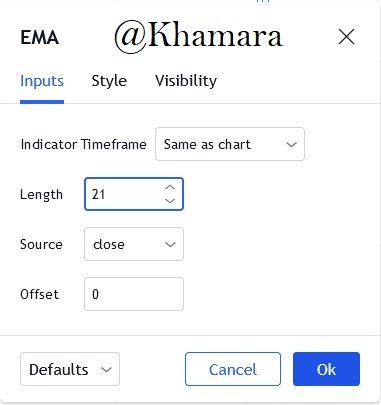
This will configure the EMAs for this strategy.
Buy Entry:
For this entry, the asset must be trading above both the 55 EMA and the 21 EMA. When an indecision candle is followed by two large buy candles above these two EMAs, it is a good buy signal.

As we can see above, i have circled the indecision candles leading to the subsequent bullish candles that made me enter the trade.
Also we can see above that the Stop loss is placed below both EMAs.

This trade hit the take profit level as we can see above.
Sell Entry:
For this entry, i wait till the asset is trading below both the 55 EMA and the 21 EMA, with strong bearish candles, indicative of a downtrend, and it is at the point of crossing i place my trade.

As we can see above, the Stop loss is placed above both EMAs, and the take profit level is placed at 1:1 Risk/Reward.

The trade has hit my take profit level.

CONCLUSION

From this lesson, we have learned the usefulness of the Heiken-Ashi candlestick chart and trading technique. Thanks to professor @reddileep for this lecture, and i hope you enjoyed reading it.
NB: Unless otherwise stated all pictures were taken from the Trading View platform, or designed by me on Canva.com.