Divergence is all about technical analysis which occurs when price of any financial instrument diverges starting from momentum or by other range of indicators. This is a kind of discrepancy which can be used for signaling of reversals or continuations of different trends in a significant way.
Now I want to talk about types of divergences along with some of the really examples;
Types of Divergences:
Regular divergence
• Regular divergence can also be referred as classical divergence which may occur if price makes new high or low trend but indicator fail to reaching a corresponding extreme and indicators can be any like RSI or MACD etc.
There are different type of regular divergence that I am explaining below;
Bullish divergence
Bullish divergence is that in which price makes lower low trend but indicators makes as a result higher low.
Bearish divergence
Bearish divergence is again type of regular divergence in which price makes higher high while indicator makes as a result lower high trend.
Significance:
If there is regular divergence then its can be an indication of potential reversals.
Practical Example:
If I move back in 2019 then price of Bitcoin made lower low with 3200$ but at the same time RSI indicator made high low and it was a bullish divergence which give signals to potential reversal so for that reason Bitcoin price rise to $13000 significantly.
Hidden Divergence
Hidden divergence is another type of divergence which occurs if the indicators are making new extreme but price is failing to reach corresponding extreme.
There are different types of hidden divergence that I am going to explain below;
Types of Hidden Divergence:
Bullish hidden divergence
• This is a type of hidden divergence in which indicators are making higher but price is failing to reach a new high.
Bearish hidden divergence
• Again this is a type of hidden divergence in which indicators are making lower low but prices are failing to reach New low.
Significance:
• If I talk about significance of hidden divergence then it can be an indication of continuation of a particular trend.
Practical Example:
If we move back in 2020 then price of Apple stock market confirmed a consolidation but MACD indicator made higher high so that was bullish hidden divergence which gives signals to continuation of trends arise from $60 to $140.
Some other types of divergence are below;
Double divergence
Double divergence occur due to continuous divergences or consecutive divergences occurs in similar direction.
Triple divergence
Triple divergence occurs when three continuous divergences occurs in similar direction.
Divergence with oscillators
These are divergences by the use of oscillators for identification of divergences and oscillators that can be used are RSI or CCI.
Divergence is really helpful for making in formed training decisions. I want to share some real world examples to explain it;
Bullish Divergence Example:
• Instrument I am going to talk is Tesla (TSLA) stock.
• It's time frame was each day.
• Date was March 2020
Price Action:
TSLA price was making lower low ($350) amid COVID-19 pandemic dangers
• RSI Divergence:
RSI was makint a higher low (30) which was the indication of bullish divergence.
• MACD Divergence:
MACD histogram was crossing above signal line.
Trading Decision:
- Purchasing of TSLA at $360 with implementation of stop-loss at $330 and take-profit at $450.
- Reason was that Bullish divergence was suggesting a potential trend reversal so that was significant informed decision to make.
Outcome:
- As a result TSLA price arise to $700 which yields 94% profit.
Bearish Divergence Example:
- Instrument I am taking is Bitcoin (BTC)
- Time Frame is of around 4-hour
- Date is December 2017
Price Action:
BTC price was making higher high ($19,666)
• RSI Divergence:
RSI was making lower high which was 70 which was an indication of bearish divergence.
MACD Divergence:
MACD histogram is crossing below signal line.
Trading Decision:
- Selling of BTC at $18,500 with a stop-loss implementation at $20,000 and taking-profit at $15,000.
- Reason was Bearish divergence which suggest a significant trend reversal.
Outcome:
- As a result BTC price fell to $3,200 which yields a 82% profit.
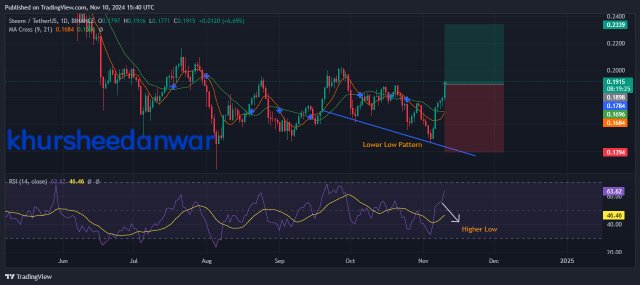
Now let's have a look at STEEM/USDT charts to have a look at bullish and bearish divergences
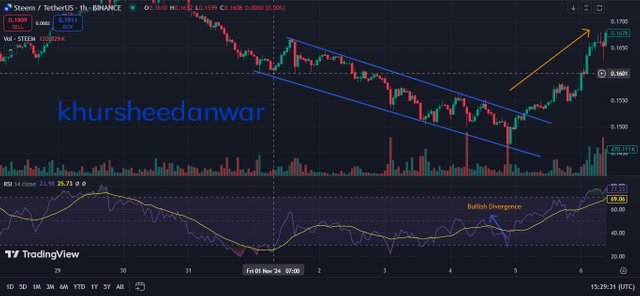
• This is bullish divergence shown because blue lines in screenshots which is below is showing lower low while RSI is showing higher low so this is a bullish divergence.
If you want to combine divergence analysis with other technical indicators then it could be helpful for enhancement of decisions related to trading. Now I am going to explain that how divergent can be combined with moving averages or bollinger bands.
Combining Divergence with Moving Averages:
• If we use moving average then it can be helpful for identification of direction of trend that either there is uptrend or down trend.
• Applying divergence analysis for confirmation of reversals of trends.
Example: STEEM token
I want to give an example of STEEM in this case so;
• If we move back in 2017 then STEEM price was in a bullish regular divergence with RSI then at that time price was making a lower low of around $0.15 mean by RSI was making a higher low which was 30.
Mean by if I talk about 50 period moving average then it was around $0.25 and 200 period moving average for the round $0.10 which was an indication of uptrend.
Bullish Divergence Confirmation:
• Price was broken above 50-period moving average.
• RSI was crossing above 50.
• STEEM price arose at that time from $0.15 to $7.50.
Combining Divergence with Bollinger Bands:
• If I talk about use of Bollinger bands then these are helpful in identification of fluctuations and directions of trends in market.
• Applying of divergence analysis was for the confirmation of trends reversals.
Example: STEEM Token
• If we move back in 2020 then STEEM token formed a hidden bearish divergence with MACD technical indicators so in that case price of the token was consolidated in between $0.15 and $0.25 but MACD indicator was making a lower low. In that case this indicator is indicating that fluctuations or volatility are increasing because upper band was at $0.30 and lower band was at $0.10.
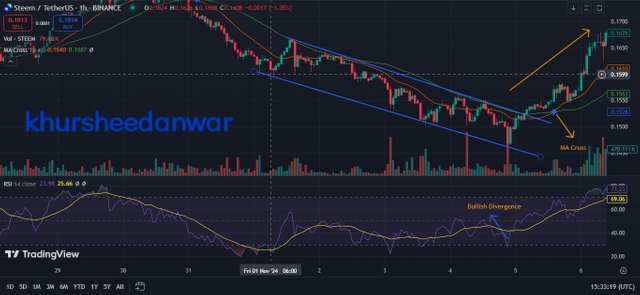
Bearish Divergence Confirmation:
• Price was broken below lower Bollinger Band.
• MACD indicator was crossing below signal line.
• STEEM price fell from $0.20 to $0.05 unfortunately.
There can be other technical indicators which can be combined with divergence;
• Fibonacci Retracements
• Stochastic Oscillator
• Force Index
• On Balance Volume (OBV)
Benefits of combining divergence with other indicators
There are multiple benefits of combining divergence with other indicators which I am explaining below;
• It cause enhancement of reliability of signals.
• It cause enhancement in management of risks which are associated.
• It can be useful for increasing and build up of trust and confidence in traders for making trading decisions
• It can be useful for better identifying trend continuations or reversals.
I am explaining here my trading strategy by the use of divergence as primary signal for entry and exit criterias.
Strategy Name:
• If I talk about name of my strategy that I am using then this is divergence based momentum reversal.
Objective:
Major objective of implementation of this trading strategy is to help in identification of potential trends of reversals by the use of divergence analysis.
Markets:
Stocks, cryptocurrencies etc.
Time Frame:
4-hours at daily basis.
Indicators using:
• RSI (14-period)
• MACD (12, 26, 9)
• Moving Averages (50-period, 200-period)
Entry Criteria:
Long Entry:
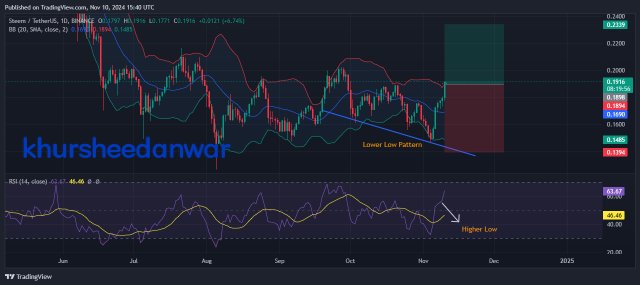
• Bullish regular divergence:
In this divergence RSI makes higher low while price is making lower low.
• MACD histogram crosses beyond the signal line.
• Price closes beyond 50-period MA.
Short Entry:
• Bearish Regular Divergence:
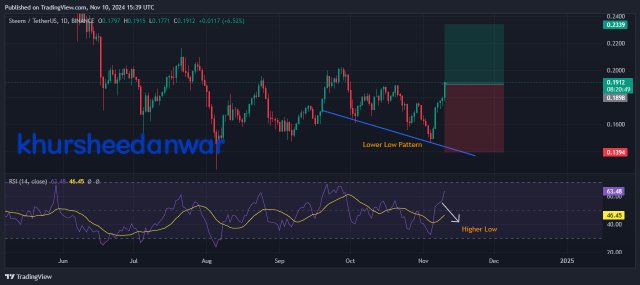
In this divergence type RSI is making lower high while price is making higher high.
• MACD histogram is crossing below signal line.
• If Price is closing below 50-period MA.
Exiting Criteria:
Long Exiting:
• Bearish Hidden Divergence:
In this type of divergt RSI will make lower high but price will make higher high.
• MACD histogram is crossing below signal line.
• If price is closing below 50-period MA.
Short Exit:
• Bullish Hidden Divergence:
In this divergence RSI is making higher low while price is making lower low.
• MACD histogram is crossing above signal line.
• Price is closing above 50-period MA.
Confirmation Criteria:
• Divergence should be at overselling /overbuying levels like RSI < 30 or > 70.
• MACD histogram should be crossing signal line.
• Price should be closing beyond 50-period MA.
Filters used for reduction of false signals:
• There are trend filters which use 200 period MA for determination of direction of trends.
• There are some of the volatility filters which are used for confirmation of volatility and they use average true range.
• There are some of time filters which are used for avoiding trade during some particular events or News or high impacts of economic releases.
Risk Management:
For management of risk it is important for traders that they should set the following things;
• They should set stop loss at 2% of their trading capital.
• They should set a profit at 5% of trading capitals.
• Traders should be setting position sizing by using two percent of there trading capital.
Performance Metrics:
• In performance matrix win loss ratio should be calculated by monitoring percentage of trades that are winning.
• In performance risk reward resource should be calculating by monitoring average risk two reward in each trade.
• In performance there is a need of monitoring that what is maximum draw down.
There are some of the limitations of divergence trading that I am going to explain below;
False signals
• Divergence can create a condition of false signaling especially in those conditions in which market is trending.
Lagging indicator
• Divergence depend on lagging indicators so they can delay signaling of generation.
Context dependence
• Divergence signals need more contextual no how about conditions of market in general.
Overreliance
• If you rely completely at divergence then you can miss different opportunities that were suitable for you as well as trade can also be incorrect.
Confirmation biasness
• Divergence signals maybe interpreted by traders for fitting their biases.
Common Pitfalls:
Common pittfalls are below;
• If traders ignore context of market in terms of trends, fluctuations and news.
• If there is over trading or under trading solely by reliance at divergence signals.
• If there is failing for confirming divergence with other indicators.
• If there is no adjustment for market conditions like range bound markets.
• If there is a lack in management of different type of risk.
Practices for using divergence
If I talk about some of the best practices or strategies for using divergence then these are below;
• There should be a confirmation of direction of friends of market by using multiple indicators.
• There should be proper evaluation of market and liquidity.
• There should be proper consideration of news and events that are affecting the market.
• There should be proper verification of divergence signals with use of multiple indicators.
• There should be clear setting of risk management parameters.
Comprehensive trading plan for traders
• There should be clear and defined training objectives and tolerance of risk.
• There should be a proper trading plan in which you should combine divergence with other technical and fundamental analysis.
• There should be a use of multiple time frames for more better analysis.
• There should be a clear entry and exit criteria.
• There should be proper alternations in planning with fluctuations in market conditions so for this there is a need of proper monitoring.
Management of risks
• There is a need of setting stop loss and take profit levels.
• There is a need of utilising position sizing for management of risk.
• There is a need of proper monitoring and making adjustments in leverage.
• There is a need of diversification of trades for the minimization of exposure.
Divergence confirmation techniques
There are some of the divergence confirmation techniques which I am going to explain below;
• Usage of multiple oscillators like RSI,MACD etc.
• Combination of divergence with chart patterns like reversals.
• Confirmation with volume and analysis of open interest.
• Usage of moving average for the purpose of filtering signals.
I want to invite @lunasilver,@sailawana,@pelon53 to participate
Upvoted! Thank you for supporting witness @jswit.
Downvoting a post can decrease pending rewards and make it less visible. Common reasons:
Submit