
For making a technical analysis there is a Fibonacci retracement tool which is used in financial markets as well as in crypto markets and this tool is based on the sequence which is a kind of mathematical sequence in which each number is the addition of the two last one or preceding ones like 0,1,1,2,3,5,8 and more...
If I elaborate Fibonacci retracement levels more horizontal lines that are drawn on a chart for the identification of the significant support and resistance levels and these levels are derived from special ratios which are called Fibonacci ratios and this ratios we get by dividing a number in the sequence by that number which this sequence follows.The most commonly used Fibonacci retracement levels are 23.6%,38.2%,50%,61.8%,78.6%.
Now I want to talk about Fibonacci retracements implementation in the Crypto market so let me share it in different steps.
Identify a Significant Price Move
First of all there is a need to identify a significant price move for the implementation and applying of Fibonacci retracements and you should properly identify that whether it is up trend or down trend because move would be swing high and swing low in the price chart when you would see.
Draw Fibonacci Levels
You have to draw Fibonacci levels after the identification of different price moves and when I talk about representation of different levels then it is like this that 0% level would represent that there is lowest swing and 100% level would represent that there is highest swing and other levels like 23.6%, 38.2%, 50%, 61.8%, and 78.6% would represent different support and resistance levels.

Potential Support and Resistance Levels
Fibonacci retracements levels are used for identification of different levels either they are support or resistance levels and if there is uptrend then Fibonacci levels would be just like support and hence opens buying opportunities for investors or traders and if there would be downtrend then these levels would be act as resistance and in this way selling opportunities would increase.
Price Reactions at Fibonacci Levels
At different and particular Fibonacci levels there are different price actions that traders observe and pay attention towards it.If price of a particular cryptocurrency is bouncing off a Fibonacci level then it shows that traders can enter or exit from their position as it is an indication of support or resistance levels.
Conjunction with Other Technical Analysis Tools
Fibonacci retracements is one of the most wonderful tool for technical analysis but it is also used in conjunction for strengthening of technical analysis more and if I give an example then you can say that suppose traders are looking for Fibonacci retracements levels along with trendlines, moving average and chart patterns for enhancement in the chances of a successful trading.
I have taken screenshots of BTC/USDT,ETH/USDT and STEEM/USDT charts as well as I have also applied Fibonacci retracements levels in it during both up trends and down trends and I would love to explain then in the form of screenshot that I have shown below.

During an uptrend you can see in the chart that how could you identify the swing low which means the point which is lowest and swing high which means the point which is highest regarding the price movement and after that I have drawn Fibonacci retracements levels from the swing low to the swing high in this scenario and you can also see it in the picture very clearly that I have shown you in the below screenshots so you can see that these are the levels that are acting as potential support levels or levels at which day is significant support and there is a chance of bouncing back up of the price.
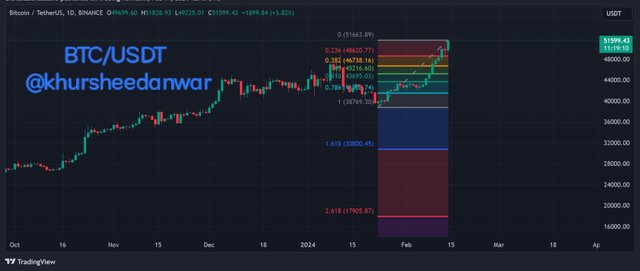
This is above you can see in the BTC/USDT charts that how I applied Fibonacci retracements tool for checking uptrend and downtrend and support and resistance levels.
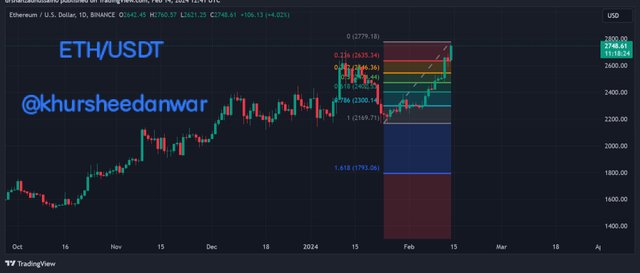
This is above you can see in the ETH/USDT charts that how I applied Fibonacci retracements tool for checking uptrend and downtrend and support and resistance levels.
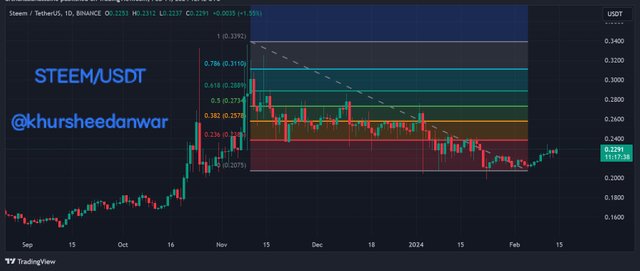
This is above you can see in the STEEM/USDT charts that how I applied Fibonacci retracements tool for checking uptrend and downtrend and support and resistance levels.
Similarly during down trend again I am providing your generalized information that how I identify the swing high which is highest point and swing low which is lowest point in the chart related to price movements and then I again draw Fibonacci retracements levels in the chart you can see from the swing high to the swing low and these are the levels that are acting as significant levels of resistance where the price maybe encounter a lot of selling pressure very near and also in nearby future.
Now you can see that as I analysed my information through these charts I have shown you then in the same way whoever would make analysis like this would be able to make informed decisions about their significant entry and exit points.
Fibonacci retracements levels like 0.382,0.500 and 0.618 are most important for making the technical analysis and these are most widely used by traders and investors for the identification of potential support and resistance levels in financial markets and in crypto market so I want to break down the significance and importance of these specific levels that are asked in this topic that how traders interpret them.
0.382 Level
0.382 level is 38.2% retracement levels which is extracted from Fibonacci sequence so according to traders this level is shallow retracement level and during an up trend the time in which price pulls back to this level then it is seen as a supported area in which buyers come in and they are responsible in this way for pushing the price back up and similarly during the down trend selling pressure increase so it is acting as a resistance area.
0.500 Level
0.500 is all level which is called 50% retracements level and it is also one of the most significant level considered by the investors and traders and more specific is called reversal area so in this case during an ab trend when price retraces to this level then it could be act as support level and could be attached cans level so it is very common for traders that they should vigilantly watch the reactions of price during this level because it can let know to traders about the strength level and reversal points.

3. 0.618 Level
3.0618 is called 61.8% retracements levels and in this level when price retrace to this level then according to traders it is more important to seek for potential support and resistance so during an upward trend this level is seen as support areas so in support areas buyers come in we all know and during down trend situation becomes opposite to that so it is seen as resistance area in the selling pressure increase again so this point is very important because of its continuation trend.
Fibonacci retracements levels are extracted from the golden ratios which is a mathematical concept present and traders have firm believe that these are the levels which have psychological significance also and market participants also tend to react to market.
For interpretation of these levels traders like and prefer to combine Fibonacci retracements levels with other tools that are used in making the technical analysis and these are trendlines,moving averages and candlestick patterns most widely used by traders and by doing this behind purpose is do enhance the probability of identification of significant support and resistance levels or areas in a more accurate way.
Just like Fibonacci retracements level other technical indicator is also that are used for the technical analysis and these indicators are moving averages and relative strength index which can provide a great opportunity for me earring or more clear analysis so I want to go into more deep understanding that how these tools synergize and enhance the understanding of overall market.
Fibonacci Retracement and Moving Averages
Moving averages are used at large scale for the identification of trends like support and resistance levels so when we combined it with Fibonacci retracements then they can provide more valuable confirmation signals so here I am also explaining their working that how they work with each other.
- Trend Identification
Moving averages are very beneficial in the identification of overall trend in the market and if I given examples then let's say that are 50 days moving average is indicating that there is medium trend and by alignment of it with the Fibonacci retracements levels with moving average we can easily identify significant levels of retracement within the trend.
- Confluence Zones
If Fibonacci retracements levels is combining with moving average is then it means that there is a creation of confluence zone in this way and these zones act as stronger level for support and resistance both. At this stage and at this level traders look for price reactions for validation of potential entry and exit points.
- Moving Average Crossovers
When I talk about moving average crossover then we can say that moving average across overs are just like golden cross and death cross and they can be used in conjunction and combination with Fibonacci retracements levels because when our crossover align with retracements level then it adds more weight to significant support and resistance levels or areas.
Fibonacci Retracement and RSI
Relative strength index we all know about it that it is a momentum oscillator and it is used for the measurement of speed and changes in the movements of prices of particular cryptocurrency so when we combine it with Fibonacci retracements levels then traders may be able to know about significant continuations and reversals in market.So let's know that how they are complementing each other.

- Overbought/Oversold Levels
Relative strength index is very helpful in identification of overbuying and overselling conditions.When relative strength index reach to there extreme levels which are more than 70 and less than 30 then traders look for the or search for the significant reversals and if these levels align with Fibonacci retracements then it ads conjunction to the analysis which increase and enhance the chances of reversals and continuations.
- Divergence
When price of a cryptocurrency and relative strength index moves in opposite directions then in this way divergence occurs and bullish divergence indicates that there is a significant reversal to upside and bearish divergence is an indication that significant reversals are towards down side but when we combine divergence signal with Fibonacci retracements then more accurate entry and exit points may be determined by traders.
By the use of Fibonacci retracements we can understand recent price action of STEEM/USDT so let me share it with you.
Fibonacci retracements is one of the most significant tool I have already talk with for the measurement and identification of the support and resistance levels on the basis of a mathematical sequence and for that reason we can also analyse in a true way about recent price movements of STEEM/USDT and in the identification of possible areas of interest.
First of all if we want to start it then there is a need to identify a potential swing in the price of STEEM/USDT so suppose that recent up trend from a low of $0.20 is to a high of $1.50 so this is a range of swing in which we can work easily by implementation of this tool.
By the use of Fibonacci retracements tool first of all we have to plot the retracements levels at the chart at which we want to make an analysis and common replacement levels that we are going to use our 38.2% 50% and 61.8% and these levels would act as levels of potential support during pull back in up trend.
When we look at the chart then we would see that price of STEEM/USDT has been retraced from the high swing of $1.50 to a low of around $0.80 so now we can apply this tool which is Fibonacci retracements levels to this pullback.
When we talk about 38.2% replacement level comes in around $1.05 and in the same way when retracement level would be 50% then it would be at around $1.15 and with the use of 61.8% retracements level it would be around $1.25. so in these levels definitely there is an opportunity for buyers to step in and be responsible to push the price up as desire the support areas.

Now above in the case we have seen that price of STEEM/USDT is seen or has been seen to find out the support around 50% replacement levels and at the level of dollar 1.15 and after that it started to bounce back so it is an indication that there was buying interest increase in this level.
So now when we talk about now about potential targets for the upward move then we can use Fibonacci extensions for the identification of these levels and common extension level that are used are 127.2% 161.8% and 261.8%.
By implementing Fibonacci extensions told to the up trend which is recent we can easily project potential targets for the continuation of the up move in market. So first of all when I talk about 127.2% extension level then it comes round about $2.0 and in the same way 161.8 percent extension level is at around $2.50 and 261.8% level would be around more than both the previous one and it is round about $4.0.
So this is you have seen that these levels are representing the significant areas where the price of STEEM/USDT can approach up trend continuity in the upcoming future but it is very important to note that projections are not guarantee always but we can make it more accurate by conjunction of different tools as I have explained over all in my post.
hello brother Your explanation simplifies the concept of Fibonacci retracement and its application in crypto trading making it accessible to everyone. The step-by-step guide and screenshots for BTC/USDT ETH/USDT and STEEM/USDT charts during both uptrends and downtrends are incredibly helpful.
Your clear explanations along with the visual representations, provide a comprehensive understanding of how traders can identify potential support and resistance levels using Fibonacci retracement. Keep up the great work making complex concepts easy to grasp 👏📈
Downvoting a post can decrease pending rewards and make it less visible. Common reasons:
Submit
TEAM 5
Congratulations! Your post has been upvoted through steemcurator08.Downvoting a post can decrease pending rewards and make it less visible. Common reasons:
Submit
@enamul17
Thanks for kindness ☺️
Downvoting a post can decrease pending rewards and make it less visible. Common reasons:
Submit
Thank you for simplifying the concept of Fibonacci retracement levels for us. Your explanation makes it easier to understand how this technical analysis tool is applied in crypto markets.
Identifying significant price moves and determining whether it's an uptrend or downtrend are useful steps in effectively utilizing Fibonacci retracements.
Downvoting a post can decrease pending rewards and make it less visible. Common reasons:
Submit
This breakdown of Fibonacci retracement is incredibly helpful ! Your simple language and detailed explanations make it accessible for everyone especially those new to technical analysis. The charts and real -world examples add a practical touch. Best of luck in the contest
Downvoting a post can decrease pending rewards and make it less visible. Common reasons:
Submit
Those who trade in crypto understand the importance of this fibonacci tools very nicely you have written us step by step thank you very much for sharing fibonacci really if used correctly traders can learn a lot of information from there and avoid big losses there.
Downvoting a post can decrease pending rewards and make it less visible. Common reasons:
Submit
Upvoted. Thank You for sending some of your rewards to @null. It will make Steem stronger.
Downvoting a post can decrease pending rewards and make it less visible. Common reasons:
Submit
Thanks for voting 🙂
Downvoting a post can decrease pending rewards and make it less visible. Common reasons:
Submit
Hello dear, greetings to you. I hope you are enjoying the sweet moments of your life.
We use Fibonacci tool for technical analysis. It can be used in all financial markets. Mostly crypto traders are using it. Their is a simple calculation mechanism behind it, you have beautifully explained it. The analysis you have made for BTC, ETH and STEEM Coin are perfect too.
The most commonly used Fibonacci retracement levels are 23.6%,38.2%,50%,61.8%,78.6%. Yes very true, we call them the golden ratio levels. Most of the time price respect these levels. You are using moving averages, finding current trend and Confluence Zones along with Fibonacci. That's too good dear. We should do a lot of confirmation before going to take any trade in the market.
Wish you best of luck in the contest, keep blessing.
Downvoting a post can decrease pending rewards and make it less visible. Common reasons:
Submit
Your breakdown of Fibonacci retracement is seriously a game-changer. The way you explain it in simple terms with all the nitty-gritty details makes it so easy for anyone, even those who are just starting out with technical analysis, to grasp. And let me tell you, those charts and real-world examples you throw in there added such a practical touch that really brings it all to life. Best of luck, my friend.
Downvoting a post can decrease pending rewards and make it less visible. Common reasons:
Submit
Dear friend
What a beautiful piece to you have here.
You have clearly explained what Fibonacci retracement is and how the percentage ratios are derived.
You have also clearly shown using charts of 3 crypto pairs to illustrate it's usage during an uptrend and a downtrend.
Those 3 key levels are specific levels to watch since crossing those ratios can actually mean in total reversal of trend especially in higher time frames. Your choice of using moving averages and rsi together with Fib is top notch.
Thank you for the insightful writeup. Wishing you the best in this contest.
Downvoting a post can decrease pending rewards and make it less visible. Common reasons:
Submit
Has dejado claro el concepto de los RF, su orígen y su importancia en el análisis técnico.
Son buenas las explicaciones de varios e importantes indicadores y sus sinergia con los RF, dándole importancia relevante al análisis técnico de los RF.
¡Gracias por compartir, saludos y bendiciones!
Downvoting a post can decrease pending rewards and make it less visible. Common reasons:
Submit
Your article makes the Fibonacci recursion clear and comprehensive as a technical analysis tool. The in-depth analysis and real-world examples you present along with the charts demonstrate a holistic approach to technical analysis. Your article has a lot of information supported by informative and professional examples.
Downvoting a post can decrease pending rewards and make it less visible. Common reasons:
Submit