Chartist analysis is one of the most important topic regarding technical analysis of cryptocurrency because by the use of it we can we get future price movements of different currencies and stocks. When we have to predict future price movements by the use of chartist analysis then it is always keep in mind about the historical price,volume data and using the historical chart patterns we can identify and predict the potential trends and volume data in the future.
When I talk about chart patterns then these are specific shapes which appears at price chart and through the use of chart patterns we can identify and predict that how people are feeling in the market and what is the trend going on in the market either it is on upward side or on downward side.Chart analysis are very helpful for investors to make the market decisions about any investment so there are some common patterns that we can keep in mind and these patterns are head and shoulder,double tops, triangle and flags etc.
Chart patterns have a lot of their significance because they can give us prediction and an idea that where the price in the future can be headed. When I give an example then suppose that if we are talking about bullish pattern in market then it means that price would go up in the future but if we see a breakdown according to the bearish trend then definitely price would go down in future.Not only this it also becomes very helpful for traders and investors to take decisions about buying and selling a particular cryptocurrency.
There could be another advantage we can consider that why they starts are important to consider when you have to predict about the future of cryptocurrency. If there are any risks involved about the future of cryptocurrencies then these charts seems to be very helpful there for that traders and investors to make the informed decisions that whether they have to invest in particular project or cryptocurrency or not.
Chart patterns and never give you guarantee about a particular cryptocurrency future that's why we can say that these are always not right and it would be not wrong to say.Still we can't ignore chart analysis or chart patterns significance but combining it with other technical analysis tools could give you more better understanding about cryptocurrency future.
Now I would like to explain about shoulder head shoulder pattern that what is this in my theoretical explanation and not only this along with my theoratical explanation I would like to share screenshots of Bitcoin /USDT pair.
When we have to do technical analysis about a particular currency then there is one of the most well known pattren we use which is shoulder head shoulder pattern. Through this pattern we can see that what is the potential reversal in uptrend and in the start of a down trend.

When we do technical analysis then at chart we see shoulder head shoulder pattern in which we can see that there are three distinct and high peaks which are indicating the prices. The peak which we see in the middle is called head and one of the most highest point in between the two peaks that are on the sides of the middle peak and side peaks are known as shoulders. Shoulders are normally at a same level so we can say that this is neckline.
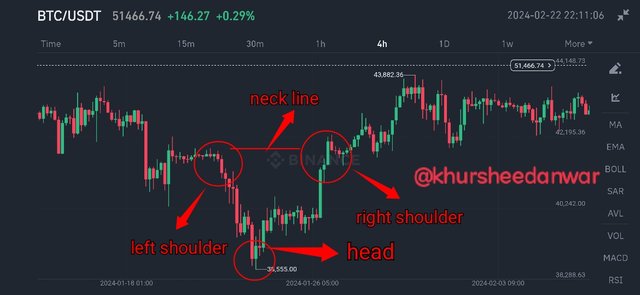
This is I am sharing the screenshot of BTC/USDT chart for explaining shoulder head shoulder pattern.
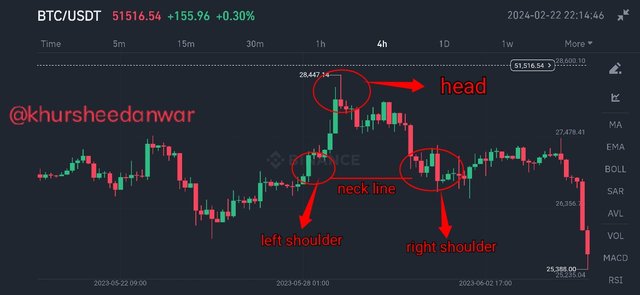
In the screenshot there are three peaks very visible. You can see and I have also mark that there is a middle which is highest and there are two peaks on the sides of middle peak. I have also marked them in the screenshot that how the two sides are forming the neckline and when the price breaks below the necklines then it would be the indication of potential reversal and start of a down trend.
So by the use of shoulder head shoulder pattern investors can take the more justified and suitable decisions for earning their potential profits and preventing their self from any kind of loss in their future related to any cryptocurrency.
Again this is another method that we use in technical analysis and it is inverse Head and shoulder pattern and it is the just opposite of the first factory I have explained all ready which is the regular head and shoulder pattern and inverse Head and shoulder pattern is indication of something good and bullish reversal trend and it typically forms at the bottom or end of down trend so it shows that there is a potential trend reversal on upside.
When we see in the inverse head and shoulder patterns then we are able to see three distinct trough on the price chart and the trough which would be present in the middle would be regarded as head and it would be the lowest point while the other two troughs that would be present on sides of the middle one are regarded as shoulders. Again at the level of shoulders there would be the formation of neckline as I have explained it in the question number 2.
This is I have shared as screenshot of chat for showing you about inverse Head and shoulder patterns.
It is very understood to all of you to see the screenshots that you can see three troughs in which the middle one is lowest and the side ones are at similar level and our helping in the formation of neckline and now for analysis when the price would break above the neckline then it would be the indication of potential reversal and start of uptrend.
Again just like before I want to remind that when the use other Strategies and other technical analysis tools and strategies along with this then it helps in the minimization of the risk management and gives more authentic results for making the correct decisions about any kind of investment if someone want to make.
When I talk about my personal opinion regarding technical analysis of the cryptocurrency and especially the technical analysis of STEEM then chart patterns should be used definitely because it would give us we will representations of rice movements at chart about the potential future price movements of STEEM so I would definitely prefer it.
STEEM price actions over a specified period of time could be formed by the chart patterns and they would be very helpful for traders and analyst for the identification of potential friends reversals, support and resistance levels etc that's why informed decisions would be easy to make.
I am presenting here myself with some of the reasons due to which chart patterns are necessary to analyse the STEEM.
Trend Identification
Through chart patterns trend could be identified so pattrens like ascending triangle ,descending triangle and channels could provide valuable information about STEEM that is it in uptrend,is it in down trend and is it in consolidation phase.
Reversal Signals
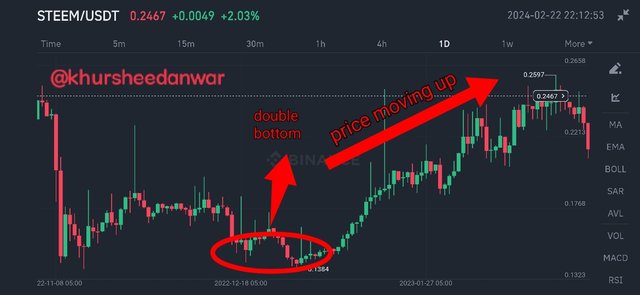
There are some particular charge patterns like double tops and double bottoms which can give us an indication and knowledge about potential trend reversals and these patterns forms if the price of a particular currency fails to break through certain level in multiple times so it shows that there is a shift in the overall market sentiment.
Continuation Patterns
There are different chart patterns like flags and wedges and they shows that there is a temporary break and pause in the prevailing trend before its continuation so if we see these kind of patterns then it would shows that price is consolidating before making its next move in the same direction in which it is present.
Support and Resistance Levels
There are different support and resistance levels also that we can identify by the use of chart patterns and these levels are price levels in which price tend to find it very difficult to move beyond it. There are different patterns by looking in them we can have an understanding about these levels and these patterns are head and shoulder,cup and handle and rectangles.
Volume Confirmation
Volume confirmation is also one of the most important thing that can be judged and analysed by chart patterns. If I given example then I can say that if there is a breakdown from a pattern with high volume then it would be considered more reliable then a breakdown with its low volume.
That is all about my explanation that why for the analyzation of price movements of STEEM chart analysis should be used but along with this I want to see that if we use other technical indicators with in conjunction then it would be more good for making the informed trading decisions.
Now this is where my problem comes in... predicting the future.
Heaven knows, it sounds easy, but I get it wrong time and time again.
Like my husband says, I get too emotional, and to trade, you must keep your emotions out, especially when it comes to predicting future trades.
Thank you for the invitation, and good luck with the contest!
Downvoting a post can decrease pending rewards and make it less visible. Common reasons:
Submit
Haha 😅
Thank you so much for your response and I can understand that many times there are many people who thinks that they are fail in trading and understanding the matters of trading and specially the prediction of price but when we do it again and again then things we comes easier to understand for us.
I invited you and time is very little to participate but I would love to see your participation if you would leave your entry and thanks for wishing me good luck.
Downvoting a post can decrease pending rewards and make it less visible. Common reasons:
Submit
One day I might just surprise you with an entry (•ิ‿•ิ)
Downvoting a post can decrease pending rewards and make it less visible. Common reasons:
Submit
I'm waiting for that day haha 😂
Downvoting a post can decrease pending rewards and make it less visible. Common reasons:
Submit
AsslamuAlikum @khursheedanwar I hope you are well.
You have explained the chartist analysis very well and you have shown very well by marking the head and shoulder in securshort how we apply the head and shoulders patterns in the market.
And you apply head and shoulder in both the bullish or bearish market. It help us more to understand about head and shoulder pattern how we can trade with this pattern and how can we also draw it in market.
You have mentioned that you use chart patterns to trade or analyze the STEM/USDT pair yourself and you also take support resistance levels for extra confirmations or volume confirmations. And the volume confirmations you mentioned that it is very necessary and important.
Best regards [ @danish578]
Downvoting a post can decrease pending rewards and make it less visible. Common reasons:
Submit
Wasalam
Thank you so much for one of the most suitable comment at my post and for analysing and understanding about artist analysis which I have explained in my best way and I tried my best to explain shoulder head shoulder patterns as well as inverse of it also through proper explanations of my chart...
I would like to visit your entry also I wish you good luck in advance
Downvoting a post can decrease pending rewards and make it less visible. Common reasons:
Submit
Thank you for your kind words I'm glad you found my comment appropriate and it matches up with your analysis. I appreciate your effort to explain the Shoulder Head Shoulder patterns and their reversals in detail through your charts. I'd love for you to check out my entry as well. Wishing you the best of luck also.
Downvoting a post can decrease pending rewards and make it less visible. Common reasons:
Submit
Greetings friend,
I get what you're saying. Chart patterns are super important because they can help us predict where the price of a cryptocurrency might be headed in the future. Like, if we see a bullish pattern, it means the price could go up, but if there's a bearish trend, it means the price might go down. It's like a roadmap for traders and investors to decide when to buy or sell a particular cryptocurrency.
And you're right, chart patterns can be really helpful in assessing the risks involved in investing in cryptocurrencies. They give traders and investors the information they need to make informed decisions about whether to invest in a specific project or cryptocurrency.
But hey, let's not forget that chart patterns aren't foolproof. They don't guarantee the future of a cryptocurrency. That's why it's important to combine chart analysis with other technical tools to get a better understanding of the cryptocurrency's future.
So, chart patterns are like a piece of the puzzle, but it's always good to look at the bigger picture. All the best in the contest.
Downvoting a post can decrease pending rewards and make it less visible. Common reasons:
Submit
Greetings to you also!
Thank you so much for giving a comprehensive understanding of chartist analysis. I am very happy that you understand that shoulder head shoulder pattern is an indication of bullish trend and inverse head shoulder is an indication of a pattern which tells us about bearish trend.
Agree with you that chart patterns are definitely not something which gives us guarantee about the future price predictions of a particular cryptocurrencies that's why it is important to keep in mind and to prepare yourself for every kind of situation in the future because charts are just like analysis based on the knowledge.
Thank you so much for wishing me good luck
Downvoting a post can decrease pending rewards and make it less visible. Common reasons:
Submit
Upvoted. Thank You for sending some of your rewards to @null. It will make Steem stronger.
Downvoting a post can decrease pending rewards and make it less visible. Common reasons:
Submit
Thanks for your support 😊
Downvoting a post can decrease pending rewards and make it less visible. Common reasons:
Submit
TEAM 1
Congratulations! This post has been upvoted through steemcurator04. We support quality posts , good comments anywhere and any tags.Downvoting a post can decrease pending rewards and make it less visible. Common reasons:
Submit
Thank you @o1eh
Downvoting a post can decrease pending rewards and make it less visible. Common reasons:
Submit
Thank you @o1eh
Downvoting a post can decrease pending rewards and make it less visible. Common reasons:
Submit
I see you have presented each step very nicely. The important thing is that you have to be experienced to get these solders out. There are some patterns that are very easy to recognize and sometimes become very difficult. Thank you so much for sharing.
Downvoting a post can decrease pending rewards and make it less visible. Common reasons:
Submit
Thanks for being here at my post and this is very interesting to know that you really understand my analysis as well as you get valuable information and you gain a lot of knowledge from the patterns that I tried my best to explain.
It was my pleasure to share my publication
Downvoting a post can decrease pending rewards and make it less visible. Common reasons:
Submit
😊🇧🇩
Downvoting a post can decrease pending rewards and make it less visible. Common reasons:
Submit
Well my dear friend you have write a really good and detailed post I always admire your post and you have wrote in so much detail and very clear and concise definition through the point very easy to understand and the use of a chart is really very important initially for me it was very difficult to show short and how to graphically present because I am not doing any business.
So when there is you know use of a chart I think one indicator is not very helpful there is a combination of that's why we use the combination
Downvoting a post can decrease pending rewards and make it less visible. Common reasons:
Submit
Thank you so much that you consider my writing one of the most comprehensive and explanation and it is a lot of honour for me the way in which you are praising my content.
I am very happy that you gain a lot of understanding from the charts I have explain about different trends and patterns and not only this you also like my theiratical information and I also agree with you that with these charts it is important to combine any other indicator for best results.
Downvoting a post can decrease pending rewards and make it less visible. Common reasons:
Submit
Your right somehow very difficult to interpret charts and its explanation thanks
Downvoting a post can decrease pending rewards and make it less visible. Common reasons:
Submit
Thanks for responding back 😌
Downvoting a post can decrease pending rewards and make it less visible. Common reasons:
Submit
Aw 💞
Downvoting a post can decrease pending rewards and make it less visible. Common reasons:
Submit
Assalamualaikum Your detailed explanation of chartist analysis is impressive! Its great that you highlighted the importance of chart patterns in predicting future price movements and your inclusion of screenshots for shoulder-head-shoulder and inverse head and shoulders patterns adds clarity. Your insights into the technical analysis of STEEM and the use of chart patterns for trend identification reversal signals continuation patterns and support/resistance levels are well explained. Best of luck
Downvoting a post can decrease pending rewards and make it less visible. Common reasons:
Submit
Wasalam
I am happy that my detailed explanation of chartist analysis is very impressive for you as well as I agree that these are the patterns that are very easy to understand and important for analysing the price of future but this is not something about which we can guarantee because analysis just like probability that it could be but with no with 100% guarantee.
Thanks for wishing me best of luck. Your comment really encourage me
Thanks for stopping by at my post 😀
Downvoting a post can decrease pending rewards and make it less visible. Common reasons:
Submit
You have clearly explained what chartist pattern is and how it helps traders to make informed trading decisions.
The head and shoulder pattern is always unique. It works almost everytime it appears on the chart.No wonder it is the toast of many traders
You have written well my brother. Wishing you the best in this contest.
Downvoting a post can decrease pending rewards and make it less visible. Common reasons:
Submit
Thanks for your comment ☺️
Sis I am very happy and satisfied that you clearly understand about Chartist-analysis through my post and you also know the importance of these charts when you are going to make any decision related to trading.
Thanks for wishing me Good luck in this contest it means a lot to me...
Downvoting a post can decrease pending rewards and make it less visible. Common reasons:
Submit
Dear friend you really appreciate such quality articles on this platform after going through your post I can now proudly beat my chest and say I am wearing formed and knowledgeable when it comes to head and shoulder technique in analyzing crypto movement over a period of time. I must see you have really done a good job and such good job has higher chances of taking you fa and wide in no distance time.
Thanks for sharing wishing you success please engage on my entry too thanks
https://steemit.com/hive-108451/@starrchris/steemit-crypto-academy-contest-s15w6-chartist-analysis
Downvoting a post can decrease pending rewards and make it less visible. Common reasons:
Submit
Thank you for leaving a comment at my post.Its very encouraging what you are saying about my personal knowledge in chartist analysis.
Thanks for your encouragement ☺️
Downvoting a post can decrease pending rewards and make it less visible. Common reasons:
Submit