
When I talk about trading cryptocurrencies then for analysing trends in price that crossing and Golden crossing are the most familiar and important terms which are used. When I talk about their dependence then it depends upon the moving average is and it is calculated by taking the average of different or particular cryptocurrencies over a specific period of time.
Golden crossing is defined as positive signal in which moving averages which are shorter term process over the averages which are longer term.For the identification of this crossing,traders always look for the 50 day moving average and 200 day moving average which are shorter term moving average and long term moving average respectively.If 50 day moving average is crossing the 200 day moving average then it is an indication that price would move most probably towards upward trend as well as Golden crossing is also seen as a positive sign because it opens the opportunities of buying a particular cryptocurrencies by traders and investors.

Death crossing is a negative signal and this signal appears when short term moving averages are crossing below those moving averages that are long term. Again I am saying that for the identification of death crossing also 50 day and 200 day moving average is used by traders.Death crossing gives warning to traders in advance that there could be increase in selling opportunity in future and could be promotion of bearish trend.
Golden crossing and death crossing both are very important for letting us know about the cryptocurrencies in overall market and these are important because these are signals that are used for making technical analysis so that traders may make decisions about trading.
I have already talked that golden crossover is a positive signal for all traders because it indicates that buying pressure is going to increase and death crossing is a negative signal because it indicates that selling pressure is going to increase so it is a negative thing for traders and overall market.

I am going to explain and show you guys Golden crossover and death crossover at different charts which are BTC/USDT and STEEM/USDT charts. For understanding the chart first of all the reason I need to understand about a curve which explains about moving average in a specific period of time and this curve is EMA so as we know that Golden crossover and death crossover is determined by moving averages that's why EMA is very significant because it explain about moving average. We can choose moving average of any day and it all depends upon the analysis of days that will want to make so here I am just showing you randomly by keeping in mind 50 days and 200 days of short time and long term moving average to let you explain about golden crossover and death crossover.
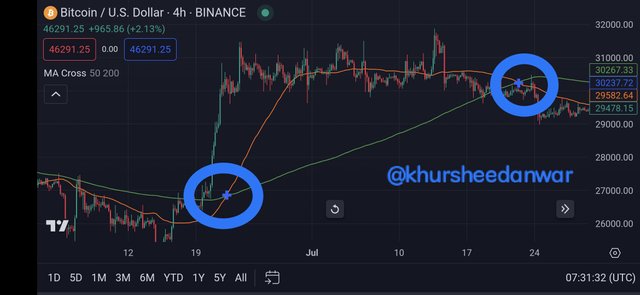
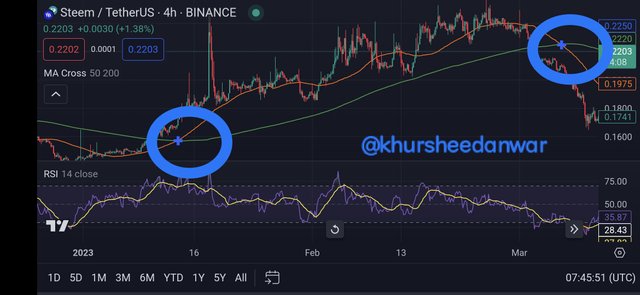
You can see in the above chart that during the golden crossover how short term moving average is crossing above the long term moving average is so here 50 day moving average is crossing above the 200 days moving average so it is the creation of buying opportunity and it is a positive thing.
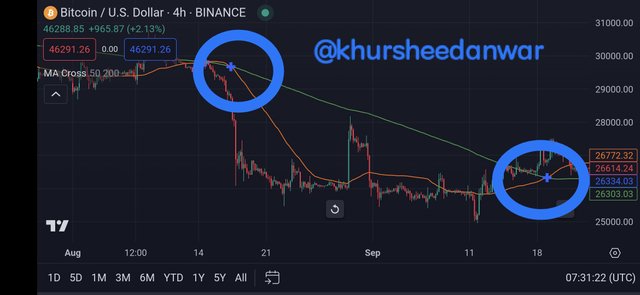
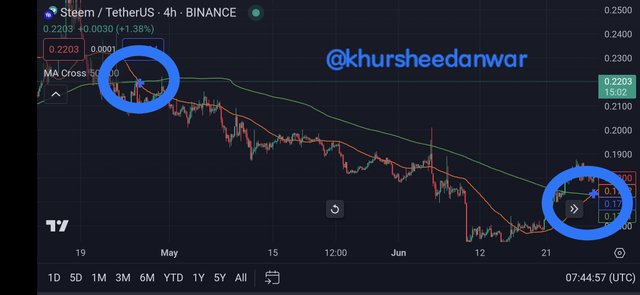
Similarly if again I talk about the above chart then you can see that during the death crossover short term moving average is going to cross below than long term moving average so 50 days moving average is crossing below than 200 days moving average so it is showing that selling pressure may increase so it is just like warning for traders and it is a negative sign due to increase in selling pressure it is causing price decline.
Some of the key differences between Golden crossover over and death crossover I am going to explain here.
Golden Crossing
- Golden crossover is a green signal and positive signal which is an indication that price of particular cryptocurrency is going to increase.
- In Golden crossover as buying pressure increase thats why when more and more people buy cryptocurrency and its demand increase then eventually it pumps the price.
- In Golden crossover short term moving average pass from top of the long term moving average which are of 50 days and 200 days respectively.
- Golden crossover is positive for traders and investors for their personal gains because in that times they can buy particular cryptocurrency in high ratio and then they can sell it for making reasonable profits.
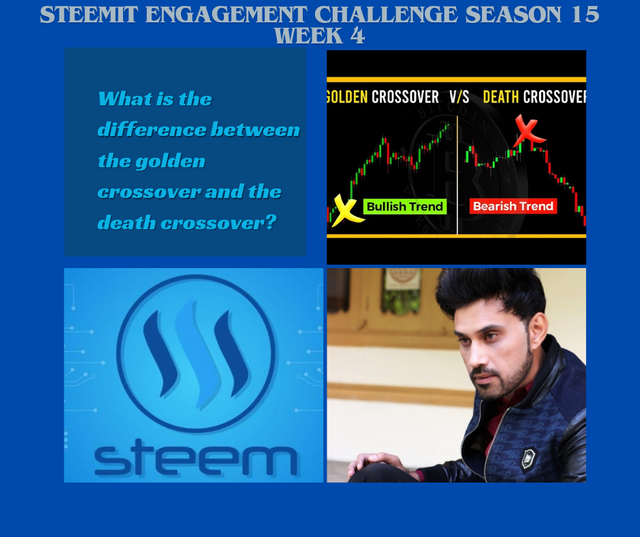
Death Crossing
Death crossover is a red signal and a negative signal which is an indication that price of a particular cryptocurrency is going to decrease and decline.
In death crossover selling pressure increase as more and more people tend to sell their assets so it's supply increase in this way and demand suppress that's why it cause a decline of large extent in overall market.
In death crossover short term moving average cross below than long term moving average which are of 50 days and 200 days respectively.
- In death crossover it gives harm and warning to traders that selling pressure is increasing so it is showing bearish signal in market that can be for more time so future safety measures are important for keep in mind for preventing their self from loss of high extent.
Yes I know some other indicators that I would add to make my technical analysis more effective at the moment of taking an decision.
| 1 | Relative Strength Index (RSI) | Relative strength index is an indicator that is just like a momentum oscillator and it is used in the measurement that with how much speed price of a particular cryptocurrency is changing and it also let us know about buying and selling conditions about a particular currency so it in this way let us know about trends that if buying pressure is increasing then it is positive trend and if selling pressure is increasing then it is negative trend. |
|---|
| 2 | Moving Average Convergence Divergence (MACD) | Moving average convergence divergence is an indicator which clears an understanding about the relationship between two moving averages of a particular cryptocurrency so it let us identify that according to the convergence and divergence of moving averages what is the trend, either it is about buying or it is about selling so it is a trend following indicator you can say. |
|---|
| 3 | Bollinger Bands | Bollinger band is another indicator which contains simple moving average and standard deviations that are plotted above and below these moving average and these standard deviations are two in number and price that how much there are fluctuations in the price of particular cryptocurrency by the use of Bollinger bands.If price is moving closer to upper band then it is an indication of buying and if price is moving closer towards lower band then it is an indication of selling in market. |
|---|
| 4 | Fibonacci Retracement | Fibonacci retracements are another indicators which are horizontal lines and understanding of it and getting involve in it can let you know about support and resistance levels depending upon the sequence of Fibonacci so for the identification of potential reversals in price it becomes very helpful for traders and investors to use this indicator for making informed decisions. |
|---|

| 5 | Volume Analysis | Volume analysis is also an indicator and it is shown through the term that is for analysing trading volume of a particular cryptocurrency and if trading volume of a particular cryptocurrency is high then it means that it is in high demand and it has strength in market and vice versa. |
|---|
These were some of the most significant and most commonly used indicators that traders and investors can use by keeping in mind other factors also for making any kind of decision related to investing in a particular cryptocurrencies so hopefully these indicators are understandable for all of you.
Upvoted. Thank You for sending some of your rewards to @null. It will make Steem stronger.
Downvoting a post can decrease pending rewards and make it less visible. Common reasons:
Submit
Thank you 👍
Downvoting a post can decrease pending rewards and make it less visible. Common reasons:
Submit
Greetings Friend,
You really did a deep dive into the topic, examining the Death cross and Golden cross patterns with great detail. Your explanation of the different crossings and the charts for BTC/USDT and STEEM/USDT was on point. It's understandable that identifying the bullish or bearish trend on the STEEM/USDT chart can be a challenge. You also highlighted the contrasts between the death cross and golden cross patterns, which is important to understand. Incorporating the RSI indicator was a clever move, and it's awesome that you gave a brief explanation of it. Based on what you shared, it seems like the STEEM/USDT chart is indicating a death cross and a bearish trend. Overall, you did an excellent job answering each question and demonstrating your expertise. Keep up the fantastic work.
Downvoting a post can decrease pending rewards and make it less visible. Common reasons:
Submit
Greetings to you too ☺️
I am happy that you leave your response at my post as well as I agree with you that I try my best to examine the topic in detail about death cross over and Golden crossover. When I talk about my explanation about both type of charts then I tried my best to make it clarify that where there is Golden cross and where there is death cross going on because you can understand both of them practically more as well as agree with you that Golden crossover is bullish trend indication and death cross over is bearish trend indication.
I am happy that you like each and every point explain by me and thank you so much for wishing me such kind of good words and definitely I would try to improve my skills more and keep up my fantastic work.
Downvoting a post can decrease pending rewards and make it less visible. Common reasons:
Submit
Hello friend
Great to see you entry with such amazing writeup. You clearly defined what golden cross and death cross is all about. It was clear that even a layman can understand it.
You used btc/usdt chart to explain golden cross while steem/usdt was used to explain death. They were very clear.
The various indicators you mentioned can be very useful and prove to be a perfect combination for the two chart patterns.
Thank you for the insightful writeup.
Downvoting a post can decrease pending rewards and make it less visible. Common reasons:
Submit
Thank you so much for your beautiful response at my post as well as I agree with you that I clearify some of the differences in between both the terminologies that are very important in making the technical analysis and which are the golden cross and death crossover.
I agree with you that as analysis and charts is everything all about practical that's why it gives a mole clear understanding of your concepts and I tried the same to do for all of you as well as various indicators that I have mentioned you also find then very helpful while making your analysis more stronger and it was my joy to share my analysis with you
Downvoting a post can decrease pending rewards and make it less visible. Common reasons:
Submit
The comparison of a "green signal" makes it more practical for us, providing a clear understanding that this cross signals an anticipated rise in the cryptocurrency's price. I would say that this straightforward explanation enhances the overall comprehension of the golden crossover for both new and experienced traders.
By equating RS to a "momentum oscillator" and clarifying its role in measuring the speed of price changes, you have made this technical indicator more digestible for a wider audience. This simplification helps us in grasping the significance of RSI in assessing cryptocurrency price dynamics, enhancing their overall understanding of technical analysis. So it's use along with GC and DC would definitely should palatable trade outcomes .
Good luck
Downvoting a post can decrease pending rewards and make it less visible. Common reasons:
Submit
This is one of the most wonderful way to comment on post that you I like some of the points from my post that you really like and then you talk about all of them so when I talk about the comparison between both type of terminologies that are golden cross over and death crossover then I agree with you that these are the indication of green and red signal means this are the invitation of something positive and negative respectively and I am happy that you understand this concept clearly.
Secondly when I talk about momentum oscillator then it is an indicator as I have explained in my post in detail about it that what is the second name of this indicator and for which purpose it is used for making the technical analysis more stronger and you can use this indicated with conjunction of death crossover and Golden crossover as well as with other indicator so that you may receive more good results of your analysis and thank you so much for wishing me good luck
Downvoting a post can decrease pending rewards and make it less visible. Common reasons:
Submit
El cruce dorado es una señal de la tendencia alcista que prosigue al cruce y el cruce de la muerte es una señal de la tendencia bajista que prosigue al cruce.
Lo importante es corroborar el análisis con otros indicadores como lo mencionaste: RSI, MACD, BB y Retroceso de Fibonacci. Es necesario estar pendiente de los factores externos o el entorno de noticias relevantes y otras que afectan el sentimiento del mercado y que pueden echar por tierra cualquier análisis técnico.
Gracias por compartir, saludos y éxitos.
Downvoting a post can decrease pending rewards and make it less visible. Common reasons:
Submit
Thank you so much for commenting at my post and I tried my best to explain the differences between both of them you are right that I going to the depth of topic as well as you are right about some indicators that you are mentioning and yes all these indicators are very helpful in making the technical analysis most stronger because many times when you don't have good indicators then you mostly make wrong decisions so for the purpose of making inform me decisions it is better to use many of the characters in conjunction so that you may find out that true results
Downvoting a post can decrease pending rewards and make it less visible. Common reasons:
Submit
Saludos y bendiciones.
Downvoting a post can decrease pending rewards and make it less visible. Common reasons:
Submit
Hello how are you
You always wrote in so much detail and in the depth of analysis.
I was shocked to see how deep analysis you have given about differences and that's completing your post.
Keep up the good work
Best of luck
Downvoting a post can decrease pending rewards and make it less visible. Common reasons:
Submit
Thank you so much for one of your most wonderful comment and it make me very happy because you consider that my analysis is very dipper and you are shocked about analysis that I made through charts and there is no need to be shocking on it because you can also made same analysis like me and just there is a need to focus.
Thank you so much for advising me to work hard and for wishing me good luck
Downvoting a post can decrease pending rewards and make it less visible. Common reasons:
Submit
Your Welcome Stay blessed 😇😇😇
Downvoting a post can decrease pending rewards and make it less visible. Common reasons:
Submit
Your post has been successfully curated by @𝐢𝐫𝐚𝐰𝐚𝐧𝐝𝐞𝐝𝐲 at 35%.
Thanks for setting your post to 25% for @null.
We invite you to continue publishing quality content. In this way you could have the option of being selected in the weekly Top of our curation team.
Downvoting a post can decrease pending rewards and make it less visible. Common reasons:
Submit
Thanks @irawandedy for kind support 😊
Downvoting a post can decrease pending rewards and make it less visible. Common reasons:
Submit