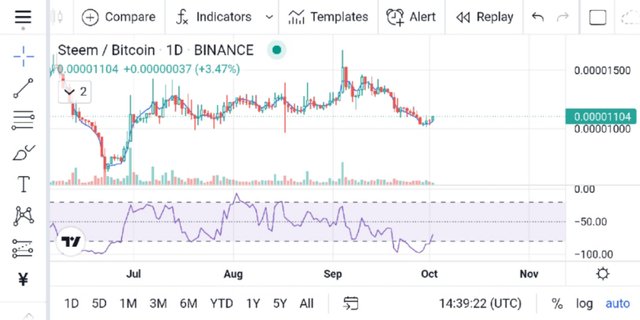
EXPLAIN LEADING AND LAGGING INDICATORS IN DETAIL. ALSO GIVE EXAMPLES OF EACH OF THEM.
Leading Indicator can be defined as an indicator that provides signals before new trend or a reversal in price movement occurs, using a leading Indicator you are bound to making profit, one major thing about leading Indicator is that it measures Overbought and oversold, so many traders usually ask when is it time for me to buy or sell. After I'm done with my immense explanations trust me that question will be surely addressed.
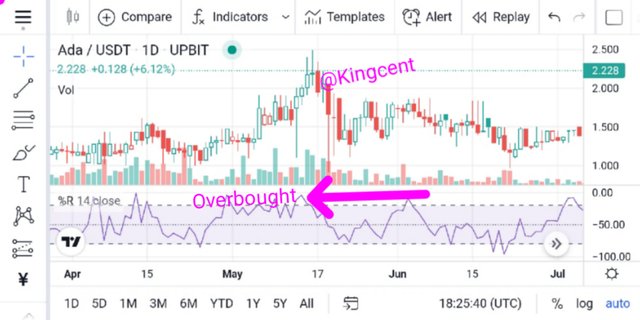
When price is spotted you find out that anything can happen moving forward there will surely be breakouts and false signals,price can remain in each region for a long time without making a reversal, for example price can remain in overbought region for a long time before making a twist let's view this chart below.
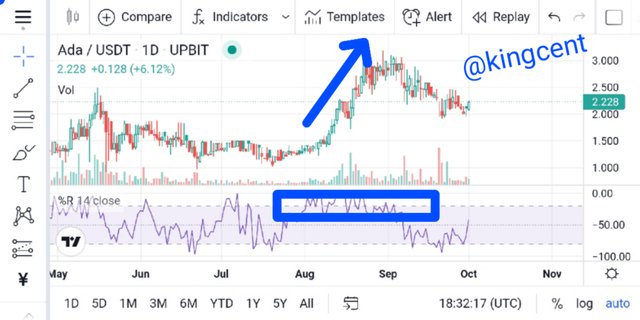
From the chart above you find out that price ranges in an Overbought region for a long time before making a twist, using a part of ADA/USDT I was able to spot it up, I'm currently using the Williams %R Indicator, remember there are over 100 various Indicators that you can make use of for price confirmation.
Leading Indicator receives traders alot you can easily be received as a result of fake breakouts, and false signals there is always manipulation courtesy price actions, leading Indicator is pretty good to be employed in a sideways Market where price movement seems to be in equilibrium.
Lagging Indicator: this type of Indicator seems to be the opposite of leading Indicator as it provides signals after trends has officially started, you can get good lagging Indicator when price movement appears been on a long trend, it clearly illustrates what price is up to, it can be bullish or bearish.
Using lagging Indicator on a sideway market for me isn't ideal, since its motivation is giving signals after change of price has officially anticipated thereby forming a trend.
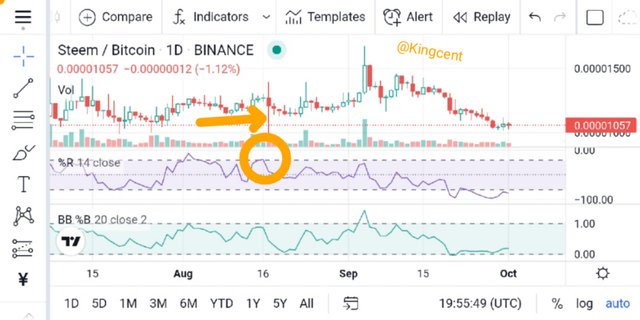
From the chart uploaded the pair is STEEM/BTC, you will understand that trend has already started, trend has approached the -80, and -100 reference line making it overbought, the market is trying to buy down, from there you can easily take a buy down, and thus indicate your take profit zone.
WITH RELEVANT SCREENSHOTS FROM YOUR CHART, GIVE A TECHNICAL EXPLANATION OF THE MARKET REACTION ON ANY OF THE EXAMPLES GIVEN IN QUESTION 1a. Do THIS FOR BOTH LEADING AND LAGGING INDICATORS.
Since leading Indicator provides signals before a new trend occurs or any form a reversal comes to fruition, this will be tied down to the structure that is about to be retested, price can form a higher high, or a lower low, what you need do is to draw your trend-line, price can continue in Overbought phase for a long time without breaking the reference line or the trend line.

Looking at the chart ADA/USDT, you will see that price continued in an uptrend, but in an Overbought phase, although there has been breakout and false signals that showcased at some point, as the market got to a higher high it has to make a U-turn and formed a downtrend trying to form an M-formation.
From the chart you find out that price ranged in an Overbought, position for a long time that is been at -80, and -100 respectively from Williams %R, we regard it as Overbought. Remember you don't buy at the Overbought region instead you wait for price to cross below -20 reference line from the oscillator before making your buy and by so doing Indicate your take-profit very important.

From the chart above you will agree with me that trend has already started, what you need to do is to conduct your technical Analysis to know what next will happen to price, for me at this phase I won't make a buy yet untill price crosses below the third oscillator line which is -20, given a strong support, then I can make my buy upward.
WHAT ARE THE FACTORS TO CONSIDER WHEN USING AN INDICATOR?
History of an indicator:history of an indicator is very important, knowing who and when the Indicator came to lime-light, is very important how the Indicator has faired over a long run this factor determines the efficacy of that particular Indicator and the ability for it to deliver.
Popularity of an indicator; there are some Indicators today that seems very popular, even if you joined the trading world today it will be the first Indicator that you will be thought, like the RSI, the ichimoku, MACD etc their popularity depends on their performance over the long run ever since their inception so people see then as the best.
Momentum of an indicator; not all Indicator has the speed to detect the direction of the overall trend, that's why in forex Market we usually make use of the MACD, it gives answer to that, so the speed of an indicator matters alot and you should consider it alot.
You don't just use any Indicator to confirm price movements, you should study the Indicator very well and finalize if it suites your trading strategy, by doing so you consider it's momentum/speed.
Explain confluence in cryptocurrency trading. Pick a cryptocurrency pair of your choice and analyze the crypto pair using a confluence of any technical indicator and other technical analysis tools. (Screenshot of your chart is required ).
Confluence trading can be defined as a point where multiple Indicators are combined to confirm price movements, by so doing you increase the velocity to make massive income from the volatile Market, when you combine various Indicators they give you the same reading by so doing you can easily know when to buy or sell.
Confluence trading helps you to determine strong support or resistance level in the market, that's why our people usually say two heads are better than one, a phase in the volatile Market where multiple key structures comes together to form a point where entry and exit points are been spotted.
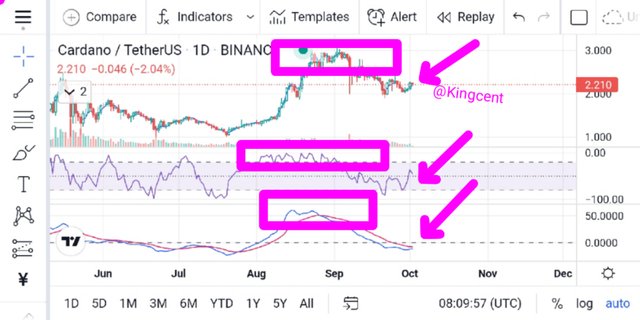
The chart above involves ADA/USDT, which means for you to buy ADA, you must have USDT, the movements in the chart above is quiet remarkable, price revolved round the Overbought zone for a long time forming a strong resistance. the three Indicator used corresponded to it. From the chart there are three various confluence of Indicators.
Looking at the Support level it forms a very good buy, you can enter a buy entry and buy the market to the resistance level, looking at the previous formations you will understand that the market is capable of forming a W-formation, the highest level it will retest is the resistance level, while the lowest level is the Support level.
EXPLAIN HOW YOU CAN FILTER FALSE SIGNALS FROM an INDICATORS
False signals is inevitable as far as cryptocurrency trading is concerned, false signal is seen as a breakout in price movement, whenever price is trying to form a higher high, or a lower low, you can find a breakout along the process to distort whatever highs or lows officially wants to occur, let's view this chart below.
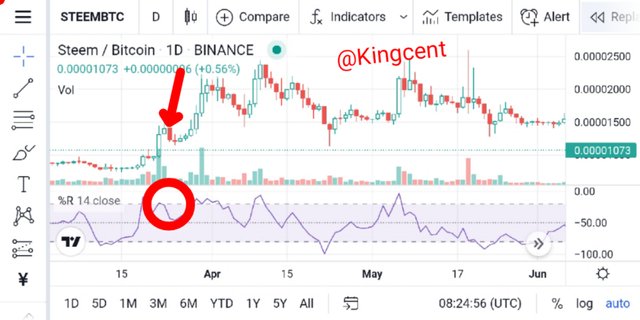
One thing we should understand is that false signals doesn't happen only when price is at bullish phase, it happens whenever price is at bearish or at bullish phase, From the pair above STEEM/BTC, pair price is climaxing at a Bullish phase untill a red candle-stick formed which is a sign of a reversal in price movement.
At this point some traders will be afraid that price might go down, they might decide to take little profit and exit the market, but for me I will hold on for a while to see what will transpare as price keeps moving forward. Using an Indicator is very important as you can easily filter false signals easily.
EXPLAIN YOUR UNDERSTANDING OF DIVERGENCES AND HOW THEY CAN HELP IN MAKING A GOOD TRADING DECISIONS.
Divergence is practically a technical analysis it shows various trend reversals, it also help to identify false signals. At this time you can say divergence is refered to a point where price moves either way practically in an opposite directions, it can be viewed in an oscillator.
When price and the oscillator moves in various directions for example price is moving up while the is oscillator moves down, in different directions
Using this to make good trading decision depends on the trader, for me if I enter a market and I'm getting different result I will just wait, if the oscillator isn't corresponding with price movement trust me you are bound to loose money.
When divergence occurs many traders gets confused because it is classified in various phases. In here for me I will wait until price set thereby I will then explore, this is my own trading decision.
USING RELEVANT SCREENSHOTS AND AN INDICATOR OF YOUR CHOICE, EXPLAIN BULLISH AND BEARISH DIVERGENCES ON ANY CRYPTOCURRENCY PAIR.
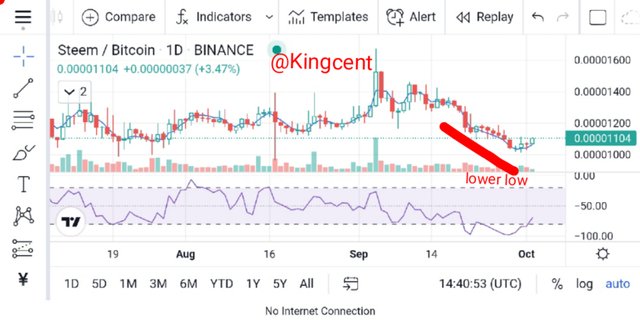
Bullish divergence is seen as a pattern when lower lows are been formed, at this phase the oscillator in use gets to higher lows, when this occurs it indicates that the speed of the market is getting stronger, and price will soon push upwards for example
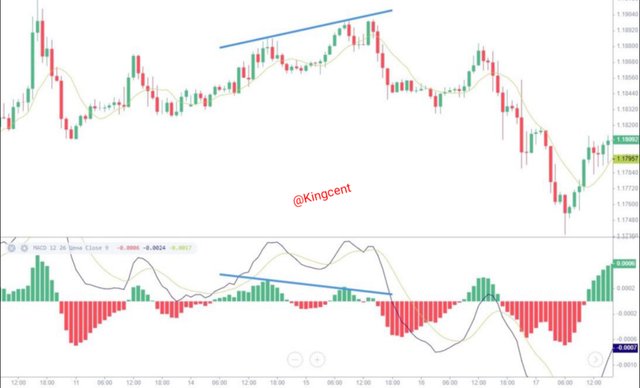
Bearish divergence basically happens whenever price climaxes reaching a higher highs, while the oscillator gets to a lower highs, via the market a bullish phase still occurs, what it indicates is that the speed of price movement is getting week, thus price will go downtrend.
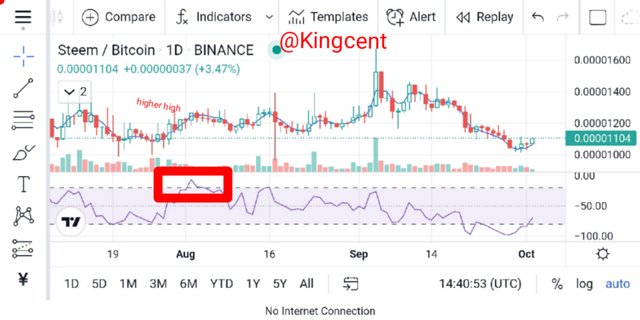
As you can see from the chart after forming higher highs, and the oscillator forming a lower high a potential downtrend occured. We also have a situation when Indicator makes a lower low, or a higher high, but it doesn't reflect on price action this is called a hidden divergence.
CONCLUSION
From my homework post I stated that leading Indicator is a type of Indicator that gives signals before the bigining of new trend occurs, when using a leading Indicator trust me you will make cool profits, you can easily use leading Indicator to measure Overbought and oversold which is very important in order to know when to enter and exit the market.
Lagging Indicator helps to provide trading signals whenever trends have officially started, when price shows to be in a long trend, lagging Indicator shows you what price movement is up to as it can appear been in an uptrend or downtrend. Lagging Indicator can't be used in a sideway market, it isn't ideal I must tell you.
Thank you very much professor @Reminiscence01, you really did well hope I keep reading your lecture once again thank you sir.
Hola amigo felicidades por entender y realizar
sus tareas que se ven complicadas ya que comenzaste sigue adelante, feliz día.
Downvoting a post can decrease pending rewards and make it less visible. Common reasons:
Submit
Hello @kingcent , I’m glad you participated in the 4th week Season 4 of the Beginner’s class at the Steemit Crypto Academy. Your grades in this task are as follows:
Overall, you have produced a wonderful content on the topic. But I'm not satisfied with the chart example you presented on divergence. I suggest you revisit the lesson to understand how to spot divergence properly.
Thank you for participating in this homework task.
Downvoting a post can decrease pending rewards and make it less visible. Common reasons:
Submit