INTRODUCTION
Trading is one of our greatest on-doing in this part of the world, today we can easily logg into various Exchanges and execute our various trades with proper risk management, we all know that trading is all about buying and selling, knowing when to buy, and when to sell.
Trading the volatile Market is very risky, if you didn't carry out appropriate technical analysis before placing your trades you will end up loosing your capitals. That's why we advice traders to minimise their risk, so that in the end they will gain reward.
In trading you need apply basic tools to making sure that your trades comes out successful, you need concise indicators they will interprete, work together, and provide valid report on the trades been executed, at this point we bring you the topic for today Trading with volumes indicator.
Explain the volume indicator in your own words.
In the trading world today volume is very important as it measures a given assets that has traded overtime, when price rises, volumes follows suite, so many other indicators that uses volume data are mostly provided with charts, trading volumes are seen as an indicator that measures Market fluctuations.
It assists you to know the direction of the market at various time frame volume is very important in technical analysis and it's features are splendid in key technical indicators, volume has its way of analysis you need to follow some specific guidelines if you are to get a good overview about the market moves, as a trader all I care for are strong moves paying less attention to weak moves.
some common terminologies used in trading
Trend confirmation
Volume rise together with the market, whenever price increases you see lots of buyers and when they start selling you see that the market will turn bearish thereby indication in the structure of the candle-stick that will form along the process, at this phase buyers needs an increasing enthusiasm in order to accelerate Market to the highest level.
Sometimes price increase and volume decrease, whenever this happens it's mostly triggered by lack of intrest thus reversal could just happen, one thing I know is that price rises and drops, that's why it's called technical analysis you need to conduct your analysis very well to know how the market is going to fair be it rising or falling.
Exhausting moves and volume
When we experience a rise or fall in price in the volatile Market one thing is certain we will see exhaustion moves. This moves are fast moves in volumes, it signifies that there are exhaustion end of trend. So many traders who waited won't like to miss out so they wait at the top, at this phase the total number of buyers will be limited.
At this point checking at the market bottom, there will be fall in price because many traders are at the top and this might result to volatility and increase in volume. Volume increase is inevitable as we will see spike in this situation, further analysis can still be done using other volume guidelines.
Bullish sighs
As a trader you should be able to identify bullish, and bearish signs, now let's say volume increases later decline and makes an increase again as a sensitive member you should know when the volume is in uptrend, or downtrend, remember in most cases prices increases as volume increase too although reversal can still happen along the way shall.
- Note volumes are basically seen as an indicator of liquidity, Market that has Higher volumes are seen as the most liquid, thus seen as the best courtesy short term trading, we have many traders that are willing to trade various prices.
Use a platform other than Tradingview to present the volume indicator on a chart and show how to configure its parameters by justifying your choices. (Screenshot required)
Here I will use binance web to set this up, it's very important it's been included in your chart, as it will assist alot.
Let's get the ball rolling, I gained access to the binance web.
Step1
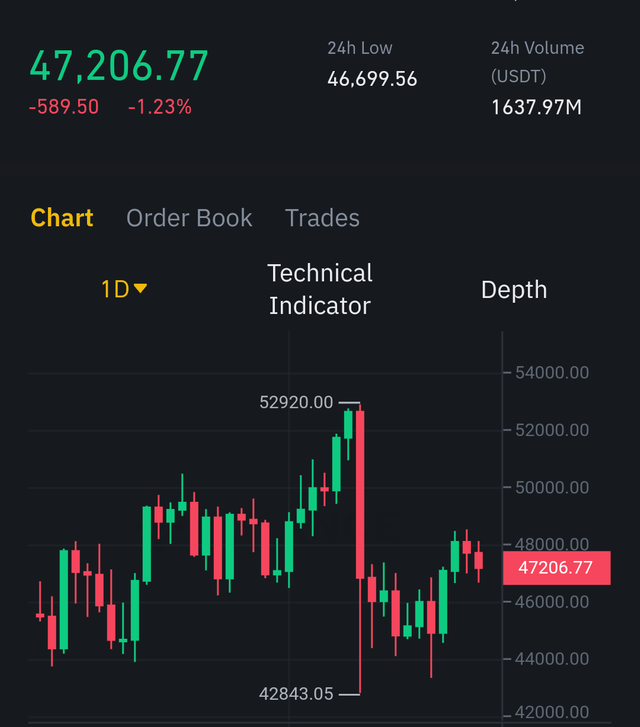
Access the binance web, and click on the technical indicator. This is a chart containing BTC/USDT.
Step2
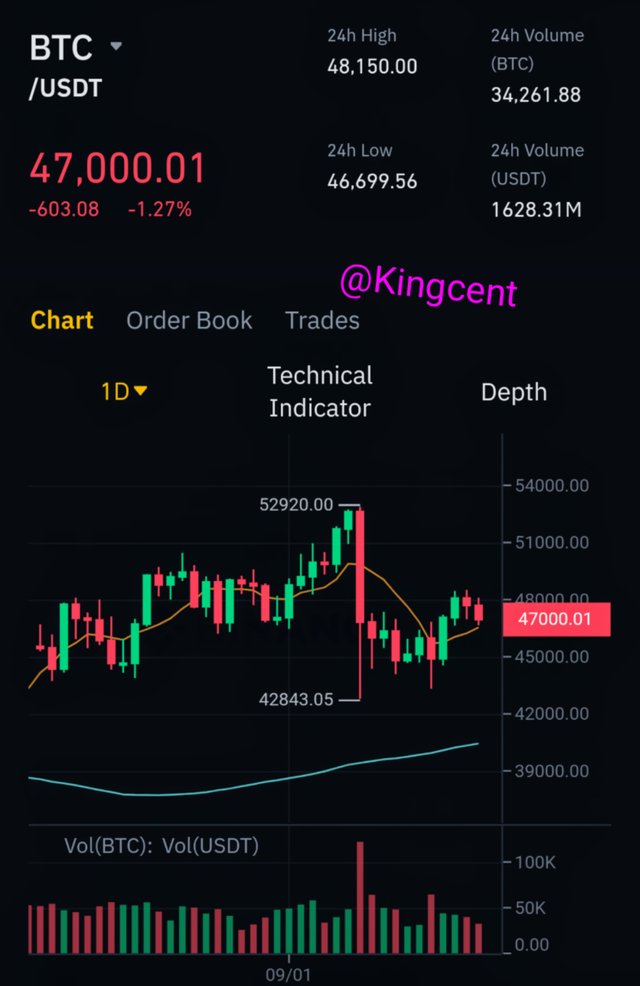
Moving forward thereby scrolling down you will see an axis then click on it volume, and turn It on.
step3
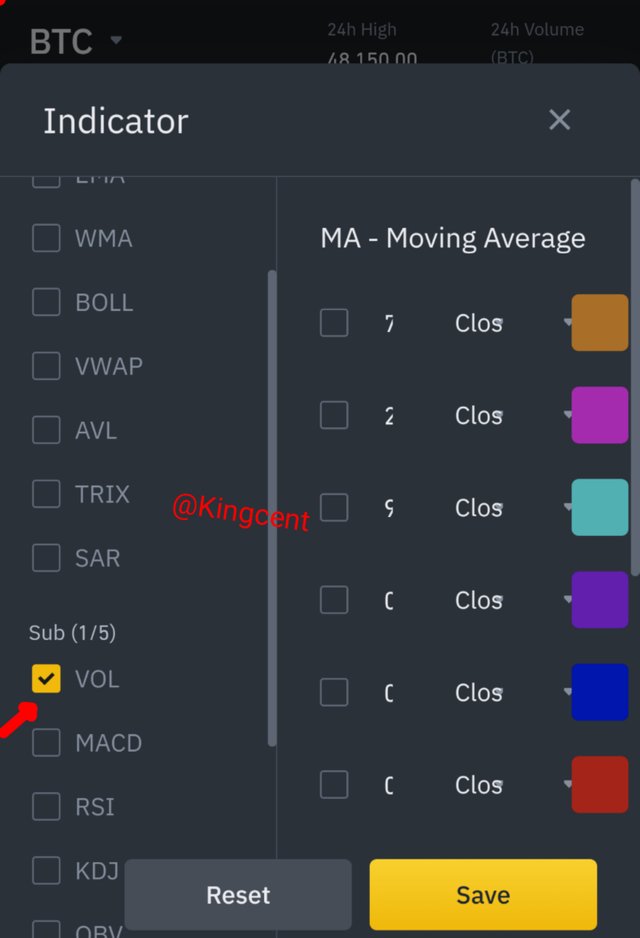
Previously the volume indicator has already been turned on, at this phase you can add your MA=moving average, it will really help in smoothening the velocity of your chart, let's do it together.
step4
I have suceeded in adding the volume next it triggered me to where I will add period 20.
I clicked on it and added 20 period, this will show at the volume part of my chart.
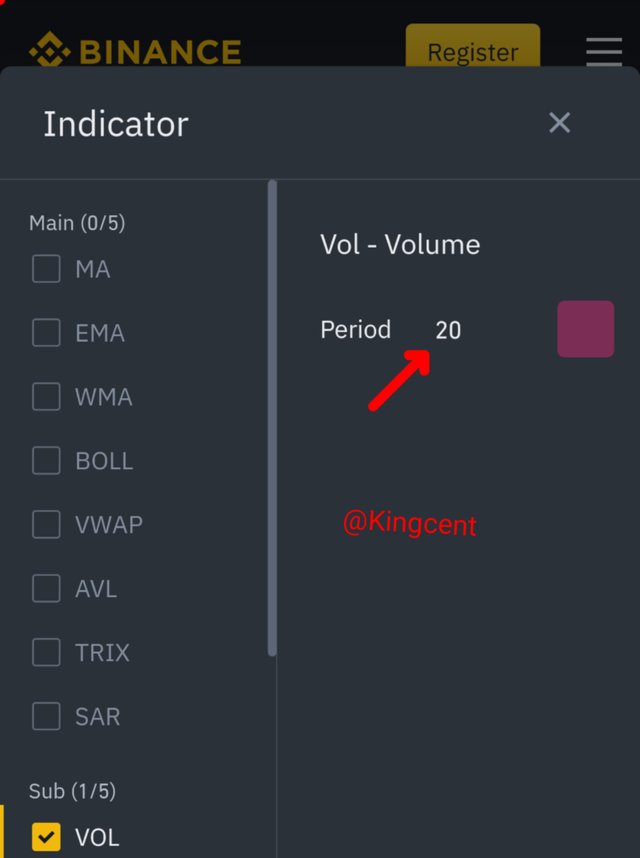
- One important thing here is that you can change the colour which I did view the result it yielded. Below
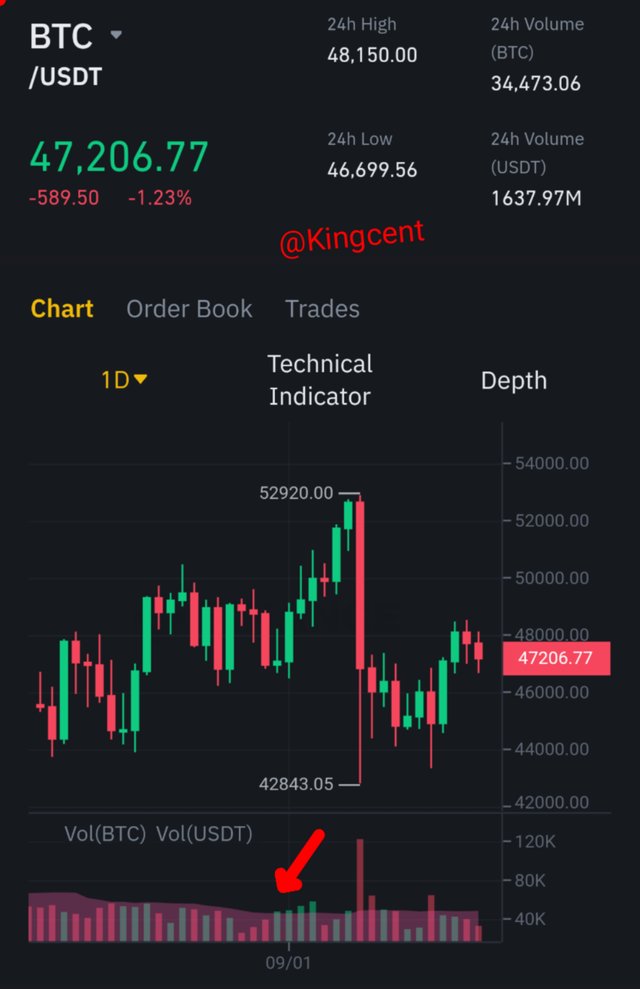
- Here I have successfully added 20 period moving average to my chart. It's very important we know the ratio of any moving average we added and save to a chart, this will lead us to the important of a moving average, or the importance of adding a moving average on chart.
Importance of adding a moving average
Moving average is very important because it comes with statistical concise analysis, you can add 50 moving average, 100 moving average it depends on what you want. But moving average has a basic functionality which is creating a precise series of average values of various sebset of various data presented on chart.
It keeps the viscosity of random outfits and thereby making long term trend to aline accordingly, it's very important you add MA to chart it will surely help you during your all round interpretation of price trend.
What is the link between Volume and Trend and How to use volume to predict a trend reversal? (Screenshot required)
Volume and Trend
Since volume is seen as an indicator used to predict Market fluctuations, I will say volume is used to predict trend, and trend works in conjunction with trend lines. If Market fluctuates it reflects on the volume or when we experience trend reversal, volume and trend are just like brother and sister they work in conjunction with each other.
Taking about how to use volume to predict a trend reversal we have to consider volume with price uptrend, and downtrend.
Volume and price uptrend
When we talk about price uptrend that means there are more buyers than sellers, traders are trying to buy the market to the resistance level, that's why as an experience trader you buy at the Support zone.
You need to monitor your support level very well, so that you will know when to buy, so that you don't overbuy thereby turning your asset to been overbought. I will show a chart here to verify my claims.
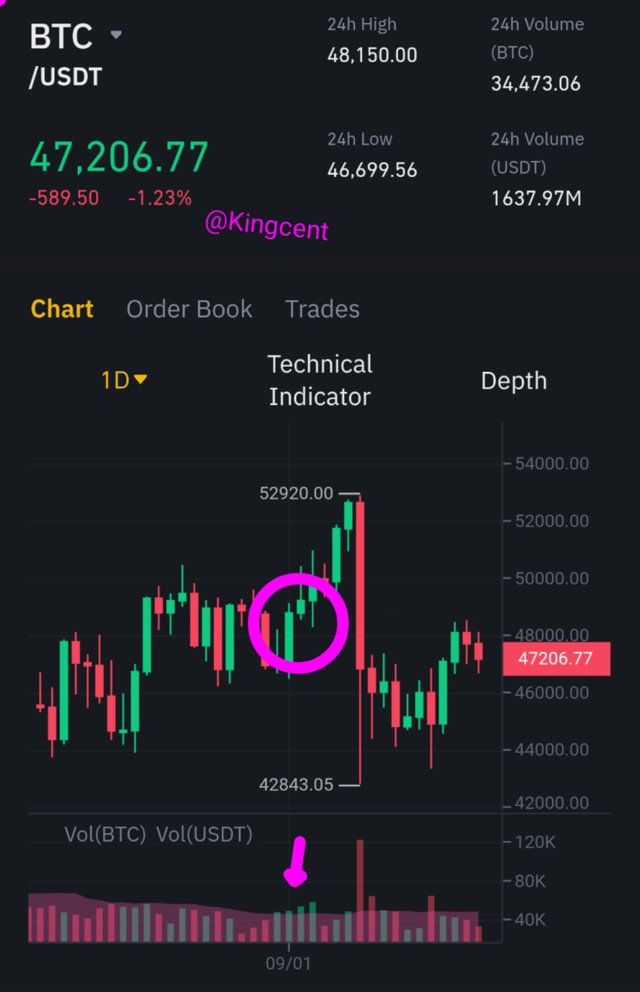
As you can see there are more buyers in the market looking for a way to buy the market up at a fix point where they will take profit, the market is in bullish trend, when it breaks trend reverses, you can now see clearly that price moves as volume moves, the both works together is just like trend lines and trends.
Volumes and price downtrend
Price going downtrends that means there are more sellers in the market than buyers, they are trying to drag the market down, to support level and later it will be dragged up again, volume on downtrend gives buying signals becau the market will be dragged from bearish to bullish.
Be it volume and price downtrend, or otherwise price moves in relationship with volume, another important aspect we need to know is the structure formed whenever this takes place, the structure that intends forming gives you a clear overview about the market future, and it will guide you on what to do next, how to enter the market to be precise. I will show this with a screenshot for proper understand.
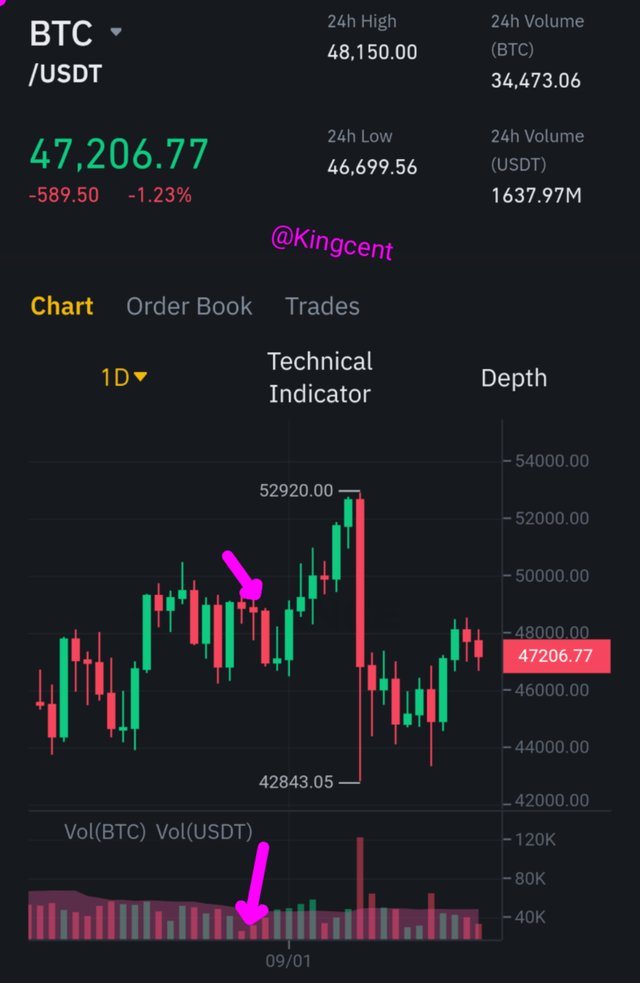
From the chart above you you can see that the price obeyed a structure before forming a bullish trend, price went down restested a structure and went up again, there wasn't any breakout along the process.
Volume and trend reversal (Uptrend)
Traders enters the market whenever there are trends, and if a reversal candle-stick forms some impatient traders May be forced to exit the market and take profit at that spot. Trend reversal is a region in price when price breaks.
Uptrend reversal
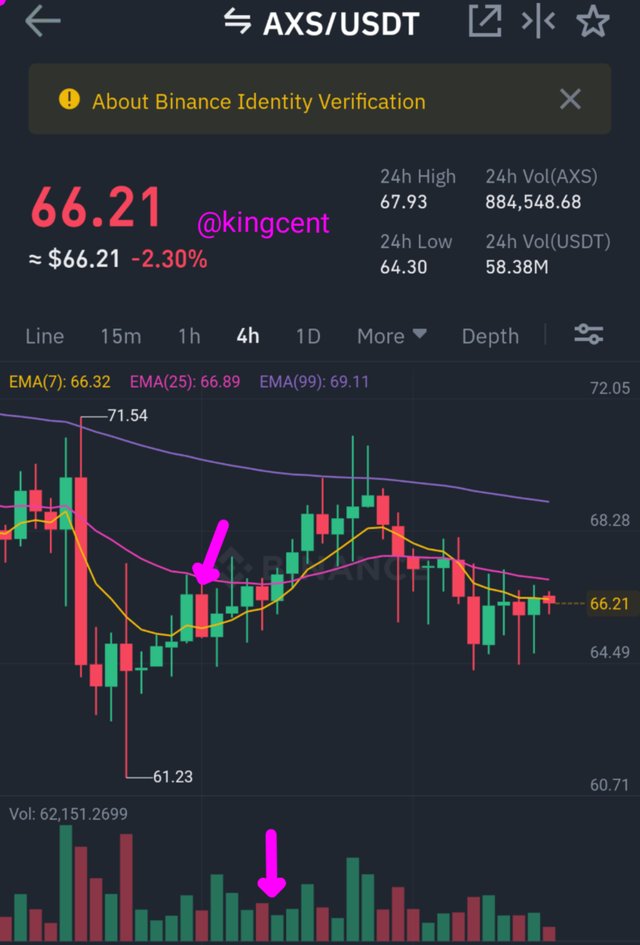
This is an AXS/USDT chart, from the chart price was in an Uptrend, until a breakouts occured, this shows that sellers entered the market briefly, you will know as a result of the next forming candle-stick.
Whenever trend reversal happens I will advice you stay on the market and watch the next structure that is about forming before you can decide on what to do, the price and break and still continue in Uptrend phase.
Volume and trend reversal (downtrend)
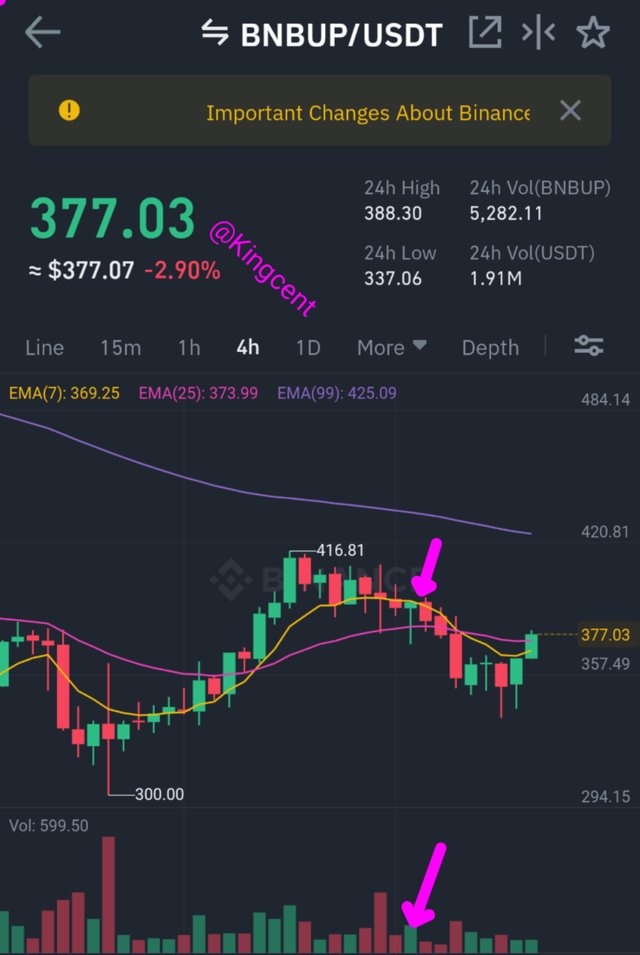
Trend reversal in downtrend occurs when sellers are trying to drag the market and price down to form a valid buy point basically at the Support level, then a reversal candle-stick forms to scare sellers some might think the market might continue in bullish phase.
But it happens most times in trading, the ability to know how to trade trend revers the Advantage for you, it's important we use multiple indicators one trend deserves confirmation as you can see the break/reversal on downtrend quick reflects on the volume axis.
How to use the volume to have a signal confirmation? (Screenshot required)
Volume works together with price trend, it's an indicator that shows the trends in the market so you can thus use it to spot buying and selling signals. I will explain more with the help of a chart as required by the question.
support breakout
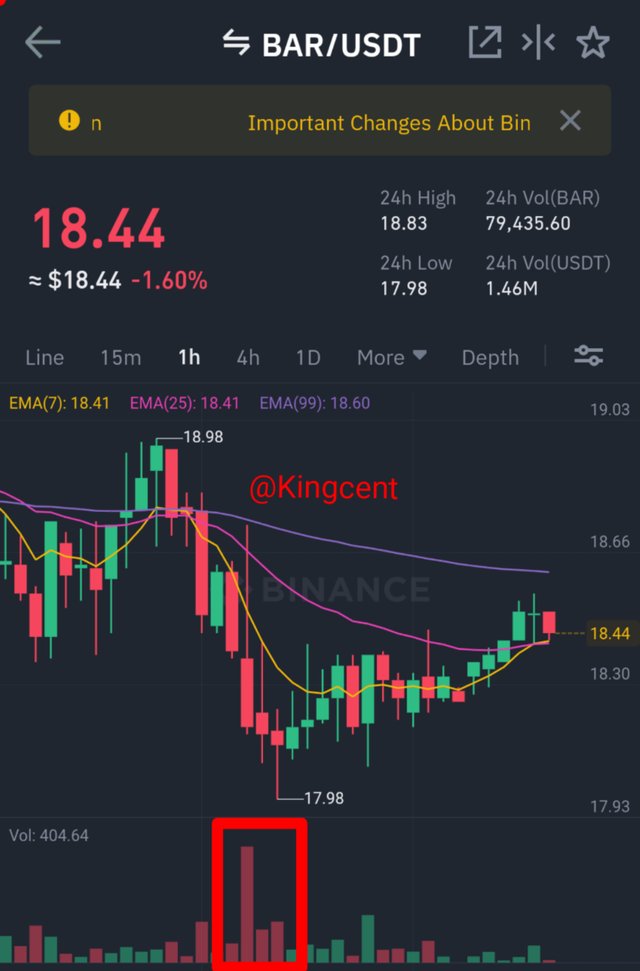
Actually whenever price reduces traders seems to buy at support level, this is a vital reason why you need more than one indicator for confirmation for me sometimes I use three various indicators, for proper analysis, this chart involves BAR/USDT.
When there is an increase in volume, and at the same time price climax to the support level, it forms a valid buy point.
Resistance level
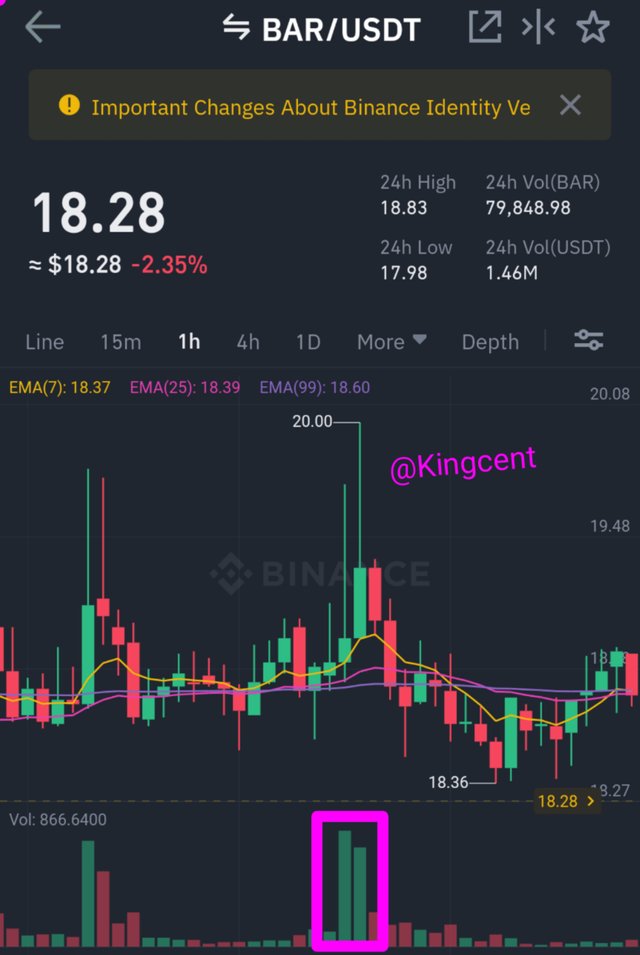
Resistance level is a level where traders take their profit, as an experience trader you don't buy at resistance level of you tray that trust me you will loose, when price have hit high, the next phase is to come down because buyers are exiting the market and this will cause price to come down and be bought up again.
If we notice an increase in volume, that means price is climaxing to resistance level and it will cause breakout, there will always be a breakout signals when price hit the resistance level.
How does the volume reflect the evolution of prices in the charts and why does the volume sometimes anticipate the price? (Screenshot required)
Volume and price have close contact with each other, is synanemous to what happens with trend and trend-lines/EMA, they have close relationship with each other, when there is an increase in assets you find out that buyers and sellers place their orders and in the end is been executed, at this phase trading volume can increase or decrease depending on the order been placed be it sell or buy.
When price increases Volume follow suit, so basically increase in price leads to increase in volumes, So volume reflects price increase. View a chart below showing increase in volume and increase in price.
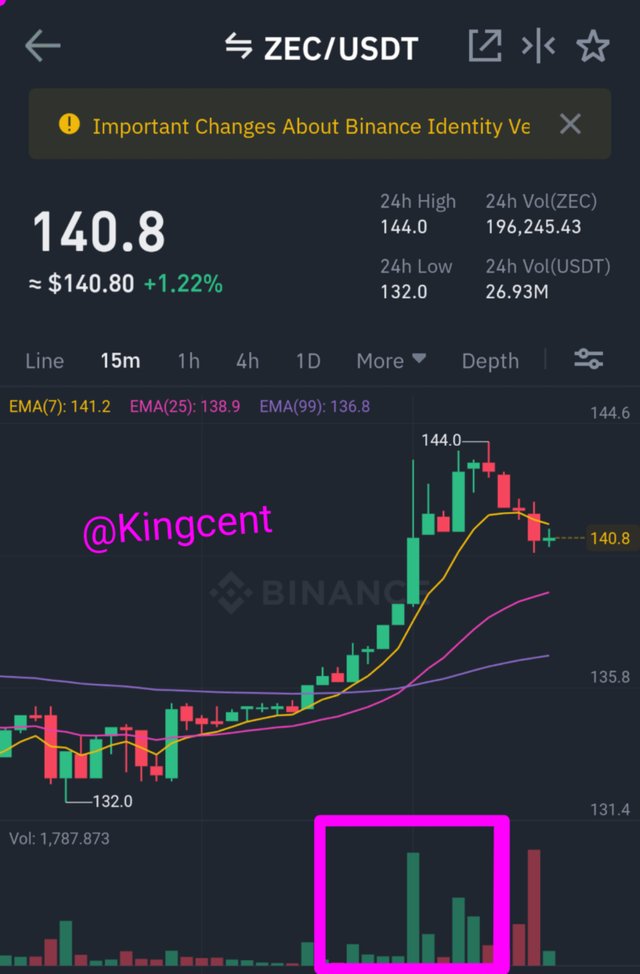
At this point I will say volume anticipated price, because as price increased volume follows suite.
Is it better to use the volume indicator alone or use it in parallel with another indicator when trading? Justify your answer
For me I don't think it's advisable to use volume indicator alone, one indicator needs total confirmation for me sometimes I use three indicator to confirm price actions in a chart take a look at this chart below.
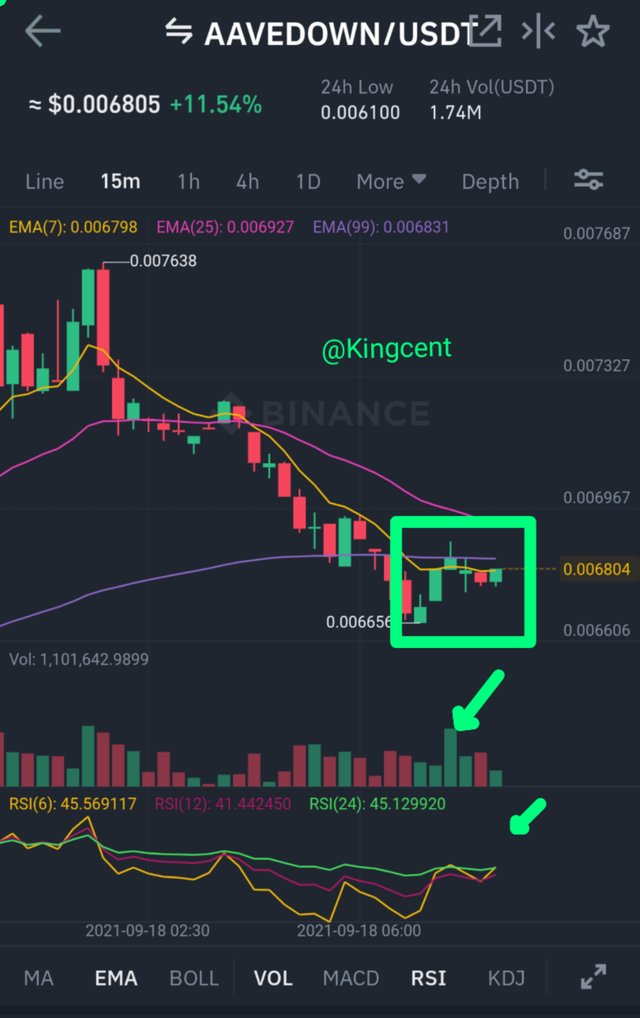
This is a chart of AAVEDOWN/USDT, in this chart I'm using three different indicators to confirm price movements, the EMA, RSI, and the volume indicator, doing this using multiple indicators gives you an elaborate room for proper analysis.
Analyzing this chart you will find out that price will fall bearish to retest the structure forming W, formation reason been that the EMA 99, is above price so it will compress it forcing it down, the volume isn't climaxing up, and the various RSI, are above the price, so the price will surely have a downtrend breakout.
You can see that using this three indicators gives a lime-light on what is going to happen as tends keep booming, from the question asked my answer is NO, is not proper to use only volume indicator alone.
The volume indicators are multiple, choose one of them to briefly explain its usefulness in crypto trading.
Just as you have highlighted here, volume indicators are multiple but I will go for the best in my opinion. That is chaikin money flow, why I feel is the best is because of the structures it offers, it measures accumulation distribution. this indicator usually falls above the zero line. View this chart below
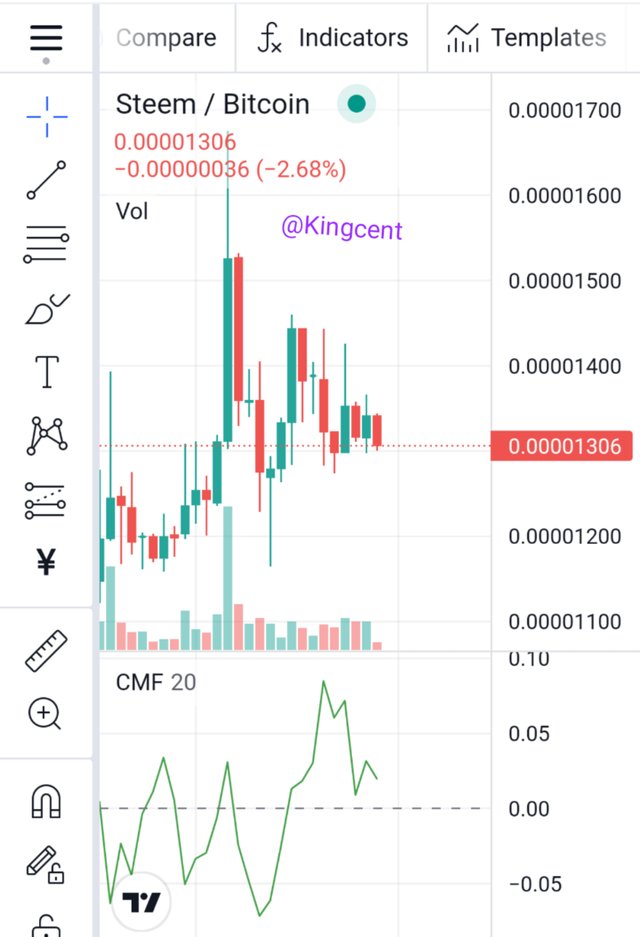
From the image I uploaded you will understand that the chaikin money flow indicator is on the zero line, it must climax up in a straight line above the zero line minimum will be positive and negetive respectively and they includes +0.15, and -0.15, respectively.
Let's say the volume makes a move from positive to negetive, it's potential arises to signal that means strong selling point pressure, at this phase market reversal isn't inevitable you know big money usually comes into the market on regular basics.
This indicator I very important because it will assist you to know when to pull the trigger, by this I mean when to place your buy/sell. Here you are allowed to sell when chaikin indicator breaks below the zero line. With the help of this indicator you will know how to set up your stop loss whenever there are pull backs.
CONCLUSION
From my homework you should understand that volume is very important in our day to day trading capability, trading volumes measures on how trading values are been traders within a concise period of time, trading volume is very important because it gives you the clear overview on how Market trends moves, when price moves volume follows suite too.
I regard volume as an indicator to measure the strength of a Market, rising Market leads to increasing volumes. Where there is a fall in price on increasing volume the strength goes down to the support phase then you can place your buy. You are mandated to execute your buys at the Support level, you can decide to set your stop loss and take profit it depends on your trading physcology.
Let's say price climaxed and got to a new high, and no lows, trust me you should expect a reversal this will be known as a result of the next candle-stick that is about forming, we have the killer indicator, and the volume indicator too they both are based on volumes.
I did some analysis on chart, all charts provided are all my original picture, no sourced image, I really enjoyed this lectures many thanks to you professor @Kouba01, hope to continue doing your homework sometime again.
Hello @kingcent,
Thank you for participating in the 2nd Week Crypto Course in its 4th season and for your efforts to complete the suggested tasks, you deserve a Total|9.5/10 rating, according to the following scale:
My review :
Excellent content in which you were able to answer all questions related to the volume indicator with a clear methodology and depth of analysis which is a testament to the outstanding research work you have done.
Thanks again for your effort, and we look forward to reading your next work.
Sincerely,@kouba01
Downvoting a post can decrease pending rewards and make it less visible. Common reasons:
Submit