Explain the Williams %R indicator by introducing how it is calculated, how it works? And what is the best setting? With justification for your choice.
William %R can also be called William percentage rate, it's a specific kind of momentum indicator, that it's measurement ranges from 0 to -100, you can also say that Williams %R is a technical Indicator used by technical analyst to measure overbought, and oversold.
With the use of Williams %R, you can easily spot entry and exit point in the market, it's very important you know when to buy and when to sell if you want to be a successful trader, this indicator is very similar to stochastic oscillator, basically used in the same manner, but Williams %R was developed by Larry Williams, it is made up of a high-low, with a 14 days specific period.
KEY POINTS TO NOTE
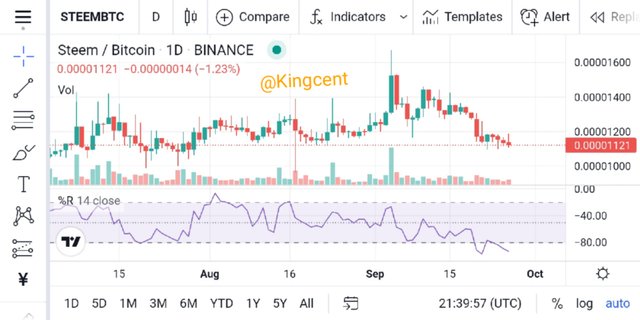
Williams %R measurements ranges and moves from 0-100.
When reading reaches above -20 it is seen as overbought.
Whenever reading reaches below -20 it is regarded as oversold.
when you hear of oversold, or overbought it doesn't necessarily mean that price will make a reversal, overbought means that price is nearer to the high and as an experience trader you don't buy at the high which is regarded as the resistance level.
Oversold means that price is very low, at the lowest range at this phase investors are looking for a way to buy the market up so that everyone can make profit, oversold is mostly determine when value gets to -80 and -100 respectively, the strategy you adopt at this phase will assist you alot.
William %R can be used to generate various trading signals as price moves at the Indicator/oscillator moves too, be it in overbought phase or oversold phase.
HOW DOES WILLIAMS %R CALCULATIONS WORK?
Most Technical Indicator usually have the ways at which they are been calculated and Williams %R, can't be an exception. The formular used in calculating this is seen below.
Williams %R= Highest High-close/Highest High-Lowest Low.
At this point
Highest High=Highest price in the set-up/look back-period which is basically 14 days.
Close=Rescent closing price.
Lowest Low=Lowest price in the previous period basically 14 days.
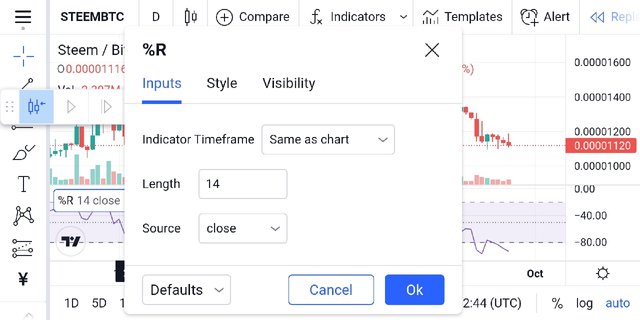
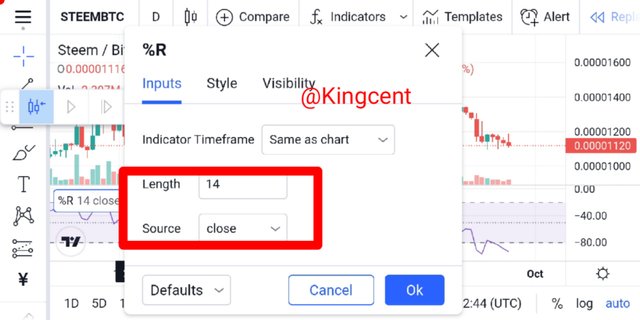
As for the settings I used 14 period as my length, it is the best standard setting as adopted by the creator of the Indicator itself Williams %R, it's optional shall it depends on the type of trade you want to execute be it long-term, short-term, or whatever but for me I set 14 as my length, you can easily do that on trading View home page, simply click on Indicator and proceed.
At this point I will show how to calculate Williams %R, as a result of price over the previous 14 period.
First you need to record the high and low courtesy each period for over 14 periods.
when you get to 14 period remember current price, I mean the high and low price, at this phase you can thus use the Williams %R formulas.
When it gets to 15 period, the high and low price, will be only on the 14 period not on the 15 period, At this time apply the new Williams %R values.
Each time you experience the end of each period galvanize the Williams %R, at this phase use the last 14 period.
How do you interpret overbought and oversold signals with The Williams %R when trading cryptocurrencies? (screenshot required)
Williams %R can be used to spot various trading signals, price moves as the indicator makes a move too, determining overbought and oversold while trading cryptocurrency is very important firstly you need to have a comprehensive idea on what overbought, and oversold entails which I explained earlier.
Williams %R is an oscillator which value fluctuates between 0 and 100, I have stated this earlier, looking at the graph/chart I showed below you will understand that it has two lines which stands for -20, and -80 respectively, you need to be aware of this values.
Williams %R percentage has a range and it ranges between -80 and -100 respectively, this helps in identifying a very rigid and strong oversold, comparing it to situation where we have -20, and 0, this particular one is seen as overbought, It's clearly demonstrated in the chart below.
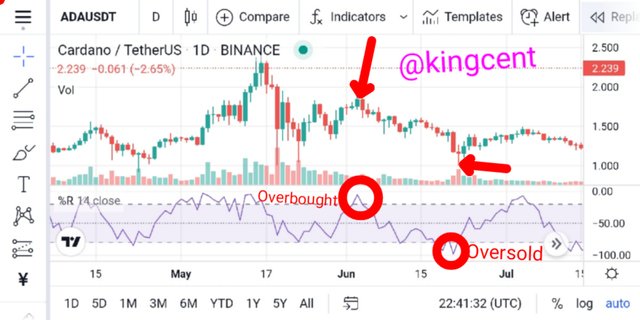
Crypto price fluctuates which means it moves up and down, so you need to target when price moves down you can place your trade thereby buying the market up to the resistance level where profit can be taken, you avoid buying at the resistance level so that you don't practice Overbought.
What you need to do is to wait for price to come down then you place your buy at the support level, by so doing you can find a specific spot where you can take profit.
What are "failure swings" and how do you define it using The Williams %R? (screenshot required)
Failure swing pattern I will say is a reversal pattern used to make buy, or sell entry, it serves as a signal in an uptrend, or downtrend, During failure swings different highs are been formulated higher high, higher low, it will get to a point where price will set thereby forming a lower low, from there you can enter the market from there and buy it up.
Moving forward despite forming various highs and lows, if the oscillator fails to climax above the reference line of -20 in Uptrend/bull phase, or make a downtrend below -80, we consider it a failure swing.
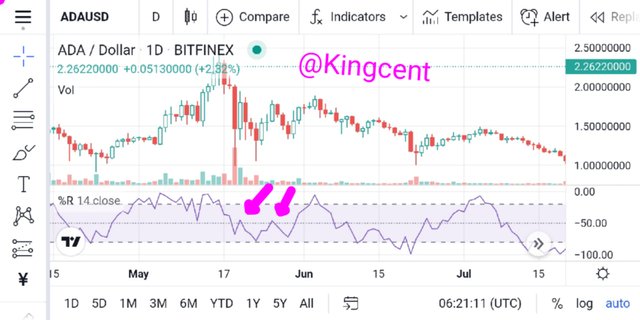
From the chart above ADA/USD, you will understand that there is a failure in swing, I pointed an arrow at a swing, and that's a clear example of a failure swing because price didn't pass their previous highs. There is a decline in the trends more like a weak trend almost in the same direction.
How to use bearish and bullish divergence with the Williams %R indicator? What are its main conclusions? (screenshot required)
Williams %R is widely used by many traders to anticipate price actions and know various divergences. In so many ocassion price actions are always a period of no trust as price actions doesn't go in-line with the Indicator been used, you know to confirm trends, trust me you need multiple Indicators if all isn't corresponding then there is a problem you can decide to go short, or go long as the case may be.
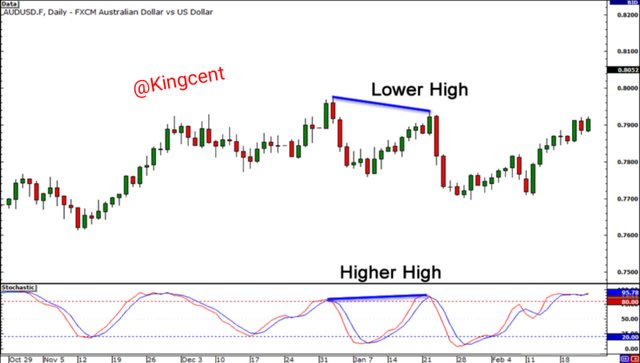
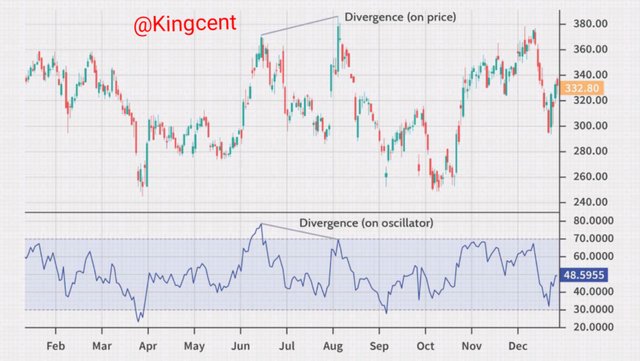
Bearish divergence; bearish divergence occurs mainly when price climax to higher high, in other hand the technical indicator is showing lower high. I will illustrate with examples later as I proceed. With higher high you will understand that the market is going bullish so what this means Is that there is a slowgish movement courtesy the moment.
Bullish divergence; a bullish divergence is seen when price falls to form a new lows, while on the other hand the Indicator fails to reach or Indicate the new low. When this happens it gives a very good buy signal and bull will be Keen to control the market.
MAIN CONCLUSIONS
| Bullish divergence | Bearish divergence |
|---|---|
| We observe bullish divergence when price falls forming a new low, at this point oscillator failing to reach the new lows. | bearish divergence shows a clear downtrend when price climax to the high, at this point Indicator fails to climax to a new pick, when this occurs bulls are loosing their standard to the market. |
How do you spot a trend using Williams %R? How are false signals filtered? (screenshot required)
Trends are more like buying or selling opportunities in the market, trend goes with lines as the price moves trend lines shows the movement of the price, if you are able to figure out market/price trends you can easily know when to buy or sell.
You can spot a trend and draw a trend-line, by so doing you have visually represented support and resistance, using a particular time frame for your choice, as price moves new trends comes up and you can know when to enter and exit the market.
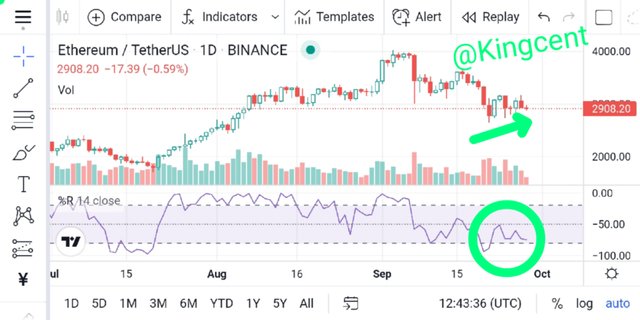
From the chart showned above ETH/TETHER you will understand that using Williams %R, you can easily spot a trend, looking critically at the chart above you will understand that there is a buying opportunity because the price is ranging around -80, and-100 so category is in oversold, so at this spot you can easily buy and thus specify your take-profit region.
At this position you can draw your neckline to know the structure is about forming, looking at the chart you will understand that price is about forming head and shoulder pattern, you can still wait a while and enter the market when the structure it wants to retest officially comes to fruition.
HOW TO FILTER FALSE SIGNALS
For me I see False signals like a break out whenever price are trying to form a higher high, or a lower low, or other highs and lows, this situation occurs whenever buyers or sellers have feelings that price forming higher high for instance will suddenly form lower low then there will be a breakout in price actions.
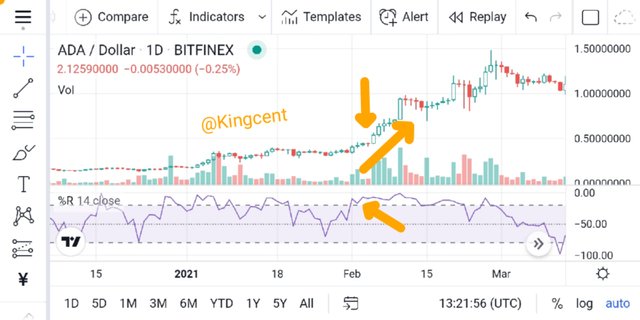
From the chart shown above market was going bullish until a red candle-stick formed basically a reversal candle-stick called pin bar, at this phase that is a false signal, many traders might decide to take profit out there, thinking that market will go Bearish.
At this point you need exercise little patient and wait for the next candle-stick that is about forming then you can enter the market from there. At this time you will know what to do with your confirmed strategy.
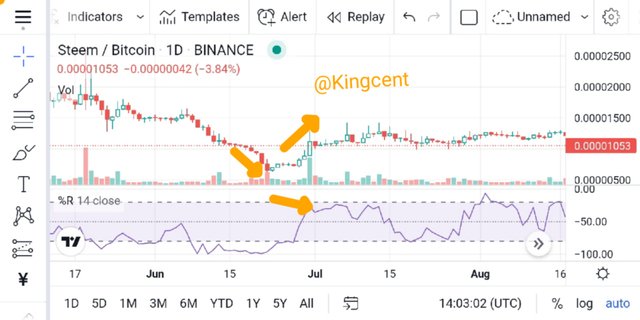
Use the chart of any pair (eg STEEM/USDT) to present the various signals from the Williams %R indicator. (Screen capture required)
Using the Williams %R, I presented a potential buy signal, as you can see from the chart there is a very strong oversold condition because price are in -80, and -100 respectively and this indicates a very strong buy entry. You should always look at the Williams %R, as it gives a more clearer picture of how Market trends to move and the structure it tends to retest, this is purely a buy signal.
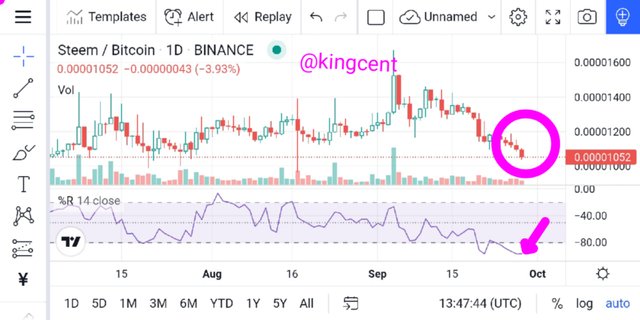
From the chart above you can buy at the spot I marked, and indicate where to take profit (T.P), from the chart above market moved a higher high and along the process a breakout signal showed up, more like a reversal candle-stick.
Before then if you have Indicated your T.P, zone, and price hit there eventually you have made some cool cash, you can set your take profit knowing where price is going you can easily go to bed and rest knowing fully well that price will surely get there.
CONCLUSION
From my homework task you will understand that Williams %R, which can be called Williams percentage rate, it can be defined as a momentum Indicator that measures from zero to -100, (0 to -100). At this point you can easily say that Williams %R, is an oscillator that is used to determine Overbought and oversold.
Using the Williams %R, you can know when to spot a trade, knowing when to buy and when to sell, is very important in the market with the use of Williams %R, knowing price actions seems very eazy because price moves as trend moves too as well in combination with the Williams %R.
There are sometimes when price moves in opposite direction with the oscillator, at this phase we have the bullish divergence and bearish divergence. We observe bullish divergence when price falls forming a new lows.
while bearish divergence shows a clear downtrend when price climax to the high, at this point Indicator fails to climax to a new pick, thank you very much professor @Kouba01
Hi @kingcent
Thanks for participating in the Steemit Crypto Academy
Feedback
This is good content. Thanks for taking in demonstrating such a clear understanding of trading with the William %R indicator.
Total| 8/10
Downvoting a post can decrease pending rewards and make it less visible. Common reasons:
Submit