INTRODUCTION
Hello professor @sapwood nice reading your great lecture at this particular time I went through it severally and trust me I understood alot, now let's keep the ball rolling, before I proceed to the question been asked let's know about what ONCHAIN METRICS, is all about. If you have been in a revolution about the new technologies around you will be conversant with some word's like off chain, data, and all the rest you must have heard about blockchain and all the characteristics it comes with.
Before I expand more about ONCHAIN METRICS it will be nice we hint more about blockchain, this can be defined as a digital ledger that mainly consists of blocks, various blocks consists of vital informations and a splendid alphanumeric codes called hashes.
Blockchain technology lays a strong bedrock from a standard gap that is seen to many people as the better option to the regular centralized financial system because of its Decentralized nature there are always value on information been issued out and all is contained in the public space, inspite that blockchain is immutable and it's very difficult to be compromised.
When we talk about onchain data, what we are practically talking about are informations/transactions occured on a blockchain network, remember on a block of a block-chain there is splace where information are been registered so we can this say that informations are been registered on a block of a block-chain, that's why I cherish blockchain alot, in a public blockchain informations are been made public, the data's are been categoriticalized into facets and they includes.
1 Data transactions; this includes receiving and sending addresses, amount also can be transfered
2 block data; this involves the time-stamp, rewards and miners fee.
3 Smart contract;business as usual on a blockchain but this time a condified and logic one.
Onchain analysis entails alot as it's for more like the housing of available data on a blockchain at the aim of extraction and utilizing of plethora of the data which are very much available on the blockchain space and it will help to facilitate a prolific decision making, the basics usually assists in trading galvanization and investment processes all round.
Let me look at one popular onchain metric which is coin days destroyed, it came to see the light of the day on 2011, it's motive was to fast track the incredible activities of a block-chain network. It's new network value was launched in 2017, it valued the most popular cryptocurrency
Bitcoin, and it's volumes and market capitalizations, today as we speak onchain has its indicator it can be used to analyze and play around with, as the my homework keeps moving trust me I will get to tell you more about ONCHAIN indicators and I will play around with then.
What is a HODL wave, how do you calculate the age of a coin(BTC, LTC) in a UTXO accounting structure? How do you interpret a HODL wave in Bull cycles?
HODL WAVE;
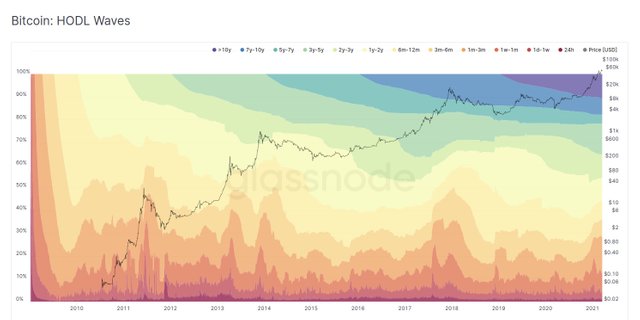
This represents the velocity of age distribution of various coins and it's supply and a great overview is been provided as a result of age distribution that will give an insight courtesy the ability to HOLD and SPEND a coin. This been said painting the correct Picture here you will agree with the that HOLD WAVE, simply gives and overview about the ability to spend and hold a coin and the benefits that comes when this both is been done, the behavior that follows suit.
HOLD WAVE, in all ramification provides a macro insight about the age and total distribution of a coin and it's supply and the range of distribution l, when there is a change toward the maturity of a coin Thai signifies that the coin has been spent somehow, and it's accumulation models can twick the changes toward HODL.
We have various frameworks at which HODL can be considered and they includes
Thickness of HODL wave brand
Accumulation and HOLDING
Spending old coins etc.
CALCULATING THE AGE OF A COIN
Age of a coin simply is the elongated time it has stayed in an address without been spent or sent to another address, we have a specific models at which we can determine the age of a coin in a particular address, it's is basically donated by
AGE OF A COIN=AMOUNT OF COINx HOW LONG WITHOUT BEEN SPENT
Now let's say the age of a coin is 3, that means that coin has stayed 3 years without been spent or moved to another address.
Looking at the image uploaded you will find out that it comprises if various colours in various zones, each of everything been displayed there comprises if something crutial, the various colors represents time periods, looking at the height at the vertical phase you will find out that it represents the percentages of UTXO, BTC, LTC.
At the top you will find the coins which is seems older, those coins is instituted in their various addresses unspent in their various addresses. HOLD seems to take center stage when the various items at the top is seen expanciating much more bigger than that of the ones at the down what this means is that the coin has wasted much time in their respective address for at least a period of 3 months, it can thus climax to six months, 1 year and do on. The more HOLD occurs the more the coin attains more values thereby making it's price to move up.
Coins at the older age has different similarities to that of the other coins, let's say a coin is unspent for 4 months what it means that it's going to make a twist and migrate to 6 months, and so on, what it then means is that the coin will get bigger. So what I'm practically saying is that if a coin is been held for a long period of time unspent the coin will mostly migrate to a higher zone and gets bigger, the reverse is the case.
Interpreting a HOLD wave in a bull cycle is very simple but first you have to have an idea what bull means, analysing your chart bull is simply an uptrend, that means price is going higher buyers have entered the market, so from the chart BTC, uploaded you will find out that the chart retested various line chart structures that showed bull cycles. HOLD here you will see coins been held for a longer period of time, this means the longer period from the chart will become expanciated, the reversal is the case to the shorter period.
The amount of coins that is supposed to be supplied will make a twist of coins are been HOLD for a longer time without been unspent thereby will May experience a bullish price action trust me there will be bullish engulfing.
Consider the on-chain metrics-- Daily Active Addresses, Transaction Volume, NVT, Exchange Flow Balance & Supply on Exchanges as a percentage of Total Supply, etc, from any reliable source(Santiment, Coinmetrics, etc), and create a fundamental analysis model for any crypto[create a model for both short-term(up to 3 months) & long-term(more than a year) & compare] and determine the price trend (or correlate the data with the price trend)w.r.t. the on-chain metrics?
Consider the on-chain metrics-- Daily Active Addresses, Transaction Volume, NVT, Exchange Flow Balance & Supply on Exchanges as a percentage of Total Supply, etc, from any reliable source(Santiment, Coinmetrics, etc)
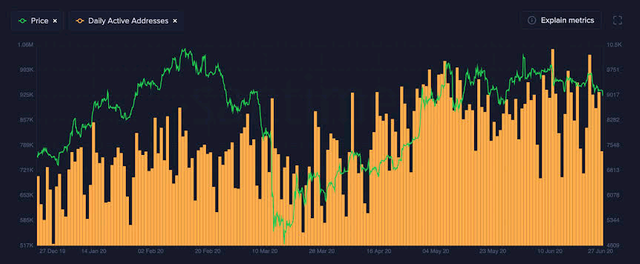
Executing this particular one I will make use of https//app.santiment.net, I gained access to this and I first created an account, here I will be analyzing the onchain metric of BTC chart and I will be using the daily timeframe, I will also look at the Active address, transaction volumes NVT, Exchange flow balance and supply on Exchanges etc
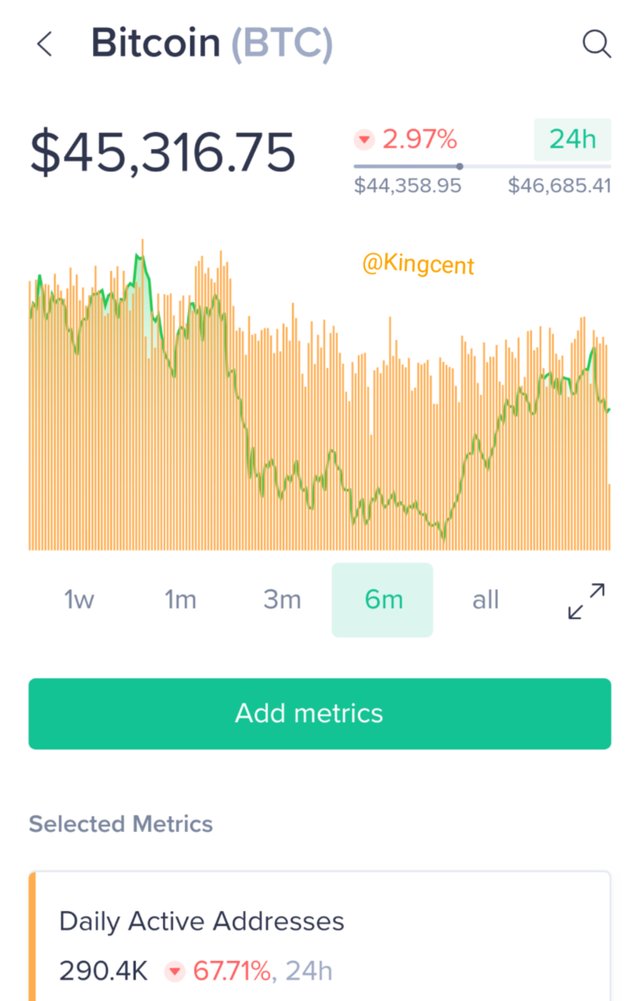
Daily Active address; I will be analyzing the daily activity address of Bitcoin that means 24hrs making one-day.
Analysis
In the past 24 hours there are many active address as to sending and receiving BTC, the total number of active address is ranging at 290.4k, with a total reduction at 67.71%, at the time of writting this post. Market cap is ranging at 851.6B, with a total increase of 0.86%. this makes BTC to spoke and currently trading at $45, it seems when there is an improvement in network then the price of Bitcoin moves up and the number of active address will this increase too.
Transaction volumes; here you click on transaction volume and Add metrics to the chart.
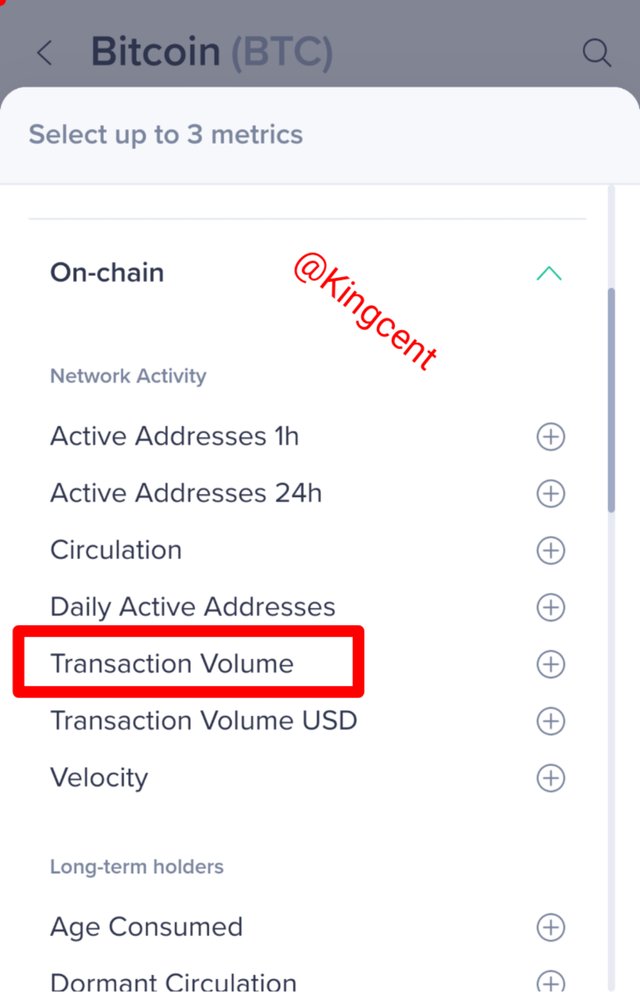
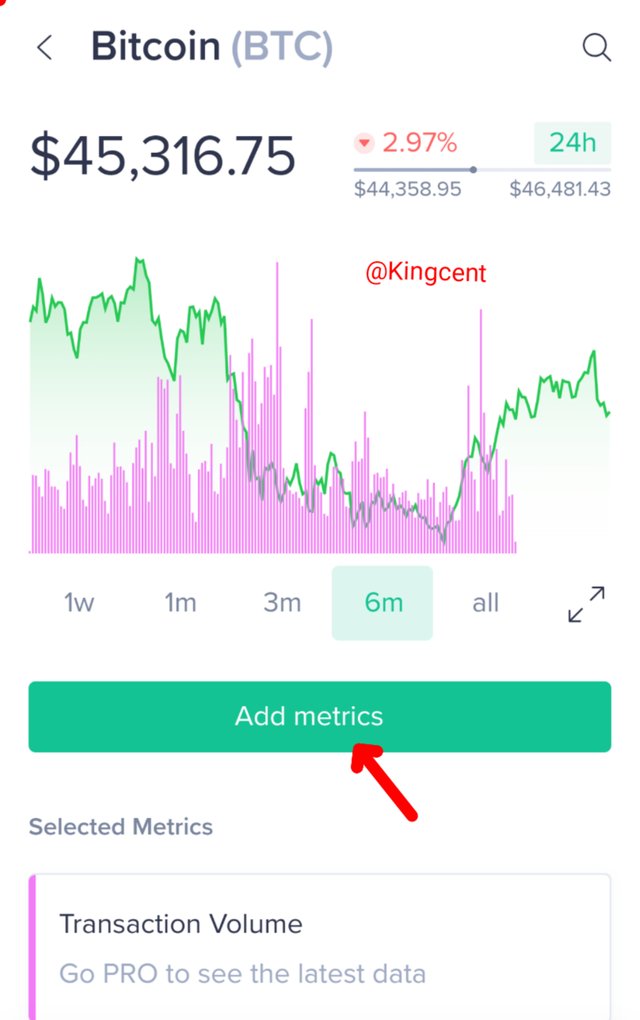
observations/analysis
As at the month of February 2021 Bitcoin was worth around 60,000 USD, it kept on climaxing till the month of May still in 2021, then when we got to the month of August the price of Bitcoin made a twist and there was a spike in price within 39k-48k respectively. During that time too the rate courtesy the transaction rate too increased now let's look at the various prices of Bitcoin in previous months
| Months | prives |
|---|---|
| June 2021 | 35k |
| July 2021 | 41k |
| August 2021 | 47k |
| September 2021 | 46k I mean presently now |
NVT ratio flow balance and supply; when we talk about NVT ratio it has to do with the value placed on an assets in conjunction with the value placed on a network. It has a way that it can be represented.
NVT is equivalent to the value placed on a particular transaction, if we place a value on anything we do it becomes relatively attractive, and ratio, seems to be the market capitalization and volumes all in an onchain.
To verify this I checked NVT ratio in transaction volumes and I added metric to it using BTC as a cryptocurrency, the daily Active address was having a reduction in 40.33%, in the previous 24 hrs, but the daily Active address was 536.7k.
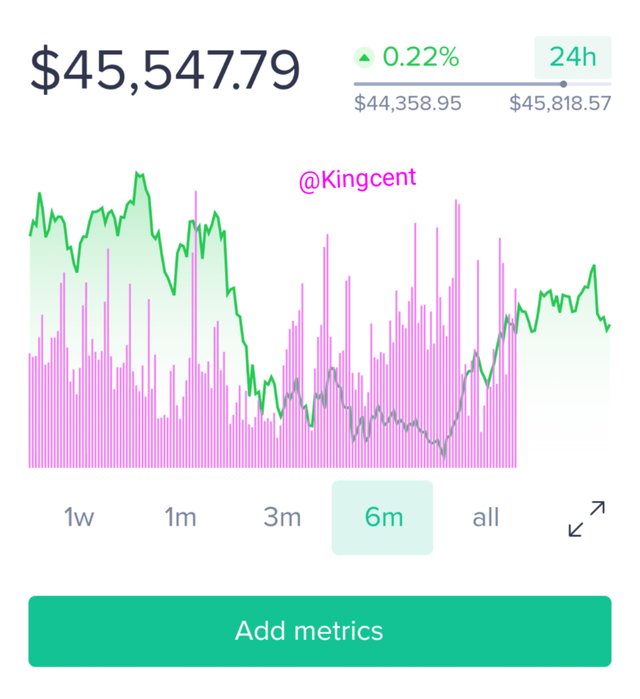
It's usually difficult to determine the exact user-base of a particular network, but you can know by identifying the exact number of valid address been sent or received if this is been done you will thus have an overview courtesy the extreme economic importance of a particular network. As for the ratio it's very important we have a long term ratio as it will help not to distort signal results.
create a fundamental analysis model for any crypto[create a model for both short-term(up to 3 months) & long-term(more than a year) & compare] and determine the price trend (or correlate the data with the price trend)w.r.t. the on-chain metrics
Creating a fundamental analysis on a coin here I will use LTC, and I will write the Onchain metrics just as the question demands. Litecoin is a cryptocurrency that was invented in the year 2011, by cahrlie Lee, remember Bitcoin came onboard in 2009, so Litecoin came two years after the inception of BTC, in the market today Litecoin is very popular and it's the 8th largest cryptocurrency today.
Litecoin is seen as a potential Bitcoin competitor, they both has the same features but there are still slight differences if you are looking at it's market capitalization Litecoin is basically seen as the sixteenth largest cryptocurrency around today. Just like other cryptocurrencies it has a limitations today we won't have more than 84 million Litecoin in circulation in August this year the value courtesy one Litecoin was at $168.50.
The price of Litecoin in the last three months that is in the month of June 2021 was ranging around $145.85, looking at it in the last previous years, that is more than a year you will find out that the price of Litecoin in December 2019, was ranging around $42.37. now looking at the current Litecoin price which is ranging around $185.33 at the time of writting this post.
Now knowing all about the inception of Litecoin one will be bound to ask what the price of Litecoin will be in the coming years, when you conduct your analysis very well you will
understand that from 2019, to 2020, the price of Litecoin climaxed high. For me I still believe it's
future rapid movement will still depend on the uprise of BTC.
The difference comparing the cryptocurrency Litecoin with their inception throughout the previous years, more than one year and the previous three months you will see the clear difference that exists between then both. In the previous three months the market capitalization was huge their where more trading opportunity, but in the previous one year the price of Litecoin never climaxed to a higher high. I will further write the Onchain metrics of Litecoin here.
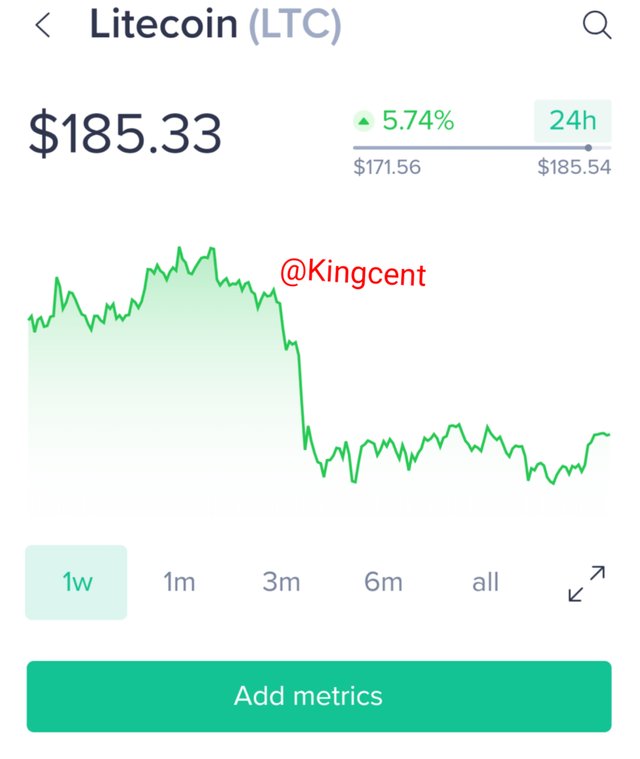
observations
I added onchain metric on Litecoin trying to ascertain it's transaction volume in the previous last one week, reading the line chart you will understand that it was in an Uptrend, it formed a double top and retested a level high so you will definitely expect the price to come down a little, that's what happened at the latter phase of the chart.
Are the on-chain metrics that you have chosen helpful for short-term or medium-term or long term(or all)? Are they explicit w.r.t price action? What are its limitations? Examples/Screenshot
The Onchain written is very helpful because for you to determine the current standard of price movem using lesser time frame like 1m,3m,6m, just as it is written on the Onchain metrics front page you need to have an idea on how price behaved previously.
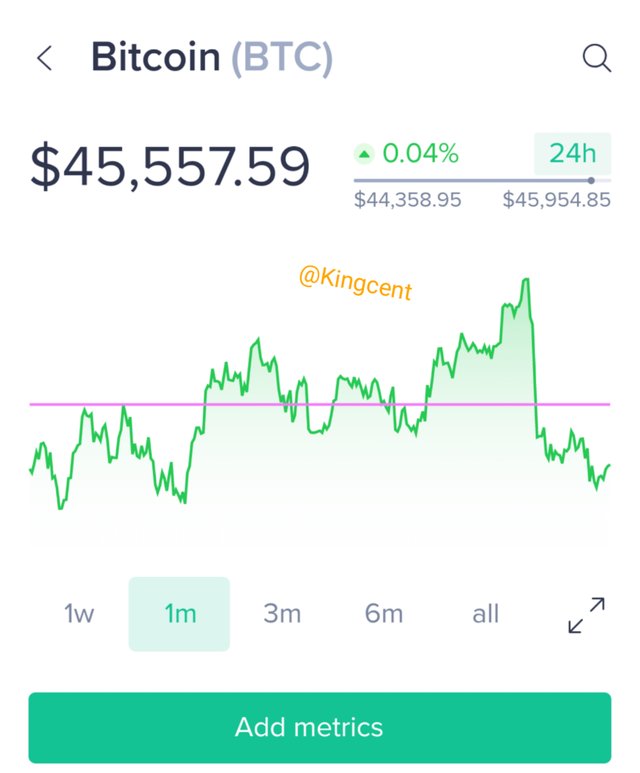
When we talk about the medium and long term investment it comes with so much Fundamental Analysis and technical analysis too, using onchain metrics it will this assist you to determine the value and strength of a particular assets, let's take for example HOLD wave is increasing what this practically means is that there are many people who is sticking to their assets and the longer they refuse to release then the stronger the assets could be and it will thus increase in value.
One most important thing here is the checking of the various daily time-frames daily timeframe weekly time frames and all the rest, user's will have a clearer overview of what the market is trying to create or how trends are going to swing, onchain metrics have been very helpful I must confess.
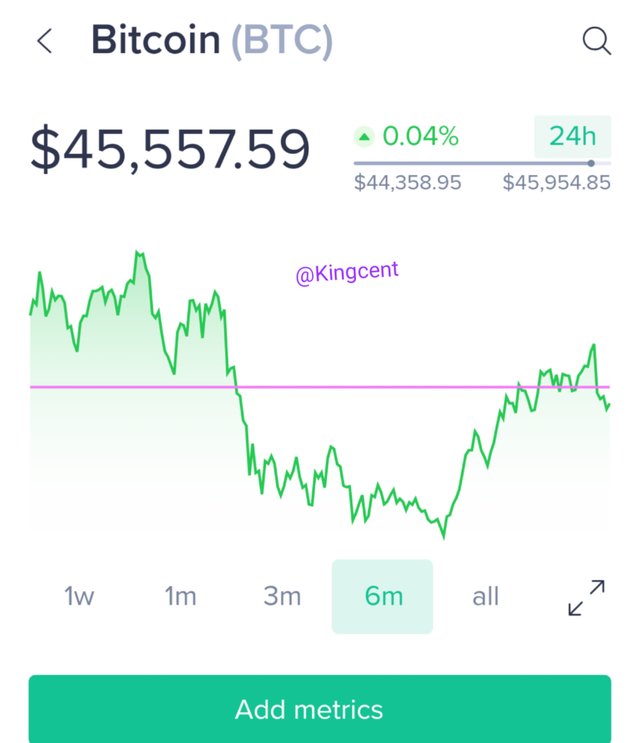
Are they explicit Write price actions; it has galvanized data coloration system, if you look critically well you will understand how the price actions are been accumulated From the past to the present it assists is to get a clear overview about any network. Although there are limitations too onchain metrics sometime gives signals that you can easily predict, all this is been centralized on the nature of an outflows the greather the outflows the decline in the supply of various Exchanges thereby there will be a total increase in price.
There are always limitation on the verge of getting data of Bitcoin expecially, and other cryptocurrencies too, as we speak out of 8000 cryptocurrencies we have it's difficult to have the data of 100 of the 8000, Cryptos that's how limited it got to be.
CONCLUSION
From my homework post you should be able to know and have a clearer overview about ONCHAIN METRICS, onchain data and all other words relating to blockchain technology, onchain data refers to informations/transactions that have occured on blockchain network. Blockchain itself is a very much prefered place because of some certain characteristics it possesses, blockchain are digital ledgers which consists of blocks and new transactions are pretty been recorded in there, that's why it's very difficult for anyone to compromise w blockchain.
I hinted on various Cryptos and I added METRICS to many of then and I was able to use various time-frame's to determine it's market capitalization and other relevant information's, I read the trend-lines knowing when and where the price is climaxing to. It's really amazing to have learnt more courtesy this assignment many thanks to you professor @Sapwood.
