
Introduction.

Hello steemians how are you guy's doing, this is a new week installed for us we are greatful as we attend this beautiful homework task lined up for us @steemcryptoacademy, this week lecture presented is indeed a beautiful one and we are going to disect it one after the other.
Cryptoacademy courses are very unique as it takes time and composure to assimilate all the brains and reasonings, in order to get it clear, trading is very important in our day to day life as it brings out your true character when it come's to patience and emotions, it must test it.
If you aren't a patient type trust me you will loose your trade often, having said this the topic installed for us to is all about mastering let's get the ball rolling down.
Explain the Components of Bollinger Bands.

Bollinger Bands is an indicated used by trader's to determine price movement's in the market, it is a technical analysis tools and it was developed by John Bollinger in the early 1980, this indicator assist trader's to predict market volatility thereby knowing the direction of trends whether it is in overbought or oversold region.
Describe the three main components of Bollinger Bands.

Bollinger Bands consists of three lines which includes the simple moving average (SMA), the upper band, and the lower band. Looking at the chart below the center line is referred to as the stock line, it is a 20 day (SMA), the upper and the lower band refers to as standard diviation, The lines are two just as you can see from the chart they are situated above and the other below the middle line.
Calculating the simple moving average all you need to do is to add up the closing prices then divide it courtesy the periods selected in view, let's take for instance a 20 days simple moving average, all you need is to sum up the 20 closing prices of this 20 day's trading period then also divide by 20.
You cannot write about or describe the component of Bollinger Bands without putting this important calculation in place as Bollinger Bands usually combines a moving SMA, in order to measure trends and volatility in the market.
For the standard diviation calculating it is very simple all you need to do is to use the same period as the simple moving average, the standard diviation pin-points on the notion of how prices disintegrate when there is volatility in price. While looking at the standard diviation we should also consider the concept of the upper and lower band.
When Bollinger Bands are constructed two thing's are involved, they are the addition and subtraction of certain standard diviation's They are usually two(2), this instigates the upper and lower bands which produces price movement thereby formulation price contractions of expanciation, which brings about upwards or downward movements in the market.
Trading generally is very volatile, the bands get expanded when there are much volatility in the market in reversal get contrasted when the market becomes very stable, overbought is determined when price gets to the top which is the upper band, and oversold when price reaches the lower band, these movements signifies one thing trading opportunities come's to fruition, you can decide when to buy and sell depending on your strategy.
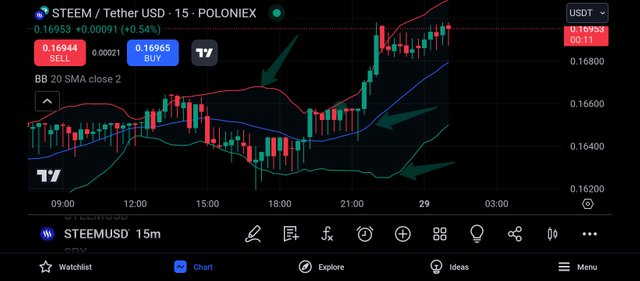
For the upper band you can see from the chart that it contains two standard diviation that is above the SMA, when price goes up the upper band is seeing as the volatility boundary because it then represents an overbought then where there is a break then trend changes.
It all depends on the nature of the trends, at the overbought level price can change and there will be a reversed strategy expecially when price touches the breakthrough which we will then see the activation of a resistance phase popping up.
The lower band is usually below the SMA, it indicates that there is a volatility of buy signal, since price is in oversold as it touches down below this is a perfect example of a buy signal. For me when price touches the peak of the line you buy.
How does each component contribute to understanding market volatility and making trading decisions?

All trader's want is to make profits in the end, this can only come if you make good and quality trading decisions, Bollinger Bands help traders to know when breakout will occur therefore buying or selling depending on the breakout.
Detecting potential breakout: when there is a trend/Volatility compression after which there will be a breakout, note this breakout might be uptrend or downtrend depending on the price actions.
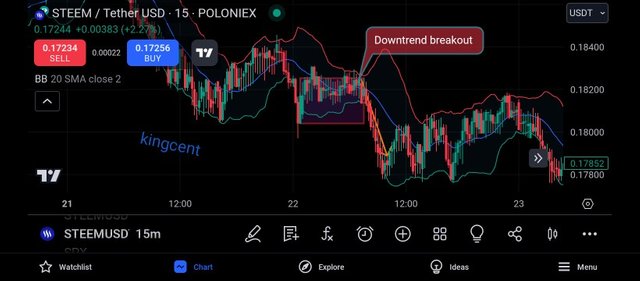
Looking at the chart, there was a little consolidation as price touched the simple moving average at top there was a breakout downwards and a W formation was formed, which is a double top and a double bottom, whenever price touches any of the three lines Changes occurs.
Another great area to paying attention is the price formation, what is the formation in view, this is technical analysis, it all deal's on the formation of candlestick, When there is a price formation of a higher high, and price touches the SMA, then a breakout is eminent.
Volatility Expansion: putting every parameters in place depending on your trading patterns there are still a phase where there are long trends in the market, as the trend's gets very tensed the bands gets to be wider, let's see a chart below.
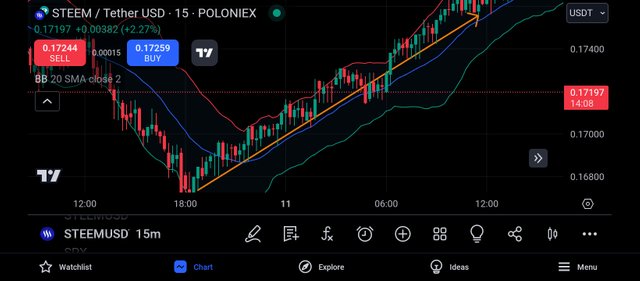
This is a chart of STEEM/USDT looking at the chart there is a long train of trend, price touched the lower band, and boom a formation of higher high, and higher low in some scenario kick-started, then looking at the gap's between the bands it was very wide, as trends keeps going higher volatility keeps expanding, the bands keeps expanding too as well.
When there is a volatility Expansion, the band widens at this point making trading decisions has to do with the phase of the trends if it is a downward trends is a buy, if it is an upward trends you sell down, as a trader you need to be very careful in following trend's.
Price stable within band: whenever you see price staying within bands then continuation is paramount, it can be at the upper band or the lower band look at the chart below for proper understanding.
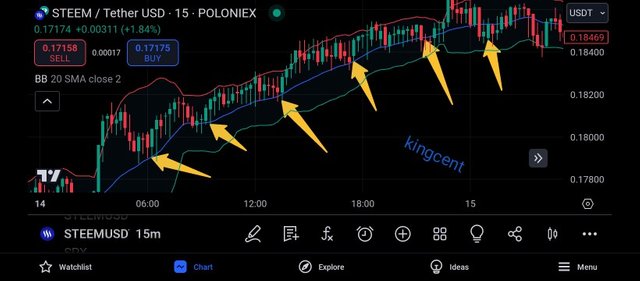
Looking at the chart you will understand that price was very much stable, this is a perfect time to making good trading decisions at this point you take the second band as a support level, if possible use a sniper entry to navigate through, whenever price touches the second band you buy.
When it touches the upper band you sell, just like that as you continue doing that you also target breakout, it can happen anytime, but one thing is very important trends respect previous trend's if price sees previous trend's it must respect it as generally price moves in Zig-zag form.
Bollinger Bands halps trader's make good and quality decisions if you know how to read the line's carefully, in trading This volatility market everything has to be put in-place for quality effectiveness to making good profits in the end.
Explain if the market is in an overbought, oversold, or neutral state.

Q2 is asking the market condition of steem/USDT with Bollinger Bands determining if the market is in overbought or oversold region or in neutral phrase.
First overbought in this case is regarded as the resistance level in the market while oversold is regarded as the support level, when there is overbought what it means is that price has gone up significantly which means that there are lots of buying pressure in some indicator overbought might even rise to 70 or 80.
When price is at the overbought phase at the peak, what should be your aim is a pull back, a change in trend direction, when pull back is about to happen it then means that people are tired of buying, as the buying power decreases you find out that pull back will tend to occur.
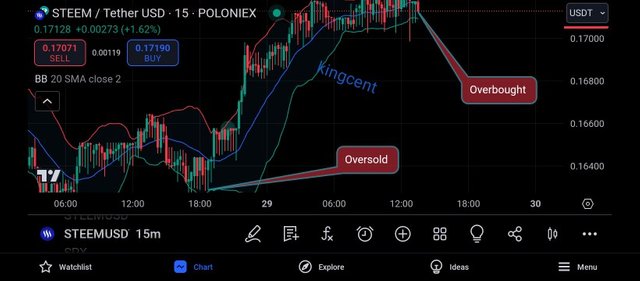
This is a chart of STEEM/USDT in here I indicated the overbought and oversold region, as at the time of writing this post price is in overbought region after a series of highes formed from the oversold region.
At the overbought region is looking like a breakout wants to occur after series of little contrasting formation, but I will tell you for Free the market isn't in a neutral stage, from the oversold region with it's formation note if the new lows aren't lower than the previous lows price os going up to continue soaring higher.
Before price gets to the overbought region there are lot's of highes that refused to turn to lows there accelerating price to the climax, to the apex level where breakout will occur, all hope for steem is that it goes higher, and higher if possible start competing with BTC.
Bollinger Bands signalling buying or selling opportunities: with Bollinger Bands trader can easily detect overbought in the market by knowing some simple step's, When price gets to a peak touching a break above the upper trend then we know that overbought is here, take a very look at the chart below.
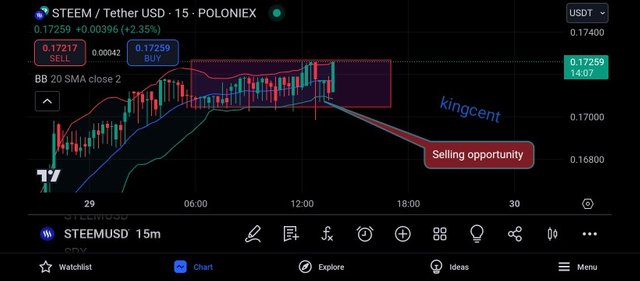
This is a STEEM/USDT chart where is indicated a selling opportunity at the overbought phase, looking at the chart very well as price touched the peak or the break in the upper band selling signal is eminent.
Although there are little consolidation waiting for break out as buyer's are already getting tired, based on my analysis the breakout will surely be on downward trajectory, as the bands widens there is going to be an increase in volatility that will push down the price to begin a downtrend price action.
As price closes in the upper band region looking at the chart, with many periods, all these are signs of a downtrend reversals, you should pay clean attention to this teaching's to avoid losses of funds, knowing selling or buying phase please consider period 20-50, not forgetting standard deviation 2-3.
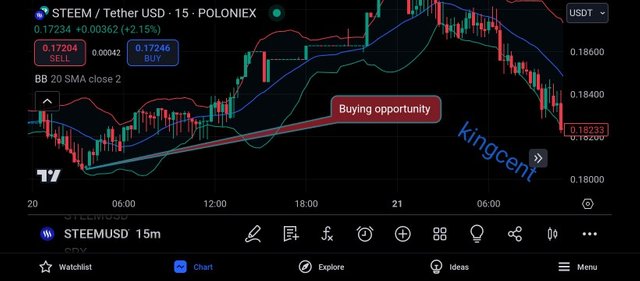
Knowing the perfect position to make your sell using Bollinger Bands is very eazy you should understand that in trading generally is either you are buying or you are selling, looking at the chart I presented you will agree with me that price touched the break below the lower band then sell signal came to limelight.
When there was an increase in the band there was also an increase in volatility, in here if at all Bollinger Bands was combined with another indicator you could have seen overbought at 20 or 30 level, which is a pure selling opportunity.
Looking at the chart you will understand that price closed at the lower bands for multiple periods, band period must be considered while using Bollinger Bands to determine either buying or selling, for selling phase band is roving around 20-50 periods and 2-3 standard deviation.
Explain how Bollinger Bands indicate market volatility. Use a real example of Steem price action.

Bollinger Bands has an upper and lower series as it contains three lines, when the bands are created it envelopes to price action, these Price action are in channels which can either expand or contrast before breakout occurs, when these channels are formed two thing's happens, is either volatility increases or it decreases.
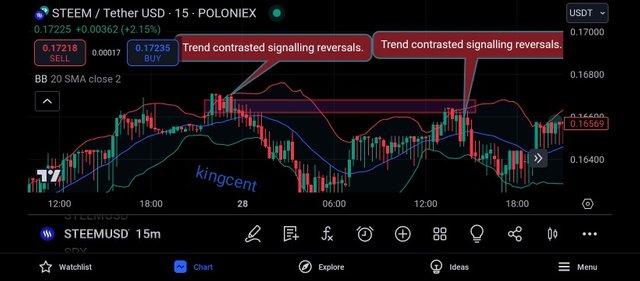
Another word for contraction is sqeeze, looking at the chart above in order to detect where the band contracted you will find out that it is related to volatility of price action over the 20 period retracting to obey a previous trend and there was a decrease in volatility this happened in Two various occasions as clearly showed on the chart.
Breakout happening above or below the Bollinger Bands are essential almost 98% of price action happen's within the bands, we should pay attention on the bands also on the price action formulation, in the bands price can either move bullish or bearish or sideways.
Looking at the chart expecially when price touched the upper bands, the upper and the lower line squeeze perhaps they more like wanted to come together you can see quickly price took action and there was a downward movement, this is a very sensitive area to pay attention on.
The upper and the middle line came close, contractions happen and things changed, it happens in two occasions which means price action respects previous trend's whenever it comes in contact with it.
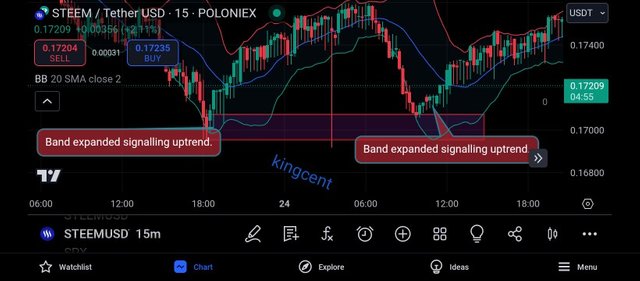
I looked carefully at the 20 day's moving average line below and I quickly realized that price will move up and it happened as predicted with lot's of higher high formation. Although there aren't a specific timing regarding when there will be change in volatility intense of occurrence since we are using Bollinger Bands Alone.
No matter the movement when it come's to trend's the Bollinger Bands can also walk the bands, it can touch the break either up or down, when it touches the upper bands it signifies strength of purchasing muscle/power as it happens most time's looking at the chart above.
Chart has a pattern based on the velocity of chance incured by the lower bands Stock usually have momentum to push up, this is not contractions this is expansion note while trading whenever this happen's there will be increase in volatility.
To recognize increase in volatility also pay attention when it come's to increase in mean size, as price goes far away from the moving Average boom price action soares up signalling a break to accelerate upward, all are demonstrated looking at the chart I presented.
Create a Trading Strategy using Bollinger Bands, For The STEEM Token.

Trading Strategy is simple a personal pattern at which you navigate the market in order to make profits in the end, every trader wants to make good returns on investment, trading strategy helps you know entry and exit point's, based on your strategy you can decide not to enter the market at a particular time because your strategy hasn't been perfected yet.
Here I will personally create RSI, strategy with Bollinger Bands, RSI means Relative strength Index, is also an indicator used in technical analysis I have constituted the strategy let's see how it works.
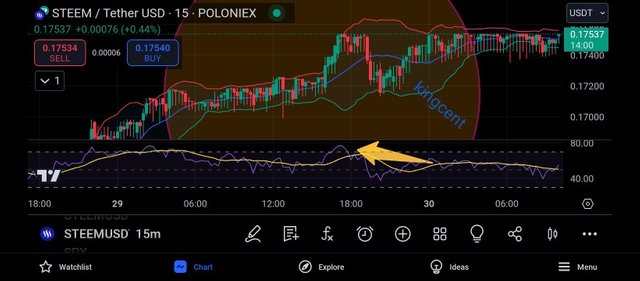
Here I will identify using this strategy entry and exit point, price touch point, and crossings, RSI is a very powerful tool's as it is very known and common to trader's, when the RSI gets to 40 and below it is regarded as oversold you can buy because price will be deemed to been on the support level, then from 60 and above we consider it overbought out here you can collect your profit when you sold at the support level initially.
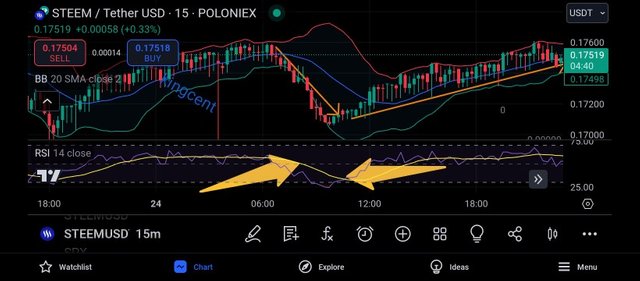
Looking at the chart the entry point should be at 0.17600, as price Hits the top bands there was contractions, just as we know whenever sqeeze occurs there is always a change in the direction of trends, still on this trading strategy let's see at how the RSI behavior when price touched the peak of the band.
Looking at the chart I marked it, the RSI crossed the two lines crossed itself before price went down, one key important thing you should pick out from this strategy is that, at the resistance level when there is a contraction as a result of a sqeeze then RSI makes a cross (midline crossing) it is perhaps a sign to sell place a sell price is going down.
To verify the exit point quickly look back at the previous price action, still paying attention on the indicator lines the two indicators been used,at the point when price got to 0.1700, the band lines expanded which means that there are much volatility, the RSI made a cross again this time moving upwards which shows uptrend.
This strategy when price touches the lower band and the RSI crosses at the support level you should start looking to buy the market up, you can see that two indicators can't be wrong at the same time, although there are so many indicator that are lagging in nature.
When trend's are been confirmed using this beautiful strategy of mine trust me you are bound to making a good gain in the market, entry point should always be at the support level, while exit at the resistance level.
Apply Bollinger Bands to forecast future price movements of Steem.

Currently STEEM is trading at 0.1745 with 286.80k turn over in 2021 steem price rose to $1.26 all of a sudden there was fluctuations and the asset lost up to 70% and went down, dropping to 0.94 in just few days interval today STEEM is struggling to attain a high.
In the middle of June STEEM Token gained little momentum and started trading at $0.41, the bullish trajectory continued till around September 4th where price blew to $0.75, in less than two weeks price dropped to $0.47, from that day STEEM has been going downwards, this lasted till January ending.
At some time price dropped to $0.29, still going down at some point there was a stabilization around 0.3, at the end of March, the market went bullish again reaching a high where STEEM started trading at $0.42, then from the beginning of April STEEM Token was bearish up till April when the token broke resistance and started trading at $0.59 on April 21, but as at today steem is trading at $0.1745.
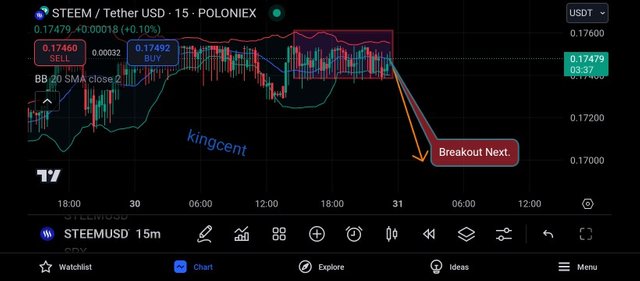
Now I applied Bollinger Bands to know how this Indicator Bands suggests support and resistance, above is a STEEM chart Indicator fully applied, looking at the chart STEEM price action is ranging at $0.17479, at the resistance level expecting a potential downtrend movement.
Each time price touches the upper band there is contraction, no clear breakout generally I will say the market structure is squeezed, in the coming day's price of steem will most likely drop, looking at what the future holds using Bollinger Bands.
From last month till today steem price hasn't gained momentum to accelerate upwards to gain lot's of momentum as it achieved in 2021, price pretty much revolving around $0.16-0.17 with no clear acceleration breakout.
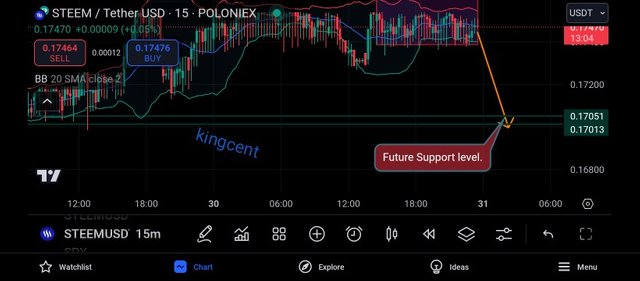
Looking at the chart with the indicator in place STEEM price will drop down to a support zone around $0.17051 From $0.1755, along the lower low price formation's which will drag price downwards you can still make buy's yes.
Making buy's when price is going down come's with lot's of expertise, as the entry must be very sharp and snappy, (scalping), the bands is already getting Closer to each other which means downwards breakout is eminent.
Moving forward in the future STEEM price is going to drop, when you look at the chart and the potential drop in price to $0.17051, as predicted by me there is a previous level formed at that point so what it means is that when price gets there that level can be considered as our new support phase.
In technical analysis previous price action is very important as price always react whenever it touches it, when price gets there hopefully we can see a potential change in trend, but as we speak at this particular time of writing STEEM will form a lower low as there is a potential downtrend movement.
Disclaimer: Note the information provided In this blog is simply for educational purpose only and not a financial advice, trading Crypto is very expensive the market is very volatile before you venture into trading learn from the best, Master your strategy so that when you officially kick-start you can perhaps come out with flying colour's trading come's with lot's of risks as the market generally fluctuates and very volatile, God bless.