Introduction.

Trading comes in various forms and type's, the ability to navigate the market is key as there is enough room for learning, development, and patience all round, trading is very volatile, and I will say in no way is trading a get rich quick scheme.
In order to get it excellently your need lot's of mentorship, I will tell you for free you can perhaps get it clear following steemit platform generally taking everything course presented courtesy steemit Crypto academy.
For this week we are blessed with this wonderful course outline talking about trading steem with ichimoku cloud, below are some of the questions been answered by me.
Explain the Five Components of the Ichimoku Cloud.

Ichimoku cloud is a technician analysis indicator developed by Goichi Hosoda it comprises of five lines meant for calculations, and they Include.
i. Tenkan-sen= This can also be called a conversation line, it consists of 9 period moving average with a sole motive of evaluating short-trends, I will say Tenkan-sen is very good while scraping the market for sniper entries.
ii. Kijun-Sen= This is a base line which has a 26 moving average, which showcases a medium term trends in the market, as the trends keeps emanating always put it at the back of your mind that reversal is possible.
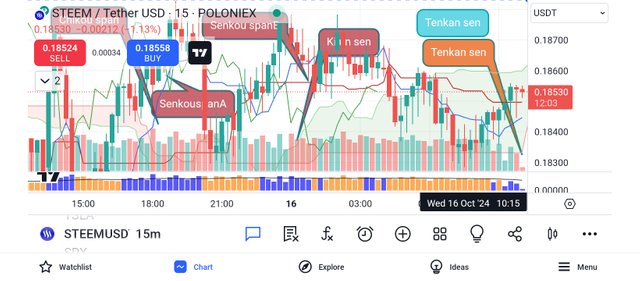
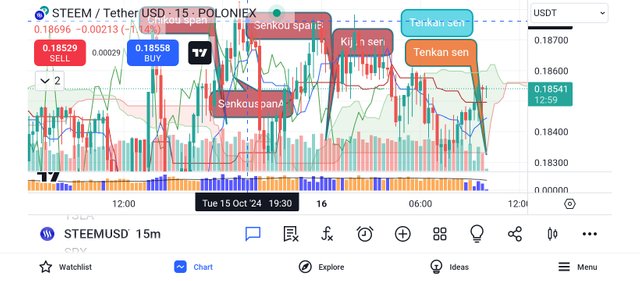
iii. Senkou span A= This is a leading line which constitute a clear average of Tenkan-sen, and Kijun-Sen, the most beautiful thing about this line is that it is plotted 26 period Ahead.
iV.Senkou spanB= In trading we have the highest high, and the lowest low, or lower low, this plot over 26 period Ahead.
V.Chikou span= This line is known for lagging, meaning market and trend's going in opposite direction, it is plotted 26 period behind.
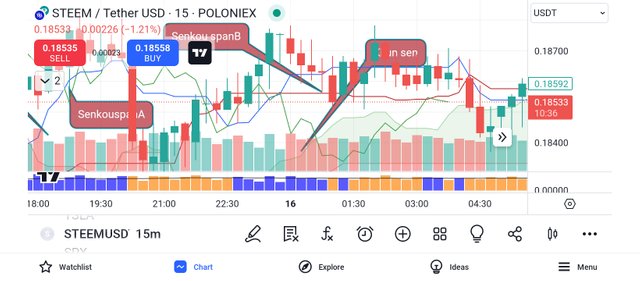
How does each component contribute to understanding market trends and making trading decisions for the Steem token?

For trading decisions to be made, you need to understand the concept of trend's, keep in touch with the occuring candle stick formations, and price actions in here the pretext of knowing where to buy, how to buy, and where to buy should be properly put in check, this brings us to knowing key zones of support and resistance.
As the trend's keep coming with high volatility voltage, buy at the support level, when it gets to the resistance level you can decide to sell, like the Tenkan-sen, which constitute of a 9-period moving average, in here short trend's can be executed quickly.
Generally when you follow the trends you get it clear, always remember that trend's, market formation doesn't go one-way, it goes in zig-zag form, make good and quality informed decisions on time to always win.
I have explained for Tenkan-sen, now for Kijun-Sen which compromises of 26 moving average, the trends isn't in a fast lane, as it is secondary meaning there can be breakout at any point remember this is not a shot term trend.
SenkouspanA is a fast moving trend in the market basically for the fact that it is ahead, is like a future trend, as it has two composition makes it even more pivotal as it is plotted 26 period Ahead WaW.
Senkou spanB considering this line in trading you focus on either the highest high or lower low, each one you focus plot's ahead 26 moving average, by so doing trading decisions can be taken either to buy or sell looking at the specific area's of specialization.
For Chikou span considering this line while trading or before you trade is very important simple because trends can signal you to buy, while indicator is showing otherwise (Lagging) taking trading decisions I will say wait for new trend's before resources will be wasted.
Analyzing Trend Direction with the Ichimoku Cloud.

Trend direction is simply the phase of the market, are we going to buy or sell, what is the trend showcasing we need to know this in order to enable us make good and quality informed decisions.
Buy so doing i navigated my trading view and got access to STEEM/USDT pair to know the phase of the market, whether it is in uptrend or downtrend so i can know whether to buy or sell.
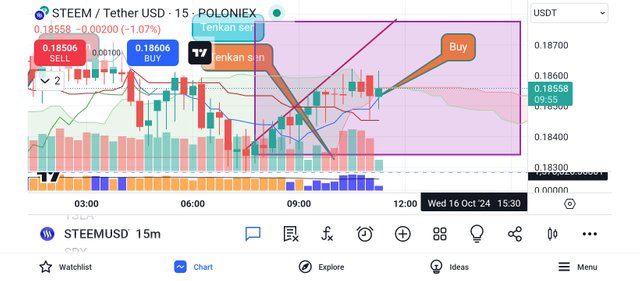
Looking at the chart above you will understand that is clearly a buy signal, as at the time I navigated this chart trend was forming to higher-high, looking at the chart to authenticate the buy option you will understand that the previous low, didn't go pass the current low, instead it continued going high, and higher.
Whenever higher high formation is done it show's a buy signal, the market isn't in a consolidation phase, I drew my trending all the indication shows a buy, looking at the line crosses the red and the blue line crosses basically the Chikou spanB, and the Chikou span, lines as they Crossed it showed and gave more buy evidence.
Identifying Support and Resistance Levels with Ichimoku.

Identifying support and resistance with ichimoku is essential what you need do is to concentrate on various factors which includes the line's, price actions etc, everyone has he's or her various ways through which support and resistance can be identified.
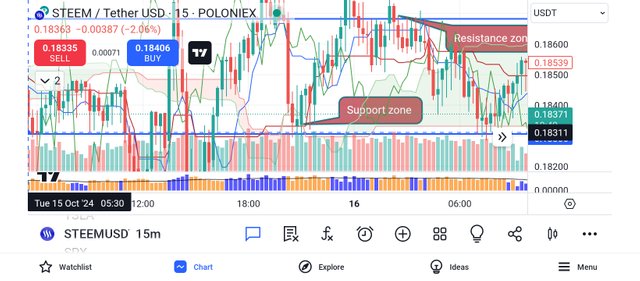
Identifying support zone with ichimoku cloud you have to consider the Tenkan sen line which is usually at the low, whenever there is a lower low price actions then support zone come's to fruition.
At the support zone you buy, looking at the chart I uploaded you will understand and perhaps see that when you buy at the support zone trend's formation transcended to a higher high formation.
When trend's got to the resistance level which is a sell zone, now imagine you selling at that point you make lot's of profits, but you need to be very careful because this indicator isn't 100% correct most times.
For the reversal you have to consider the previous trend's, in technical analysis it is regarded that trend respect zones no matter the indicator been in use at that particular time.
Looking at my chart and the zones marked out you will understand that when price came down from the resistance zone to the support arena, when trend saw the previous trend reversal occured.
Trading with the Ichimoku Cloud.

Trading strategy is keep to always win in this volatile market, in here I developed a Trend following strategy, this strategy helps a trader monitor the trend and indicate key positions where stop loss will be set to avoid excessive losses.
With this strategy you will be able to detect entry and exit point using stop-loss quickly the chart below explains it all, check it out.
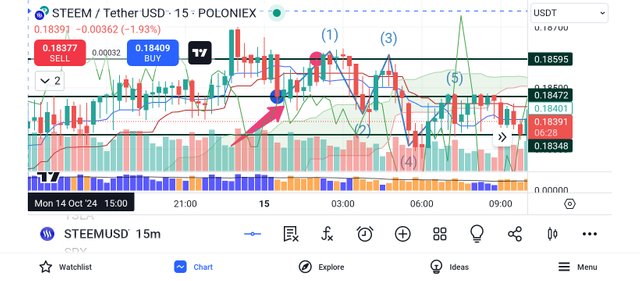
This strategy involves buying and selling according to the nature of the trends, looking at my chart buying is supposed to take place at the level of 0.18472, as it is clearly marked out when the trend went out your sell at 0.18595, at this point the trader have made a profit according to the leverage Been used at that particular time.
Trend's moved in Zig-zag form spotting out various key buying and selling zones, remember stop losses are set below the support level, while Take-profits are placed at the resistance arena, for the line crosses you saw in the chat as senkou spanB, and Kijun-Sen crossed price went up.
The Chikou span line was lagging looking at the chart, the trend was showing uptrend, while the Chikou span line was busy lagging behind, showing downtrend while the crossing tenkan sen and Kijun-Sen is uptrend in formation.
Forecasting Future Price Movements Using the Ichimoku Cloud.

Forecasting the future price of steem using the ichimoku cloud, we need look out for the higher time-frame, in here I navigated one hour Time-frame, in trading higher time-frame determines what happens in the lower timeframe.
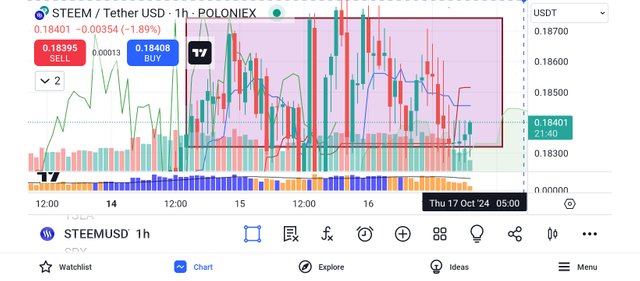
Looking at the chart STEEM will go up, from the resistance level there is an upcoming occurrence of a higher high formation from the support level, this is a good omen for steem moving forward.
Trading is Forecasting it can go through for you or even go against you it depends on your level of understanding, looking at the senkou spanB and senkou spanA, the forecast suggests that STEEM will go up in price movement.
At the time of writing this post STEEM price is at 0.18 which means if you have 100 steam you will be exchanging it for around 18 USDT, steem will accelerate forward in price, I also observed something within the years expecially during November December there is always an upsurge considering the overall price of steem.
@tipu curate
Downvoting a post can decrease pending rewards and make it less visible. Common reasons:
Submit
Upvoted 👌 (Mana: 2/7) Get profit votes with @tipU :)
Downvoting a post can decrease pending rewards and make it less visible. Common reasons:
Submit
This post has been upvoted/supported by Team 5 via @philhughes. Our team supports content that adds to the community.
Downvoting a post can decrease pending rewards and make it less visible. Common reasons:
Submit