Thank you very much professor @kouba01, I really learnt alot from your lectures I really appreciate
Introduction
What is the relative strength index [RSI] and how it can be calculated??
Nice question I really love this relative strength indix [RSI] is an aparatus that is used in analysing price changes, it can also evaluate the different price tag in stock and other vital assets too in general, this particular aparatus/indicator was invented by a man called #j-wells-wilder-jr in the year 1978, honestly I wasn't born at that time but that's the essence of history it keeps us together.
Applying [RSI] requires the use of experience technically in order to get the actual measurement, also the length of the price that can change overtime, the overall use of [RSI] contributes to over 80 accelerated indicators practically RSI commands a strong security architecture that is very important regarding the trend of price of assets
important points to Note
[RSI] is a well known oscillator that was invented in the year 1978, I earlier stated this
It gives room for the provision of signs for traders about bearish in price acceleration, graph's are also plotted in order to know the various price of assets.
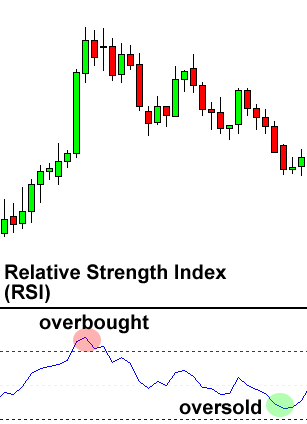
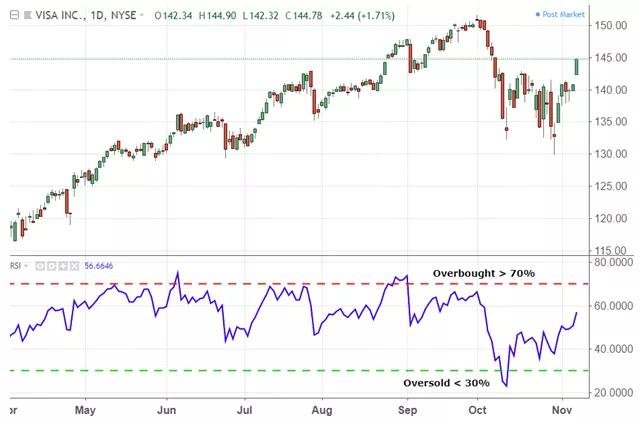
Some assets be it fixed/flexible assets usually are regarded as overbought, whenever [RSI] is greather than 80%, and are sold overboard whenever it is lower than 30%.
How it can be calculated
Over all relative strength index [RSI] is galvanized with double-part and it's been calculated with the following formula
RSI = 100 - [100/average/average loss]
Any miniature profit or loss involved in the calculation is the half percentage acquired or the loss during that particular period of time, the formular as you can makes use of an additional value for the average loss that is been recorded.
If 13 to sum up the initial [RSI] value for instance there is a close and upgrading occurs from six of 13 days, out of the 13 days you made an average profit of 1%, the remaining 12 days all your transaction will lack behind and there will be looses of about -0.07%, approximately. Now in calculating for the very first time the [RSI] will appear like this
156= 100 - [100/1%/13]+1/[-0.07%/13]
Initially 13 data time is available, and the initial part of [RSI] formula is perhaps calculated , the second parts will help make the result to be an eazy one using the formula below
- RSI = 100 - [(10/previous avarageGDP)]/[(1+ previous average GDP)]
Using the above formula in calculating RSI , the straight line that bisects the graph is plotted across the price tag of assets per say. Thereby giving an uprise in the various size of the increase in the number of assets prices. The looses too will further be identified. This calculation bootress the result this the RSI will be closer to 100 or NIL in the trading market.
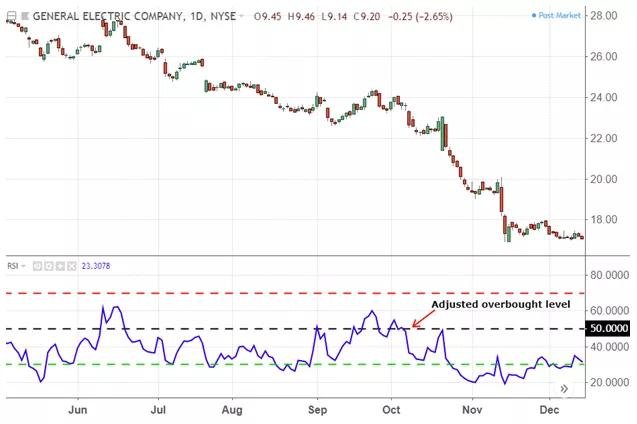
In the above trading chart looking looking at it critically you will surely understand that the RSI shows that the overbought section was shifted, while the various stocks remained Constance, the oversold part will be there for quiet a long time, this always happens in a down-ward trend of price.its very important so many people finds it very difficult and confusing.
Using overbought this over-sees the Different proportionality of the trend of prices. this is basically centralized on trading signs, and there are plenty/Different techniques that conforms to the already existing trends thereby using a signal like Bullish as I may call it, it avoids fake news about [RSI],
Note when RSI outclass vertically, 40 of the reference ground it can be Bullish meaning that the signal that it gives will bend down-ward horizontally to a point.
You can analyse RSI in another Different dimension if it's value is 80, or 90, and so on the overboard will then be overrated and may be forced to a point where the trend might reverse and the price tag will be affected massively.
can we trust the RSI on crypto Trading and why???
I really love this question and to answer it straight I will say yes, talking about trading using crypto let me use Etherium Decentralized for example, ever since it came on board since 2015, it Drew many people attention. Although so many people attributed trading Etherium to perhaps only trading it's token not knowing that trading it's value too is important.
Talking about trading RSI in crypto Trading there are some vital things you need consider
The way you cherish to trade any crypto of your choice is important.
Study and know how the crypto you choose to trade how it works.the key Difference let's take Etherium and ether, study how this both works.
know the various key factors that influences their price tags.
You should be very familiar with studying [RSI] price tag, regarding the various information that is made available by the indicators and the trading charts as well. All this things should be noted by you.
You following market trends all boils down to the RSI that you are trading be it #Etherium or Bitcoin. All this will convince you to trusting RSI in crypto trading.
How do you configure the RSI indicator on the chart and what does the length parameter mean? Why is it equal to 14 by default? Can we change it? (Screen shots needed)
I will be highlighting the different steps on how to configure RSI indicator on chart, but let's also remember that it's not only indicator that can be configured using RSI
If you logging into the app at the bottom part click chart. /Trading view App.
You will see BTC/USD choose the both, thick then all.
After which return to the main page automatically.
Downwards at the bottom part search for RSI it will pop up.
RSI graph will then come up, since it's only it you searched.
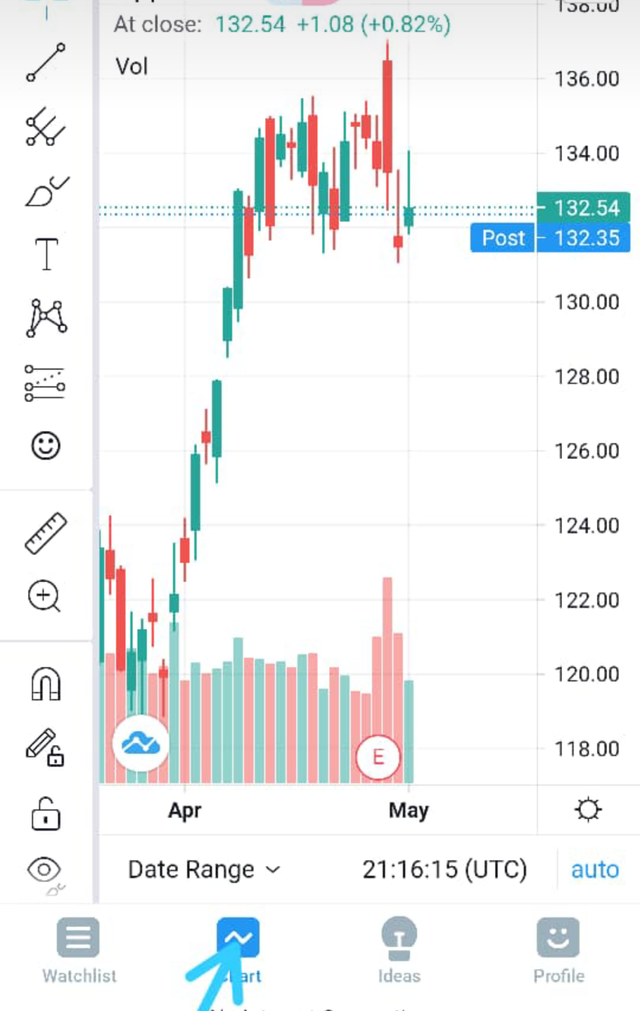
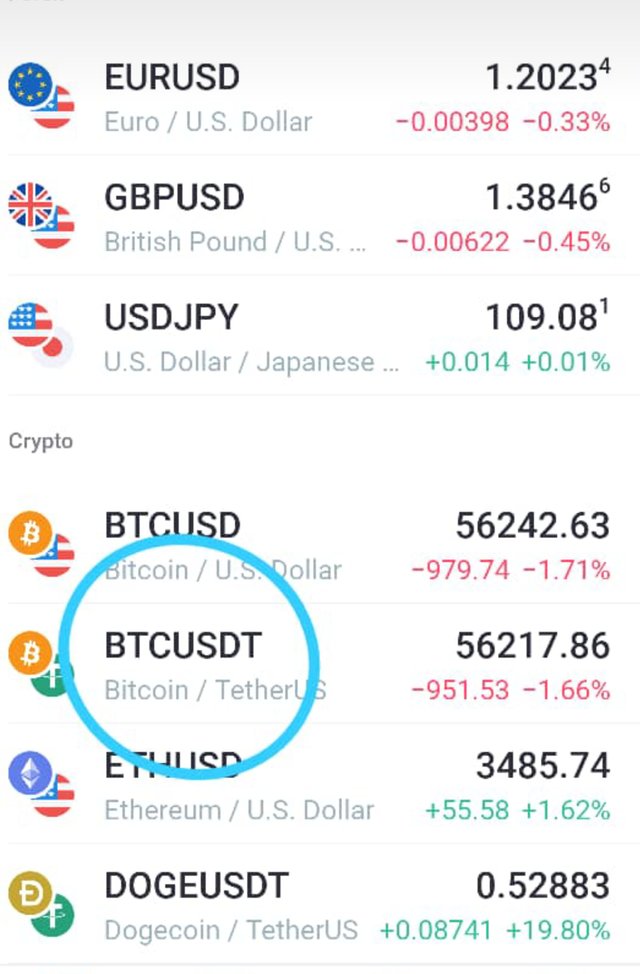
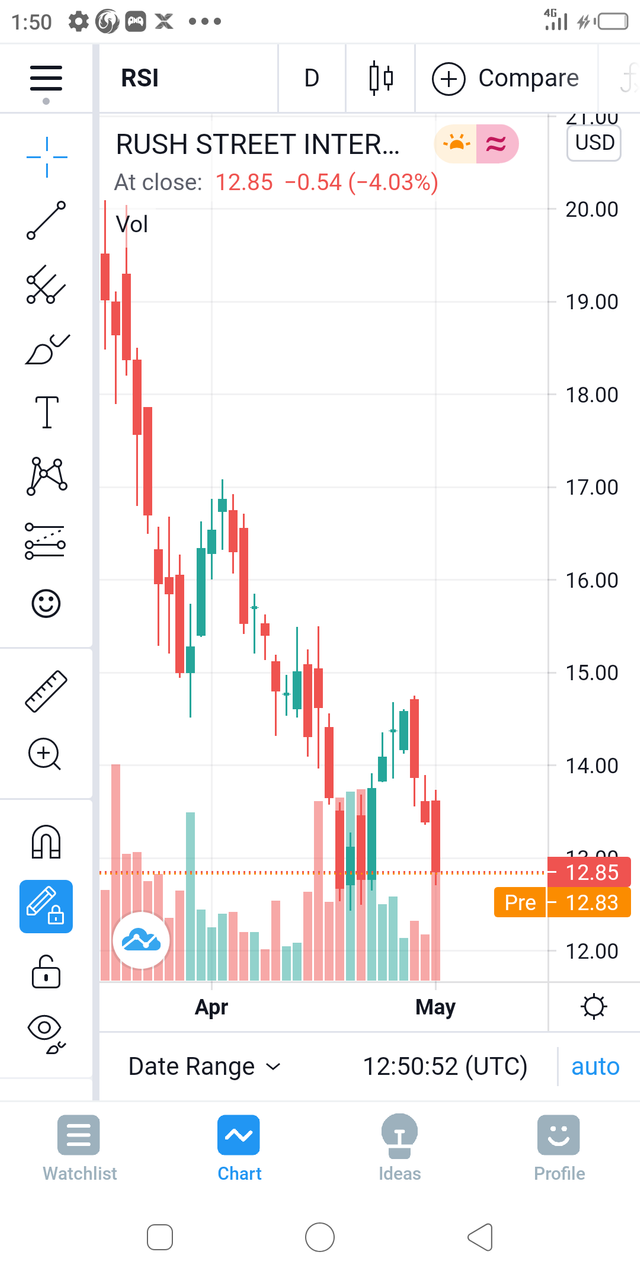
what does length parameter mean??
Length parameter simply detects how consistence RSI will appear, and also how facilitating it will be when market changes in it's condition thus the flautuation of market prices. We also have the period length setting which is equivalent to 14.
why is it equal to 14
When RSI is been set in a shot period, it will adhere to a higher value [above 80-90, but it must be below 20, and not 14] generally it will appear never to be stable,
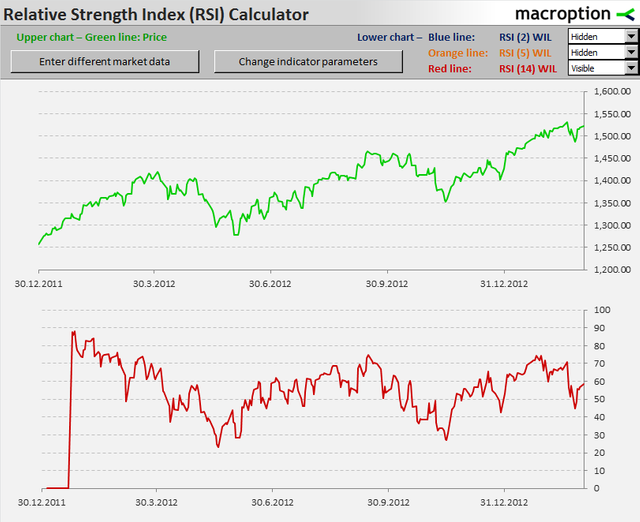
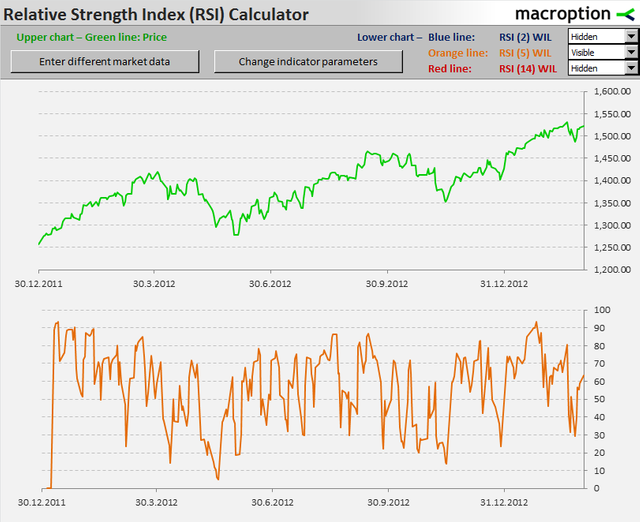
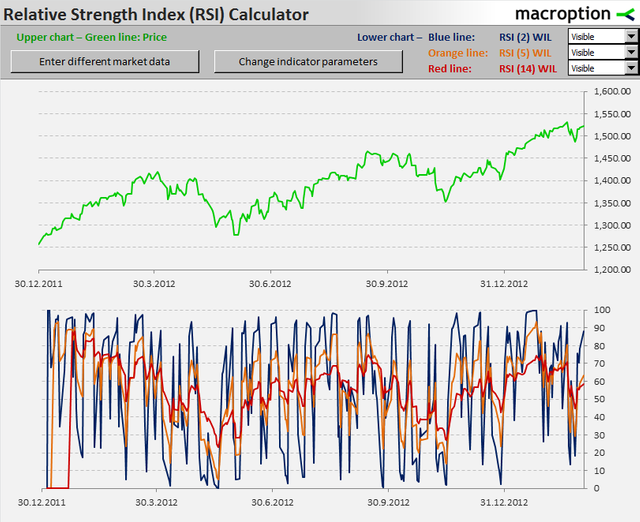
This RSI with period 2, from the diagram you can see that the RSI moves toward 0-100, it's very clear
If the RSI stays longer the RSI chart will seemes to be more rigid, in their chat. From the image the chart with RSI 14, and RSI 30, is vital to read the chat and understand it more better.
How do you interpret the overbought and oversold signals when trading cryptocurrencies? (Screen capture required)
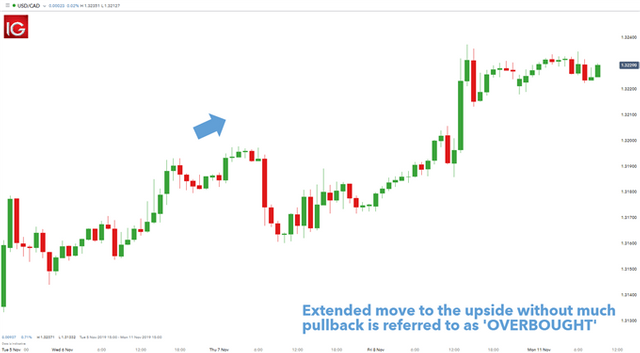
Overboard
I really like this question overboard simply means the point at which there will be an uprise in the transgression uprise in the price of assets, within a particular period of time. You will be able to detect when prices swing left-right center.
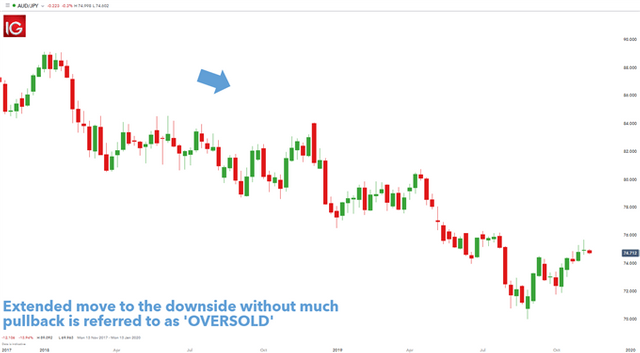
Oversold
This simply identifies the timing at which the price of good goes down, down, downwards thereby making the price of goods not been regular, at a particular period of time. It practically swings from left to bottom right view the snap shots below.
Prices of goods can't move in a linear/straight line all the time it will surely take a U-turn sometimes, sometimes there is a huge return in investment if you invest direct in this case please use oscillator it will help in a very long time interval. It will help determine when changes comes to fruition.
How do we filter RSI signals to distinguish and recognize true signals from false signals. (Screen capture require)
It's very eazy to filter RSI signal first if you are trading you must not focus on one path alone combining and studying the both indicators will help you filter signals, and you will be able to detect true signal, and false signal too as well.
Key attention must be giving to signals that other indicator gives note that false signal bisects the traders mindset because the trading market will perhaps be moving toward one particular direction what you need is to keep a Keen eye courtesy the fact that everything might end up in the opposite direction.
Trading market is very big where billions are traded worldwide, the both signals contributes to the desentrigration of the level of resistance, it's supporting index is characterized by the conjugating maximum dots of prices.
Review the chart of any pair (eg TRX / USD) and present the various signals from the RSI. (Screen capture required)
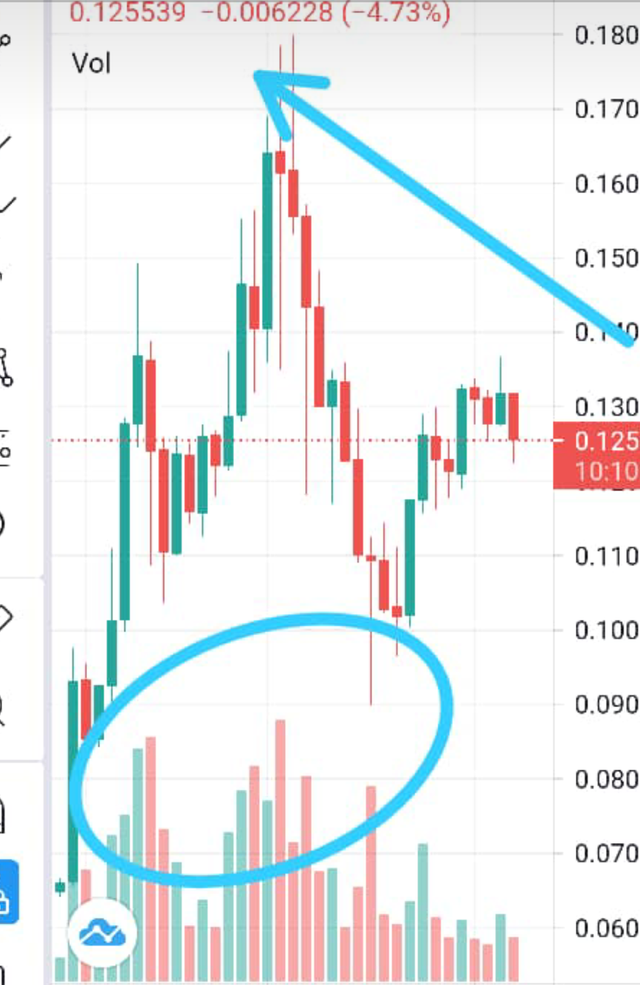
In the image below 0.1255 signal prooves to be oversold and 0.06228 proves to be overbought that's why we have a negative sign of percentage across board. It's really nice to make a concise study about various types of cryptos and how they are.
Conclusion
Thank you very much professor @Koubao01 I really learnt so much from your lecture thank you very much boss
Cc:@Koubao01
Hello @kingcent,
Thank you for participating in the 4th Week Crypto Course in its second season and for your efforts to complete the suggested tasks, you deserve a 5/10 rating, according to the following scale:
My review :
Average content, you did not succeed in answering all questions, which is due to the rush to answer them. You also provided many charts that do not include the RSI. I liked the way you compare periods to show how important this parameter is.
Thanks again for your effort, and we look forward to reading your next work.
Sincerely,@kouba01
Downvoting a post can decrease pending rewards and make it less visible. Common reasons:
Submit
Thank you very much for visiting....
Downvoting a post can decrease pending rewards and make it less visible. Common reasons:
Submit