 The background is from picsart and I made this design

Explain Price Bars in your own words. How to add these price bars on Chart with proper screenshots?

In this discussion, it is very important for this Cryptocurrency Pattern in terms of us using it where we ourselves will be able to find a great opportunity for success when we play on the crypto market itself.
These patterns for ourselves can be used forever for us to analyze on a technicality for the purpose of being able to identify trends in a crypto market, lest we neglect a trade that we have opened, in addition to being able to predict from a price action on the asset. and we also make decisions about what we will do on a trade, whether we will sell the asset or wait for the market to rise sharply so that the peak can sell it and the profit will be big.
The price bar is one of the forms of a pattern where the asset is the most famous and also the most widely used before we recognize a candle stick pattern that we use today.
Where we will also find out where the price bar can visually occur by depicting a symbol consisting of various OHLC data which means (open, high, low, and also close) which we use to describe an action that will take place. we take in a crypto asset price with a certain period of time that we will use.
In other words, this price bar has a good picture of how the price of an asset moves, specifically where in a certain period of time on that asset.
Now in the picture above we can see that each bar at this price usually shows the price will be an open, high, low and will also be a close.
In this discussion I often use tradingview, for a win this process is very simple.
- first you have to enter the application or tradingview web, then I open a market chart on a crypto asset that I will use for this process is BTCUSD, you can also use other crypto assets.
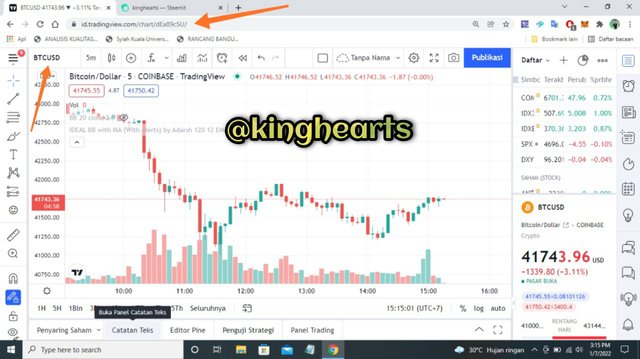
- After you open the chart of the BTCUSD asset then move to the pattern column which is located at the top of the chart then click on it. You can see in the image below.
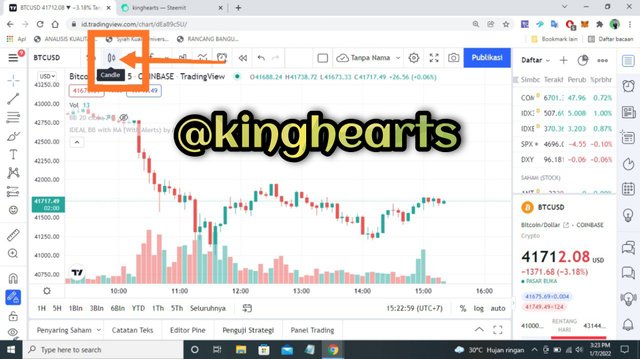
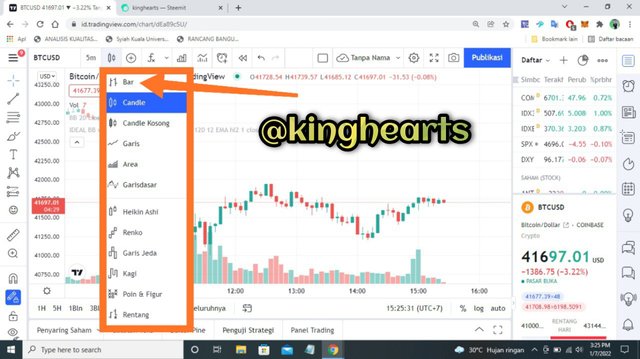
- Immediately for you to click on it, a list of patterns will appear with the price bar section above the list, because in this case I will use the price bar to be able to analyze the movement of a market, and we simply click on the bar column as shown in below.
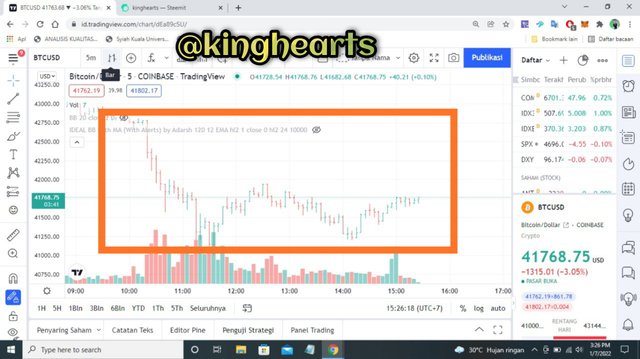
- After you click on the bar column, in my chart pattern now it is enough to activate the price bar as you can see below

How to identify trends using Price Bars. Explain for both trend. (Screenshots required)

For a market trend is a condition in which we all love trading to be able to carry out an operation, where at the time of its own initial entry in a trend it will usually leave a good profit on that trend and a very good one.
To be able to identify a trend on a bar chart, it is the same as on a candlestick chart. Where in the first thing we will have to do is we have to be able to identify ourselves in a series of bars which will move in the direction that is often dominant.
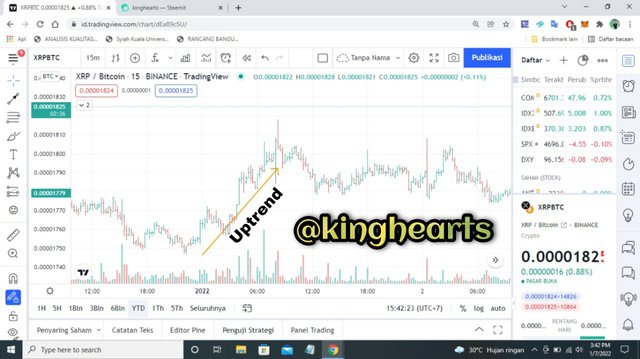
- Uptrend: An uptrend is a trend which is similar to a chart that can result in prices getting higher and higher lows and higher lows, in which case this bar can be expected to make a the closing value of each candle which during this uptrend usually makes it higher than the value that was at the previous close.
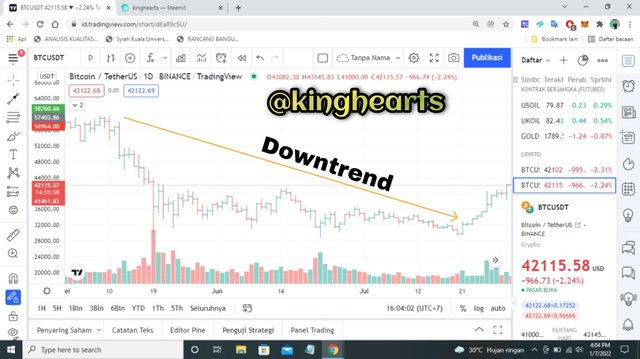
- Declining trend: With this we can see a similar way as before, where we can see that this downtrend has been built by a high price and also a low value where the price is getting lower and it can also be denoted making it a fact that rather than closing the bar is just getting lower than it was before.
But it's impossible of course, as we know with all trends, this is not a fact which makes it to be completely accurate on a bar chart, because there must be a pullback or also a change in the asset in the trend.
Therefore we can also see on this bar chart that it can easily predict its own diagnosis through the closing results on each bar to identify movements in the current trend of an asset.

Explain the Bar Combinations for Spending the Day inside for both conditions. (Screenshots required)

In this discussion, we must have known that in an asset there must be two scenarios that have occurred and even then, it is certainly different for an asset. Which two things are as follows.
- at the time of the High bar with a new price that is lower than the previous price bar
- when the Low of the bar with the new price is higher than the previous price bar
We can't predict it in a trend, but it will depend on the market that is going on, which can also be seen in both a bullish trend and a bearish trend.
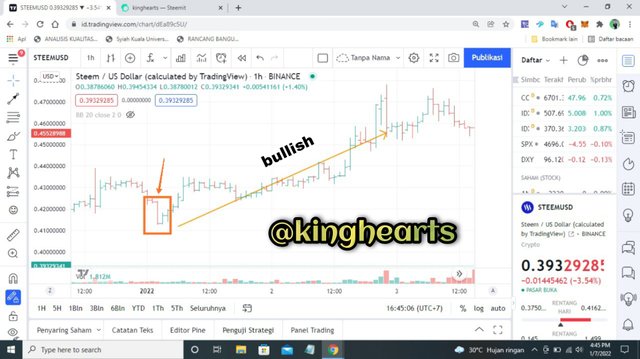
In this case, a bullish trend occurs, where this trend will be formed when the price bar has formed an opening which is the closing of the previous price bar, where the closing itself in this case goes up but is still below the highest price than the bar. the previous price.
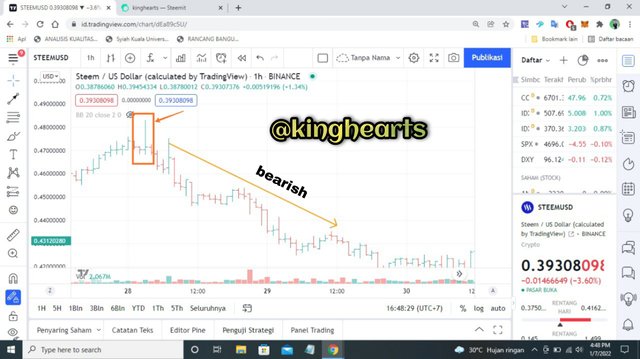
In this case, a bearish trend occurs, where this trend will form when the price bar has formed a close at a higher price than the previous price bar and at the time of the open in this case it occurs when it is found to be down and also at a The low here is clearly above the previous low of the previous price as well

Explain the Bar Combinations for Getting outside for the Day for both conditions. (Screenshots required)

- on Exit conditions for today for a Bullish trend
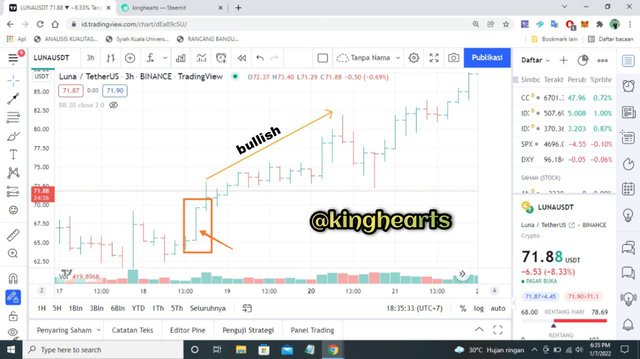
For this bullish condition, we definitely know that while looking at a formation which will get outside for today in a scenario we will have; which will Open at the low and and also later we have at the close at the high. Now in this case, the formation that will indicate a new event which will be specifically inspired by a rise in the market. We will always see that outside the market it has formed in an uptrend formation; which has suggested for a reversal or continuation which will depend on an open location as well as a close location the direction of the asset trend itself.
- in the Exit condition of the day for the time of the Bearish trend
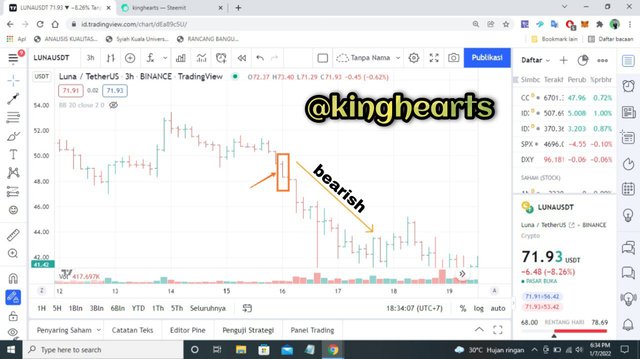
Open on the high and also when we have the closest on the low. In this case too, for a formation which will indicate new events in particular as well and will be inspired by a downturn in the market. We have seen that to get beyond the market that will form in a bearish trend, have suggested for the trend to be a reversal or to be a continuation in the case of an uptrend or also to a downtrend respectively because it has a high definition which is more high and also already has a percentage that will basically conclude that it is higher, that is, if later the closing is at the highest position.

Explain the Bar Combinations for Finding the close at the open for both conditions in each trend. (Screenshots required)

In the discussion of this point, we get a bar pattern where at the opening and closing itself every bar must occur. The trader can then immediately observe the structure of the market behavior and also immediately to gather information about the continuation how we can identify each of these trend patterns and more importantly how the market behaves commensurate with a redundancy itself.
In this Uptrend section, it is easy for us to determine by observing and also closing the point itself, because when we immediately open and close what happens very close to high, it will make us to emphasize a movement that is sustainable in nature. a bullish trend position and if we also open and close to approach the low, then later on there will be a reverse ith itself in the uptrend.
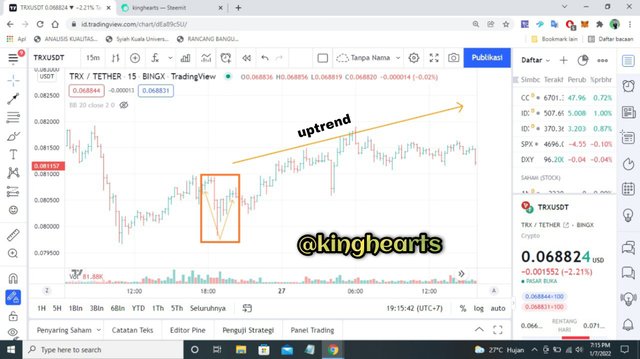
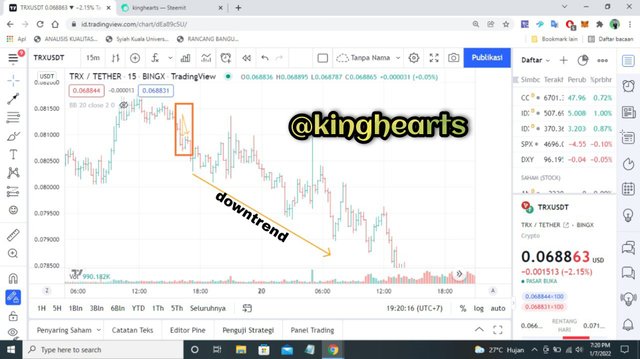
When a downtrend from the close is being observed at any time the open and at this close is very near the low which has indicated a continuation in the descending trend and when an open and close is close at the high it can indicate that there will be a reversal in the event of the downtrend.

Conclusion

In this lesson I have learned a lot about the price bar formation which represents the price from the open, the price to the close, the highest price and also the lowest for an asset that we are looking at. Which is very useful if we use it to see an asset so that there is no loss in a trade.
Thank you very much to professor @sachin08 for the valuable lessons this past week, hopefully in the future the discussion will be even more great and can make many people understand the crypto market.
Thanks For Visiting My Post
Best Regards
@kinghearts
.jpeg)
Downvoting a post can decrease pending rewards and make it less visible. Common reasons:
Submit