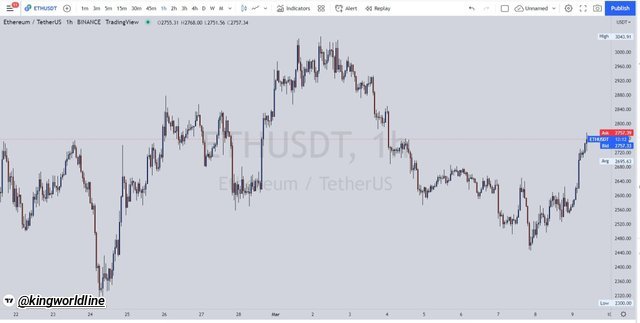


THE CHART
A chart is that graphical presentation which goes alongside with the data and information with respect to date and time, hence this is used to express the structural view of the visualise illusion.
Meanwhile in finance trading is known to be graphical representation of price, market data, date and as well time.
Tradingview
Hence in the world of finance has different chart used in presenting data which are as follows
•Candlestick chat
•The bar chart
•The Hekin ashi
•The line chart etc.
The chart is known for its use in the financial world of trading in terms of carrying out analysis and as well in making prediction and sentiment.
THE CANDLE CHART
The candlestick chart is that type of chart which is used in carrying out analysis, meanwhile it is widely accepted than others in carrying out analysis and mostly used due to the fact that is simple and easy to interpret it, this is accepted due to the fact that It can accommodate little noises, the date and time which is as well can serve in the fluctuation of the price action in the market towards the bullish and as well towards the bearish.
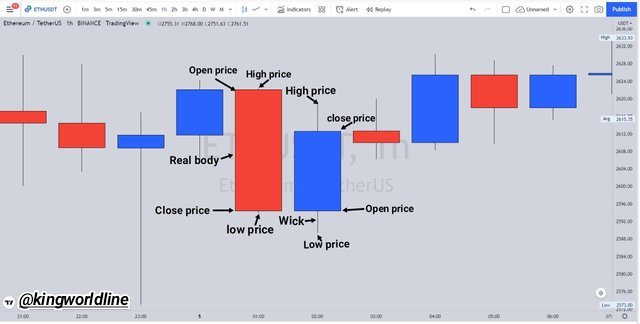
Structurally this candle consists of the body, upper and the lower wicks the open and close the high and low and as well the full entire body as shown below.
Tradingview
THE TIME FRAME
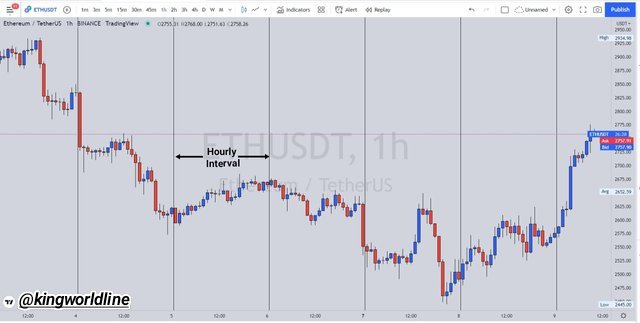
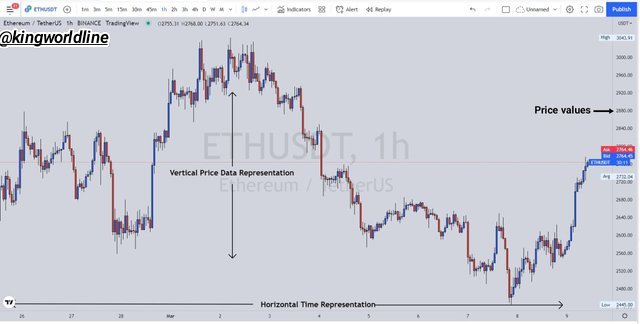
The time frame is actually the interval along side the candle of which the candle or one or group of candle can represent, meanwhile time frame actually overs the interval with respect of the price actions in the market
Hence the time frame can come in different forms along with candle representation which can be of 1 year, 1 Month, 1 week, 1 day, 1h 30M, 15M, 5M 1M etc.
Hence the time frame is so essential in terms of structuring and telling you what a mark was like. Hence a time frame frame can be of your choice which could be a day or weeks as the case may be.
Below is the time frame of 1 hour


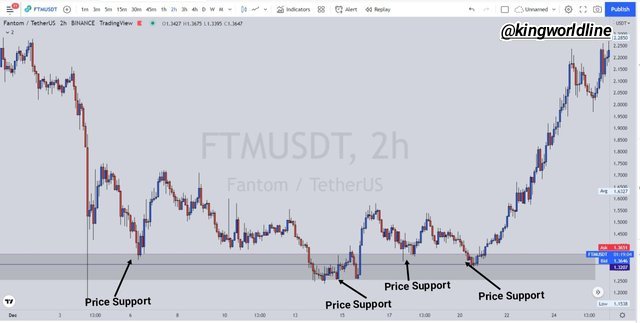
Hence the support and the resistance are two opposite zonal point in a chart where the price action got retraced with the boundary of the support and resistance, meanwhile the Support zone is known as the zone where the market trends tends to reverse from the bearish towards the bullish, meaning that the market was over taken from the seller to the buyer, hence the point of this intersection is known as the support zone.
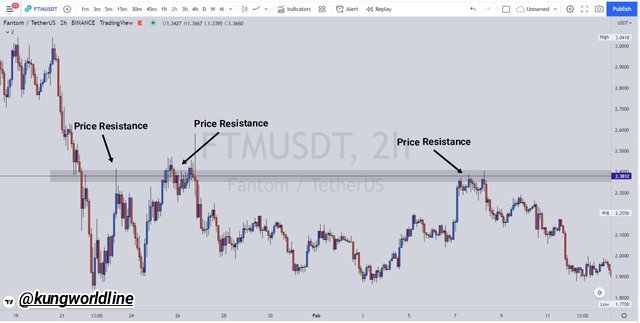
Meanwhile the reverse of the Support is that of the resistance level this is where the price action tends to reverse towards the opposite direction from the bullish towards the bearish with involvement of the buyers to the sellers which came as a result of overwhelmed pressure from the seller to over shadow the buyers.
Hence below are screenshots of the Support level and as well the resistance level on a chart
Hence aside the horizontal Support resistance, this is another known as the Dynamic resistance of the support and as well the resistance, hence this is a line below and above the price action which can be a incline or decline form.


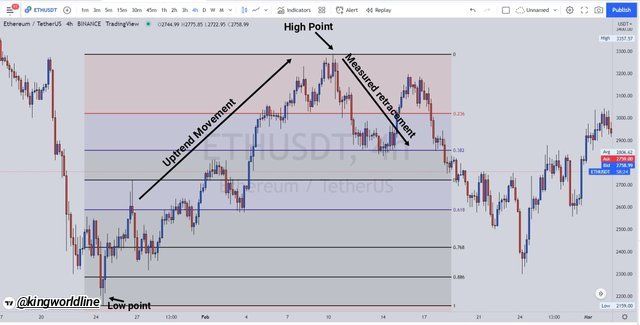
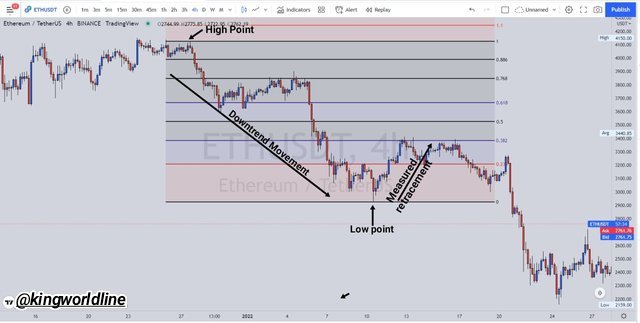
This is used in terms of technical analysis in search of the points of possible price reversal, the Fibonacci retracement have the following levels of 23.6%, 38.2%, 61.8 %, and so forth.
Hence this is used in identifying the resistance and as well and as well Support after retracement.
Hence below is the screenshot of Fibonacci retracement for that drawn from the support to the resistance zone.
ROUND NUMBER**
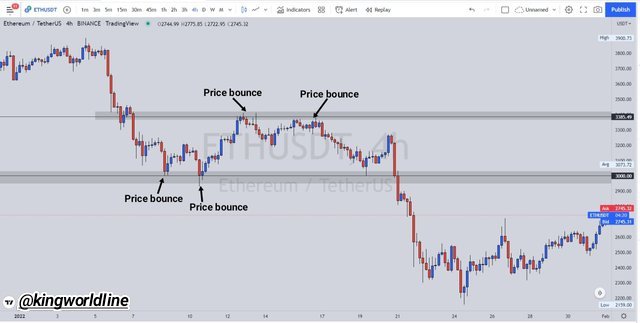
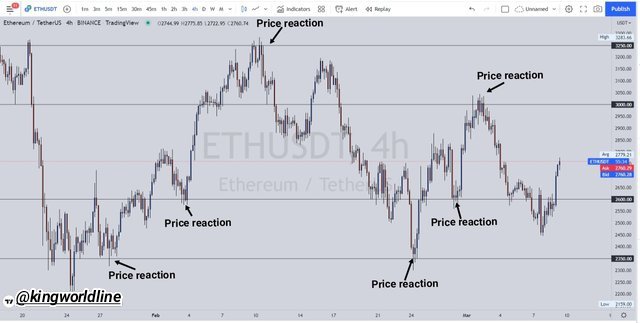
The round number is another kind of strategy on its own which is used in terms of identifying possible price reversal, hence this is estimated at round figures like $1.000, 1.500 and 1.600 and so on.
Main looking at the chart below, a couple of round numbers in a horizontal lines, at the screenshot the first was 3,250.00 and we can see clearly that the price has reverse twice within that limit, hence in the other end is the last line at the price of 2,359.00 , hence we can observe 4 times reversal as shown in the below screenshot.
Tradingview
THE ACCUMULATION AND DISTRIBUTION PHASE
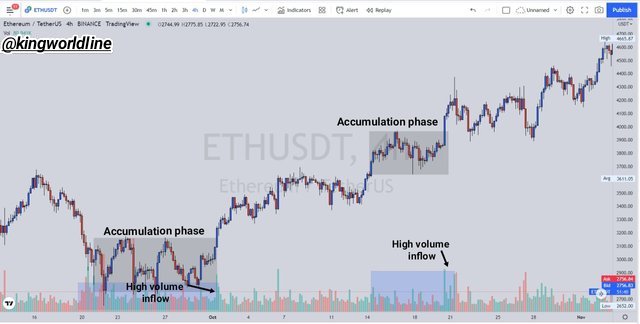
The accumulation and distribution phase is the phase in market where there seems to be a pause and ranging in price before reversing towards the opposite direction, hence that accumulation phase alway takes place at the bottom side of the chart which come after a lengthy bearish trend, hence it is as the result of the strong upper hands in the market which aim to induce the smaller traders with the aim of hitting them hard with retracement of the price back to the opposite direction.
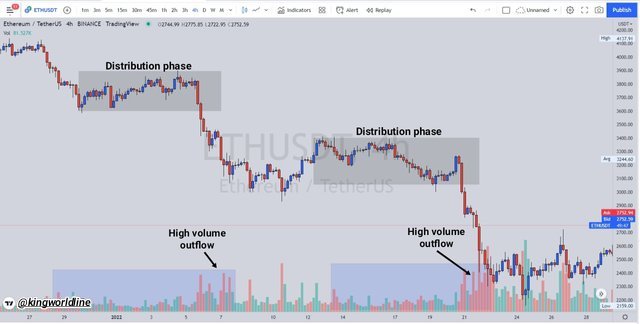
Meanwhile on the distribution phase occure at the top of chart, hence this also comes after a lengthy bullish, hence this is caused by strong hand in the market where the aim as well is to deceive the and collect the retailer interest by tricks, while the price retrace back to the opposite direction.
Below is the screenshot below of the accumulation and distribution phase and as well the volume associated with each with respect to time intervals.


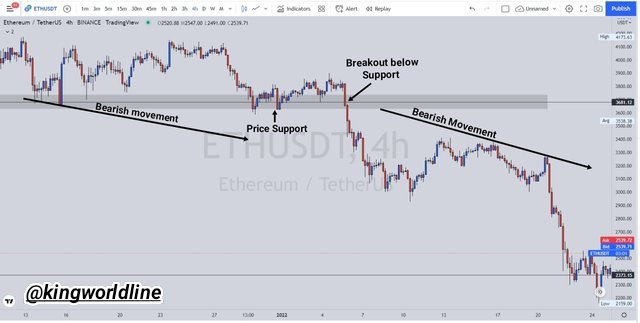
The renounce is often seen and observed in a chart from time to time since the market is structure is situation as trading of pressure goes from the buyers to the sellers, hence the market is set move in sinusoidal pattern, hence the market are set to experience bouncing within a price range of the resistance and Support zone, hence the movement of the price action from the up to down and to the up is known as rebouncing, hence this happen within the boundary of the resistance and the support zones without breaking any of this range.
The breakage of these range occurred whenever there is nothing like breakage of price with it range of resistance and Support zones, hence when ever this happen at suport zone is said that the Support zone is broken in the downward direction, the same to the resistance, when the price breaks the resistance we said that the resistance zone has being broken in the upper direction
All this illustration is shown in the below screenshot.


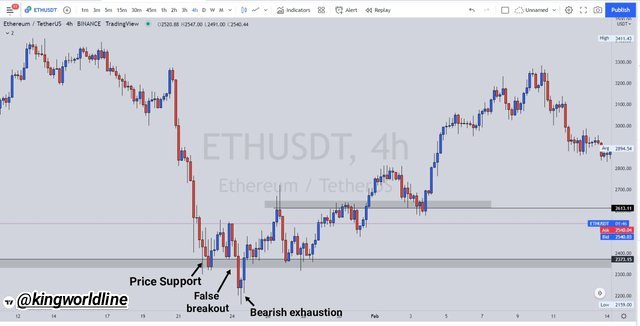
False breakout is opposition to a successful breakout, hence this is the breakout of market price or the break out of support or resistance zone by the price action which get beyond it range and retrace back to the track of the price range, hence this is a strategy abducted by the professional to snatch out earning from the retailers.
Hence viewing the chart below, we can observe the rebounce of price action within the resistance and Support zone which at a breaks the price range and retrace back to the range which is know as the false breakout as shown in the below screenshot.


UNDERSTANDING TREND TRADING
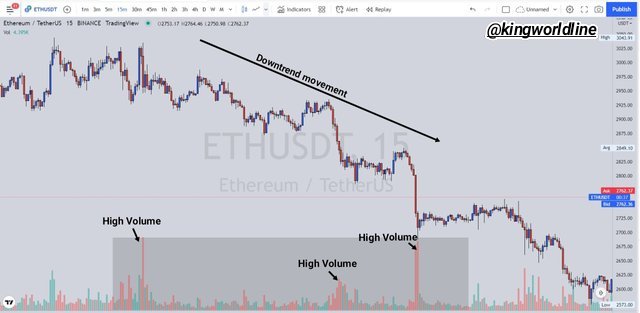
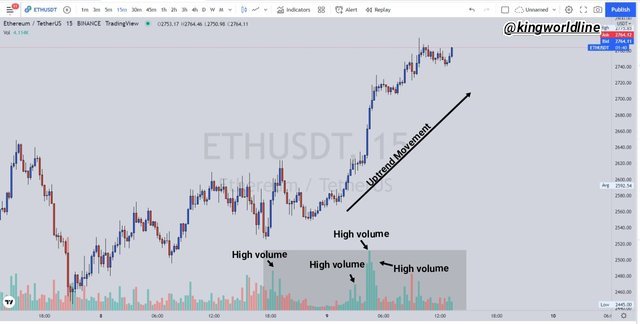
Hence trading the trend with that of the principles of demand and supply is more like trading method which goes along with development bof price along m with the time interval, meanwhile the price movement work based in the law of demand and supply which states that " the increase in the price of an asset is initiated from the demand of asset traded" meanwhile the "decrease in that of the price of an asset is set and initiated by by that of the supply of the asset being traded, hence the higher the demand as well the higher the price and also the higher that of the supply also the lesser the price of that asset becomes.
As shown in the screenshot below the higher the up trend becomes, the higher the price becomes, hence this means that the demand is higher than the supply asset, graphically it means that the increase in the volume in the bullish candle is the other way less in the volume of the bearish candle as well as shown on the below screenshot.
Tradingview
On downtrend the decrease in price of an asset means that the supply of the asset is higher than the demand of that of the asset order, hence graphically this means that there is increase in bearish volume than that of the bearish candle meanwhile in the bullish candles which is lesser by in volume as shown on the below screenshot.
Hence, is ideally to be after trends which actually plays well toward our prediction and sentiment in the market.
ENTRY AFTER A PULL BACK
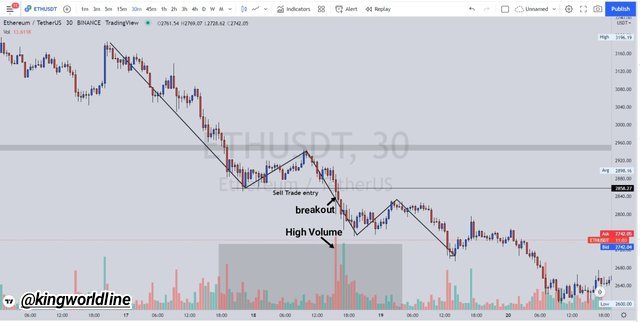
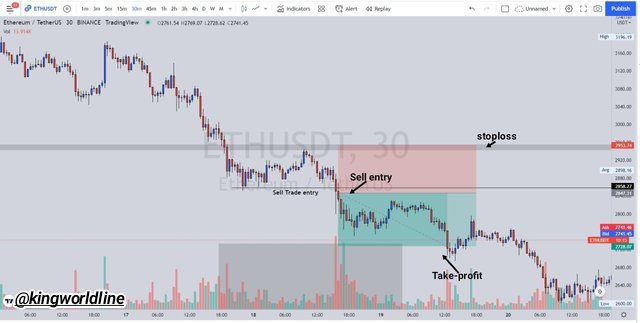
The pullback made for the already established trend, hence we have to be patient to the pull back of the trend, the next thing is to check out the candle with a high volume and as well volatility which is in accordance with the trend then we make our entry there.
Hence the entry point is main to be after the breakout of the previous high with a stop loss above the entry point with take profit below of the entry point, as shown on the below screenshot.


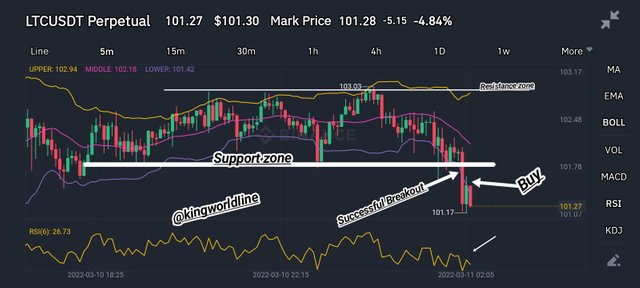
On this screenshot I will be illustrating the currency pair of LTC/USDT on a 5M time frame alongside my indicators to make confirmation of this before executing the trade.
Screenshot from Binance Exchange
Hence according to the screenshot above we can observe the rebouncing of price within the two boundary of the resistance and Support zone which is formed by the action of the price in movement, hence in these was a trend of the price action towards the bearish side which breaks the Support zone making a good successful breakout
With assistance of the indicator of the RSI and Bollinger band was all in confirmation to towards the successful breakout of the Support zone in their unique way of operation.
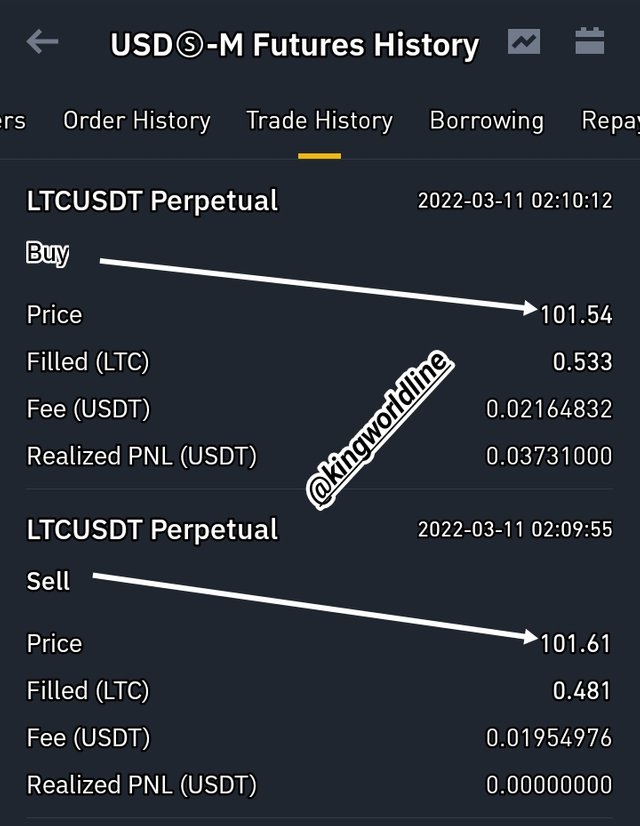
In the breakout I was able to make an entry at the price of $101.61 after the breakout with aim to sell ( SHORT) and buy at the $191.54 to exit from the market, realizing a profit of $0.03731000 of which my trade was successful.
Here is the screenshot of the entry and exit point with other various parameter involved as shown on the below screenshot.
Screenshot from Binance Exchange


Hence in these post I was able explain the chart and it importance in my own understanding towards the financial trading, again I was able to explain the basic uses different candlestick which are utilized by traders along side with the time frames.
In the Support and resistance zone, I illustrate how to identify them through the help of Screenshot, alongside with rebouncing of price and breakout of the Support and the resistance zones.
Lastly I was able to illustrate this by analysing the DOT/USDT token before executing a real trade with my entry, stoploss and take profit, which came out with positive dividend.
Thanks for reading...
Am: @kingworldline
Cc: @nane15
