
Source

Give a detailed analysis of BICHI STRATEGY. Starting from introduction, identification of trends, trend reversal in market, entry and exit from the market, one demo trade and finally your opinion about this strategy. (Screenshot required). [4 points]

Introduction To The Bichi Strategy
The Bichi trading strategy is an interesting trading system that has been intelligently developed by professor @utsavsaxena11. Actually, it is a system which works by identifying some key structures of confluence between the Bollinger Bands and the Ichimoku Cloud to predict possible market movement especially on a short-term basis. Interestingly, this combo serves to give an analysis of the prevailing momentum of the market. Equally, it gives a sense of the strength behind such momentum.
To better understand the strategy it is necessary to first come to terms with the two systems for technical analysis that have been hybridized to produce this wonderful system: the Bollinger Bands and the Ichimoku Cloud. The Bollinger Bands work by providing support or resistance to the price action. The Bollinger Bands trading system consists of three trend lines that are plotted away from a simple moving average by two standard deviations of the price of an asset. This can actually be adjusted based on the preference of the trader.
Our interest in the Bollinger band for the Bichi trading strategy boils down to the middle band which is a simple moving average. This middle band would act as a baseline which when respected confirms a trend in a particular direction. For instance, in an uptrend the price is not expected to go below the middle band. In the case of a downtrend the price is not expected to go above the middle band. Hence, in the two respective cases it acts as support or resistance respectively to confirm the presence of a trend in a particular direction.
The Ichimoku Cloud, on the other hand, is a tool for technical analysis that was developed by Goichi Hosoda, a Japanese trader that came up with the system in the late 1960s. The Ichimoku system on its own can identify areas of support and resistance while giving a sense of the direction and momentum of market trends. However, in this combo with the Bollinger bands it is primarily to be utilised as a tool to actually confirm the direction of a trend through the break out of the cloud by the price action.
Consequently, the Cloud of the Ichimoku system would be used as a tool for giving signals of trend direction. The Cloud is actually formed by two lines which are separately identified as the Senkou Span A and the Senkou Span B lines. The trend can be interpreted by looking at the location of price with respect to the cloud. It is believed that if price is above the cloud, then an uptrend is in place. Conversely, prices going below the cloud would signify a downtrend.
Ordinarily, price trading inside the Cloud identifies a flat trend or largely sideways market. Additionally, - though not explicitly pointed out by the professor in the explanation of this combo - it is possible to read off the strength behind any trend by looking at the position of the two lines that constitute the Cloud. Hence, when the Senkou Span A line is above the Senkou Span B line it is believed that a stronger uptrend is in place. The converse is also the case as in when the Senkou Span A line is above the Senkou Span B (both of which are the lines that constitute the cloud).

Identifying Trends With The Bichi Strategy
In order to identify trends with this trading system we would have to rely on the baseline of the Bollinger bands having to act as support or resistance line. Equally, we should look out for price breaking out of the Ichimoku Cloud.
Uptrend
Source
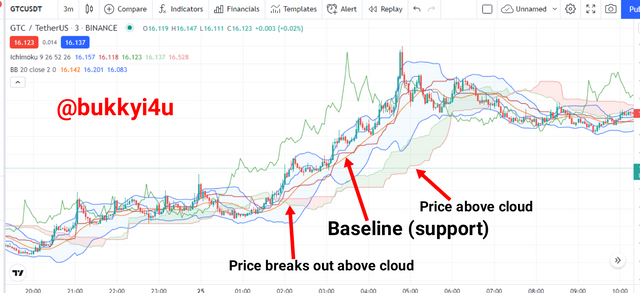
In order to confirm the presence of an uptrend with this trading system we should first check to know whether price respects the baseline by not going below it. This means that the middle band of the Bollinger bands which we assume as the baseline should act as a support for the price action.
Then, we should check to ensure that price has broken out above the Ichimoku Cloud. This confirms that the trend is going upwards. Also, the cloud should be moving in the same upward direction as the price. Generally, when the price continues trading above the Ichimoku Cloud an uptrend is still considered to be in place. This confirms an uptrend with this particular trading system.
Downtrend
Source
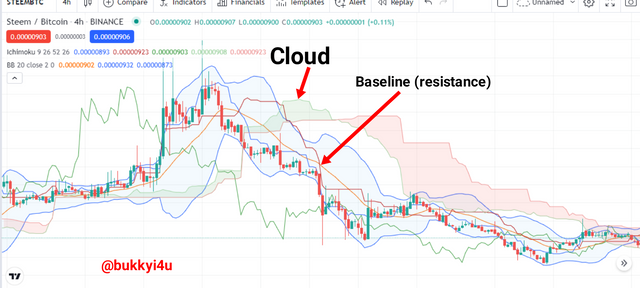
Confirming the presence of a downtrend with this trading system requires that we should first ascertain whether price respects the bassline by not going above it. This means that the middle band of the Bollinger bands which we assume as the baseline should act as a resistance for the price action.
Then, we should check to ensure that the price has broken out below the Ichimoku Cloud. This confirms that the trend is going downwards. Also, the Cloud should be moving in the same downward direction as the price. Generally, when the price continues trading below the Ichimoku Cloud a downtrend is still considered to be in place. This confirms a downtrend with this particular trading system.

Trend Reversal With The Bichi Strategy
Identifying a trend reversal with this trading system involves a number of steps. First, it involves confirming a trend with the Bollinger bands and the Ichimoku Cloud. Then, a sideways market should be equally identified. Consequently, a breakout from the sideways market (which is usually a period of low volatility) could possibly reverse the prior trend.
Bullish Reversal
Source
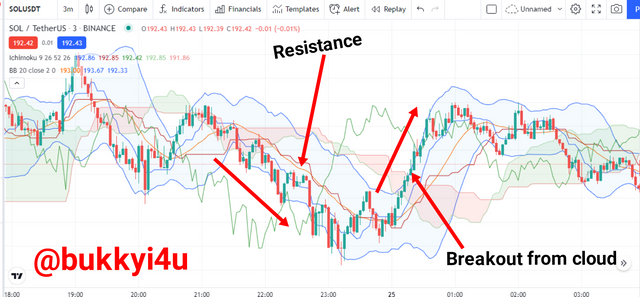
To identify a bullish reversal with the Bichi trading strategy we should first confirm the presence of a downtrend. A downtrend would be marked by the price of an asset trading between the middle band and the lower band of the Bollinger bands and respecting the middle band as a resistance level. Again, the price should be trading below the Ichimoku Cloud. Next, the market should begin to move in a period of low volatility in an ensuing sideways market.
This sideways market should be marked by the price severally breaking above the Ichimoku Cloud. Eventually, a major upwards break out of the price action above the Ichimoku Cloud where the Cloud now exists below the price action as well as the middle band of the Bollinger now acting as a support confirms a bullish reversal of the price action.
Bearish Reversal
Source
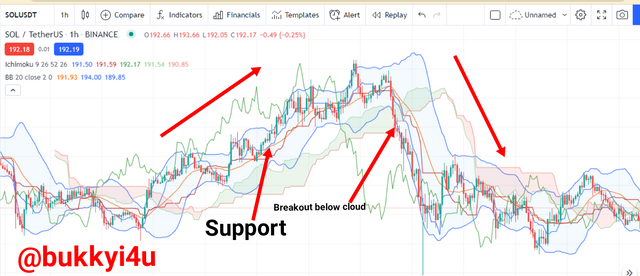
To identify a bearish reversal with the trading strategy we should first confirm the presence of an uptrend. An uptrend would be marked by the price of an asset trading between the middle band and the upper band of the Bollinger bands and respecting the middle band as a support level. Again, the price should be trading above the Ichimoku Cloud. Next, the market should begin to move in a period of low volatility in an ensuing sideways market.
This sideways market should be marked by the price severally breaking below the Ichimoku Cloud. Eventually, a major downwards breakout of the price action below the Ichimoku Cloud where the cloud now exists above the price action as well as the middle band of the Bollinger now acting as a resistance confirms a bearish reversal of the price action.

Entry And Exit With The Bichi Strategy
Undertaking an entry and implementing a subsequent exit with the trading system can be done in a few steps. This can be done differently in both buy and sell conditions or trades.
Buy Trades
Entry And Exit:-
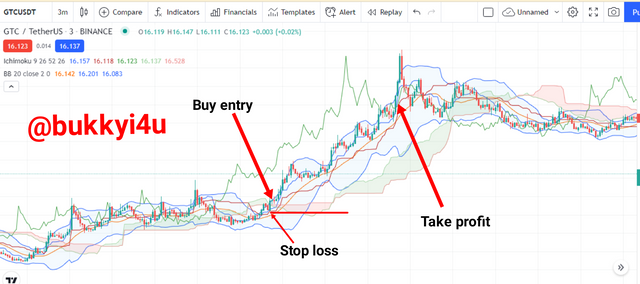
Source
In the case of buy trades we should observe the steps below in making entries and exits:-
We should first ensure that an uptrend is coming into place in which case the price is now acting above the baseline of the Bollinger bands which now provides support.
Next, we should patiently wait for the moving price action to break out above the Ichimoku Cloud
Once the price breaks out we should undertake a buy entry with the next candle
To exit the trade we should set our take profit in the anticipated direction. Equally, our stop-loss order should be placed to touch the level of the support base line below our entry point.
Sell Trades:-
Entry And Exit:-
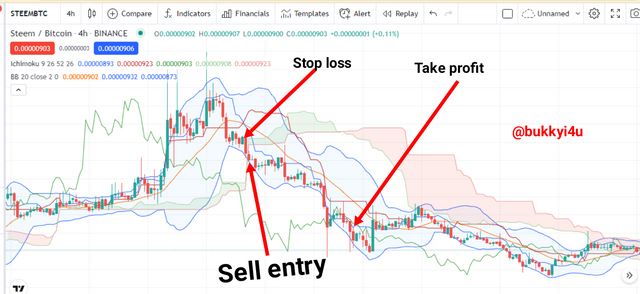
Source
In the case of sell trades we should observe the steps below in making entries and exits:-
First, we should ensure that a downtrend is coming into place in which case the price is now acting below the bassline of the Bollinger bands which now provides resistance.
Next, we should patiently wait for the moving price action to break out below the Cloud.
Once the price breaks out we should undertake a sell entry with the next candle.
To exit the trade we should set our take profit in the anticipated direction. Equally, our stop-loss order should be placed to touch the level of the resistance base line above our entry point.

My Opinion Of The Bichi Strategy
I do have a few personal opinions of the Bichi trading strategy developed by professor @utsavsaxena1:-
First, I believe it is a great strategy considering the two enormous trading systems it combines.
I discovered that a lot of patience is needed since we must first wait for Bollinger mid-band support or resistance together with Cloud breakout before entering a trade.
However, I would like to point out that price threading in a sideways condition may not necessarily necessitate it's brick out in a direction opposite to the prior trend as propounded by the theory on identifying trend reversals with the system
On the whole, I do concur that it is a great trading combination especially as the Bollinger may not properly function as a standalone tool but can work wonders with the confluence of signals obtained when using it with the Ichimoku Cloud.

Define briefly Crypto IDX and Altcoins IDX. What is signal prediction trading. Is it legal or ill-legal in your country. (Explain briefly) [2points]
Crypto IDX
Crypto IDX simply means Cryptocurrency Index and represents an asset that is created by taking the average rates of four coins which includes Bitcoin, Ethereum, Litecoin and Zcash. Actually, it is developed based on the same principles which guide the operation of indexes.
The asset factors in the parameters of demand and supply of a cryptocurrency and does not just rely on the prices of such assets. It is a synthetic asset which is internally available only on the Binomo trading platform. It comes with quite a huge number of advantages.
Some advantages associated with the Crypto IDX available on Binomo for traders include:-
- You can effectively predict its possible movement with adequate technical analysis
- It is available 24 hours for trading on the platform
- It is good and efficient for trading on a short-term basis
- It yields high percentage of gains which can be up to 70%
- With the asset you can get high level of volatility from the market on a consistent basis
- It saves a lot of time since high volatility can be gotten even for the minimum time intervals in seconds
Altcoin IDX
Altcoin IDX refers to a derivative or synthetic crypto asset which is available on Binomo. It stands for Altcoin Index. This coin, therefore, is a synthetic asset which can be traded round the clock on Binomo, including during holidays and weekends, unlike other assets on the platform. It comes with binary signals that can offer gains up to as much as 83% and trading on this option can start from as low as $1.
Interestingly two profitable trades or options with the altcoin IDX crypto-asset can usually make up for any losses that could have been incurred previously. The asset can also be traded on a short-term basis profitably since it has a great volatility. Generally, its calculation is based on the average value of four different coins namely Ethereum, Litecoin, Monero and Ripple. The fact that it is synthetically derived from four altcoins that are known to have great stability gives it the much-needed advantage of reliable forecasting since it has a smoothed out input assets for its derivation.

If you want to create your own penny IDX, then which 4 penny assets will you choose and what what is the reason behind choosing those four assets. Define Penny currencies.(Explain, no screenshot required). [2points]
My Own Penny IDX
My choice of Penny IDX would include coins like Sushi swap, OMG Network, Pax Dollar and WAX. This is because the four coins I have chosen, although there are penny cryptos, have quite appreciable stability in the market. Equally, they come with a good level of volatility.
Penny Currencies
Penny cryptocurrencies can also be referred to as small cap cryptocurrencies. These refer to crypto coins that have small market capitalisations. Cryptos with market caps above $10 billion are the large capitalisations. Those with market caps between $1 billion and $10 billion are referred to as mid caps while the penny cryptos or small caps refer to those with capitalisations below $1 billion.
These penny cryptos are of small market capitalisation and do have a great potential of explosively spiking in their prices even within a short period of time. Therefore, high profit investments could be made into them on a short-term basis and not long-term basis.

CONCLUSION

The Bichi trading strategy is an interesting strategy which can be used to combine Bollingerl bands and Ichimoku Cloud in producing interesting trading results. While the middle band of the Bollinger bands would act as a level of either support or resistance, the Ichimoku Cloud would provide an area above or below which a breakout of price could occur in predicting the potential direction of the price action.
The system can be useful in identifying ongoing trends predicting possible trend reversal and gauging the strength and momentum of a current market trend. The system is quite great for trading. Cryptocurrency IDX and altcoin IDX refers to cryptocurrency and altcoin index which are available on the binomo trading platform as a high profit assets.
