
Hello steemit and steemains, i welcome everyone to this platform. Hope we are having a nice and hope we are enjoying this platform. I will be discussing on technical indicators as one of the technical analysis tools.

QUESTION 1
1.a) In your own words, explain technical indicator and why it is a good technical analysis tool.

Technical indicator being one of the technical analysis tool that is used to determine and know movement of prices. I can say technical indicator to be a manual used by a trader that tells a trader how to go about a particular signal, what to do when a signal goes high and to determine the stablity of a signal in a chart. Technical helps in day to day decision to analyze the past and future price movement and patterns in order to know when to make profit or not.
The objectives of technical indicators are
i) To determine the direction of a price whether the price is going up or going down in other words it can be said to know when a signal is trending down or is trending up.
ii) To estimate the time at which price moves over a period of time on a chart or market price
iii) To deteimne the rate at which price changes on a chart or market price.
Technical indicator is a good technical analysis tool because it is used to determine the movement of prices by analyzing the movement of signal knowing when a signal goes high or goes low. With the movement of signals in a chart, price and its movementcan be determined.
b) Are technical indicators good for cryptocurrency analysis? Explain your answer.
I can say that technical indicators are good for cryptocurrency in the sense that they help a trader to have full understanding on how goods and services are exchanged, blockchain and to know the movement of goods and services that ia determining when there is increase or decrease in coins and when to make profit.
c) Illustrate how to add Indicator on the chart and also know how configure them( screenshot).
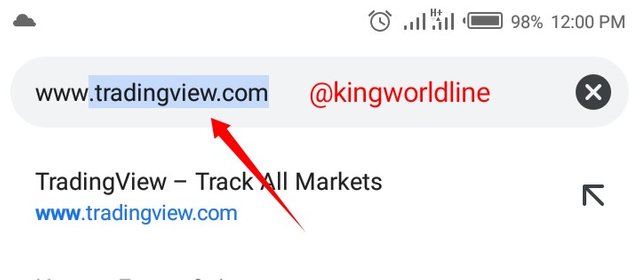
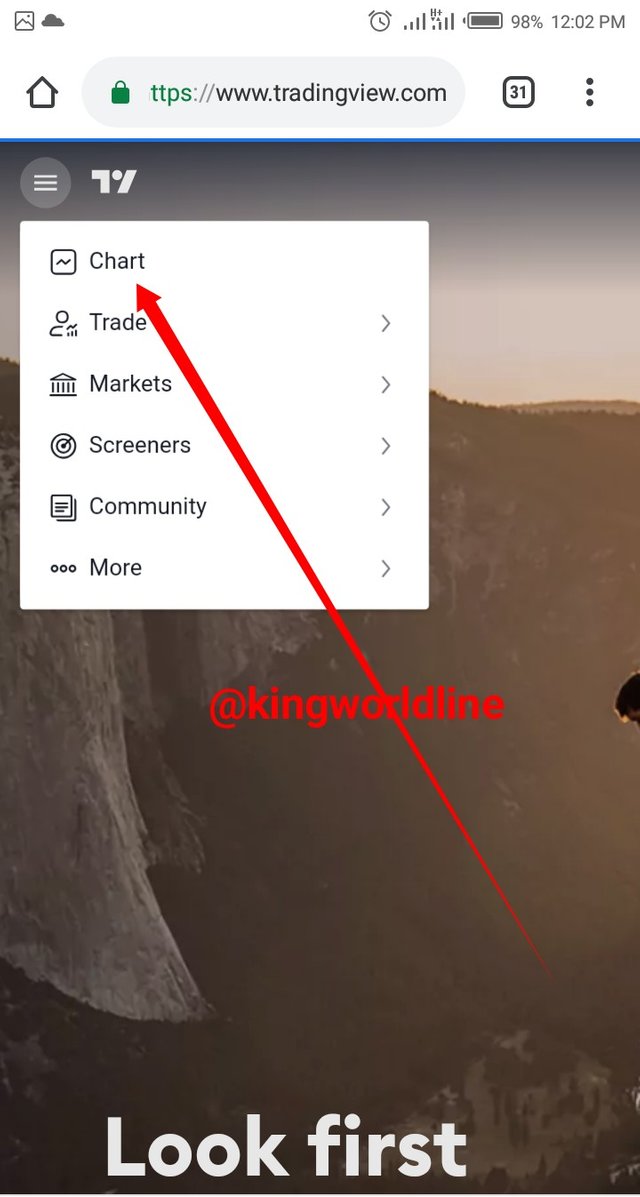
Using chrome as my browser I input the website by typing in www.tradingview.com. when it opened I clicked in chart.
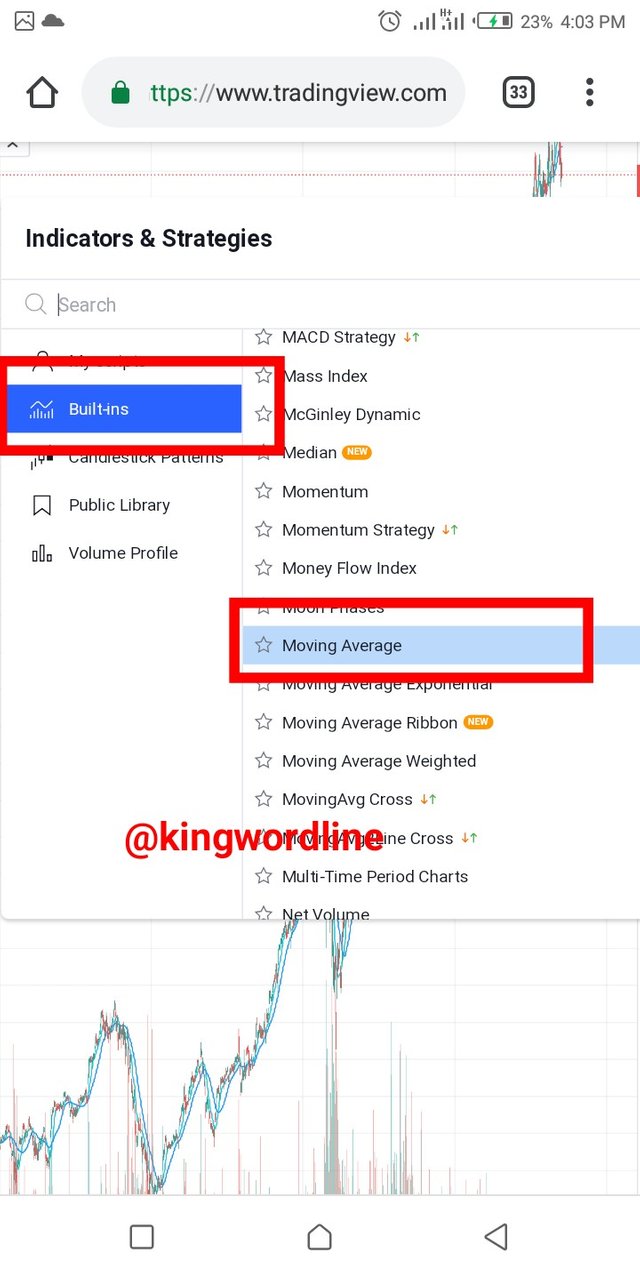
As the chart opened, then I clicked on indicator and select any indicator of my choice. I selected moving average indicator by clicking on it
To configure Moving Average Indicator(MA)
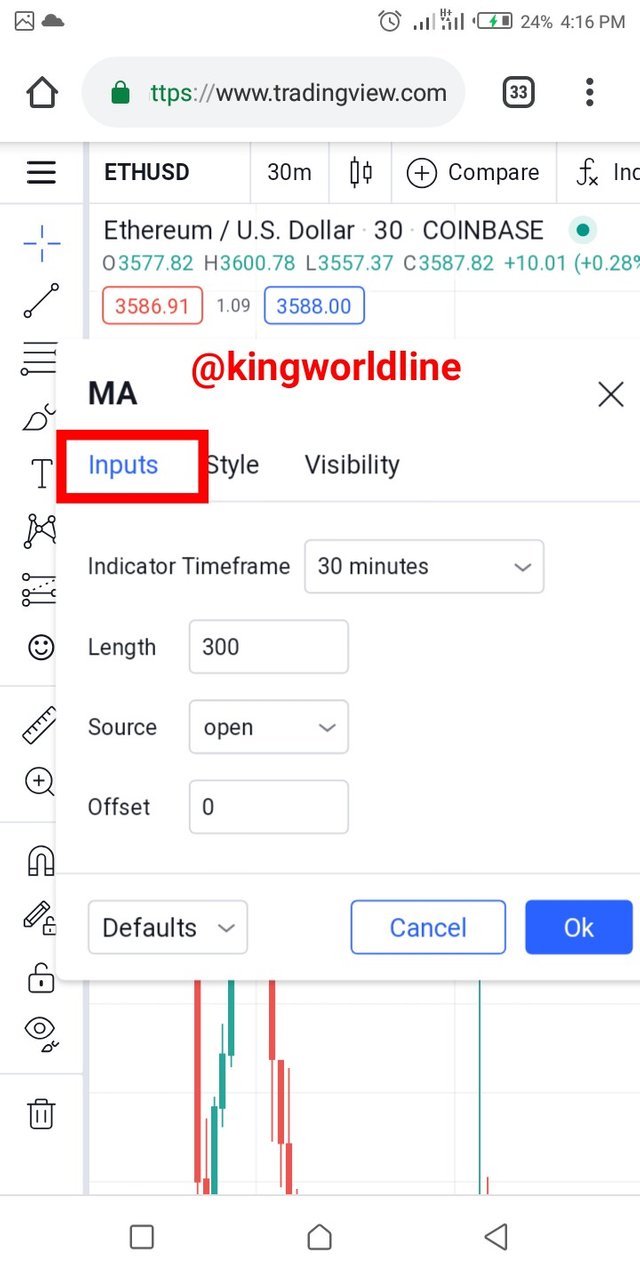
To configure the moving average I clicked on MA setting, a drop down showed up showing input, style and visibility.
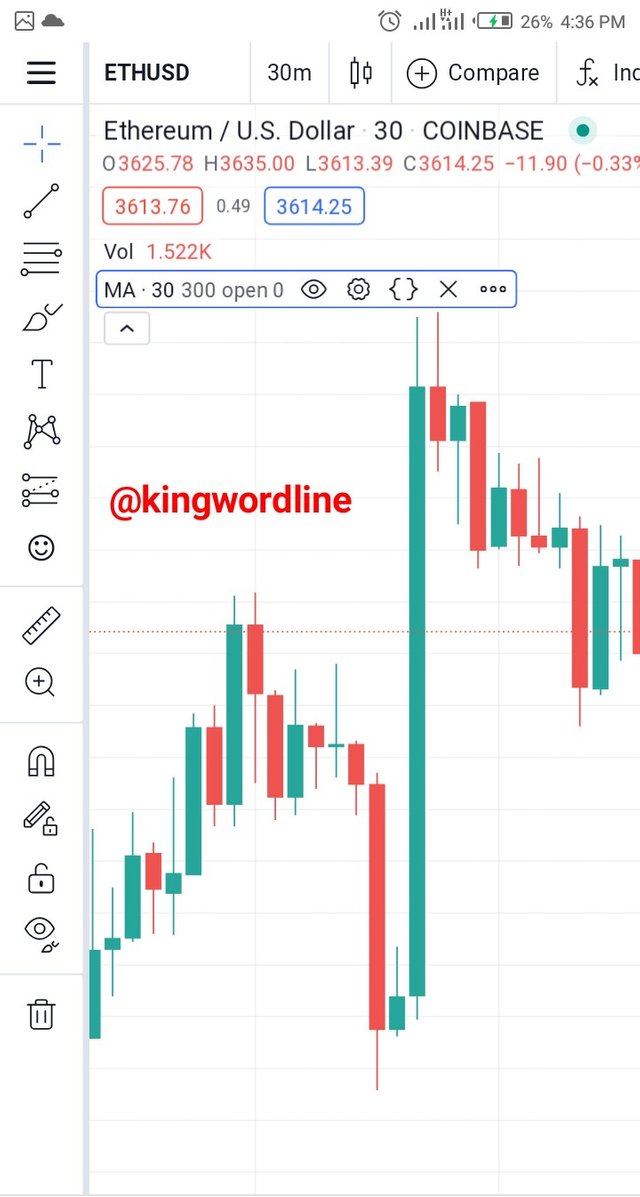
At the input i set the indicator time frame to 30mins, length to be 300 and source to be open and offset to be 0.
At the style i choosed my colour to be blue and precision to be 1
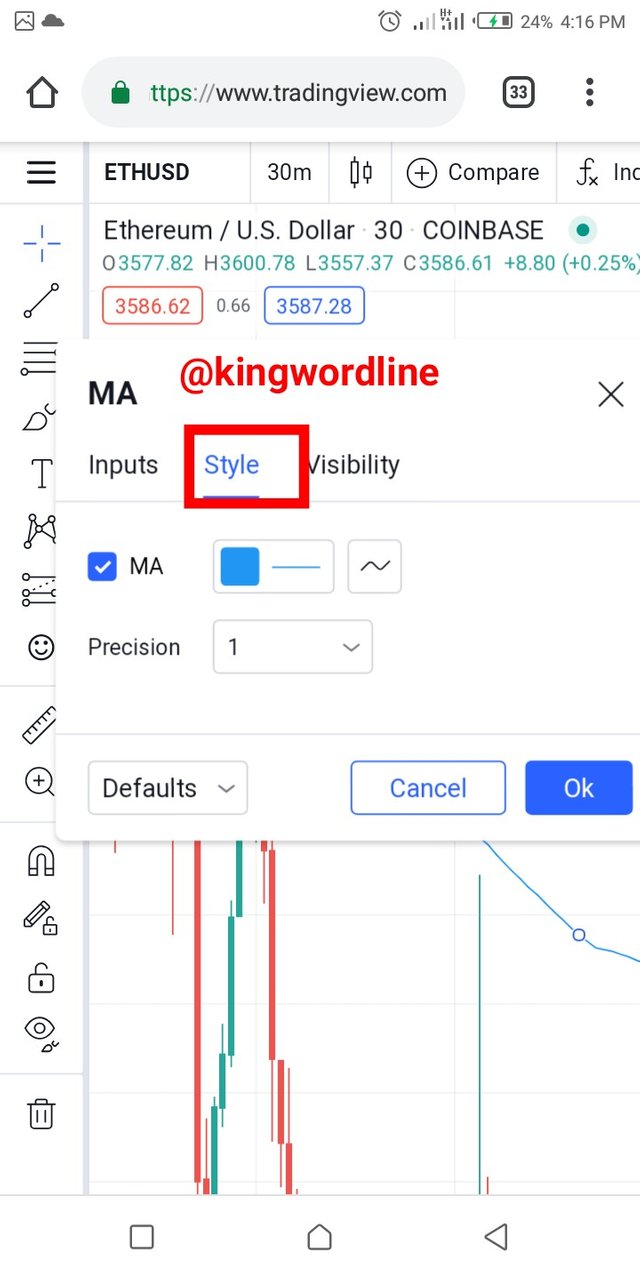
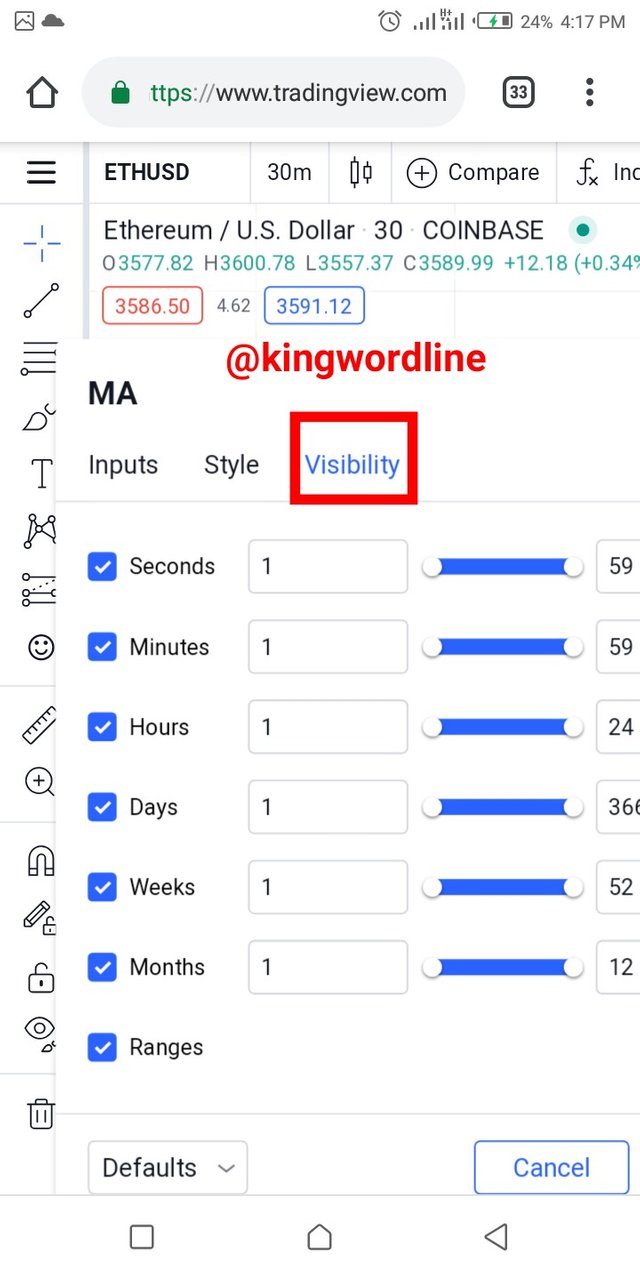
At visibility i went ahead with the values it came with
The configuration of moving average is shown below

QUESTION 2
2.a) Explain the different categories of Technical indicator and give an example of each categor. Also show the indicators used as an example on your chart( screenshot)

The different categories of Technical indicator are:
Trend Based Indicator:
Trend based Indicator is one of the categoriesof technical indicator that is used to determine the aim and the measure of direction of signals and also the strength of signals. Trend based indicator is often used to know when a signal will move up or move down in a chart thereby determing when price will increase or decrease in a chart. In trend based indicator the word trend is often used in replacement of the word move that is most traders often use the word trend in replacement of move. Example of trend based indicator are÷
Moving averages (MA)
The average directional index(ADX)
Moving average convergence divergence(MACD)
Ichimoku
Screenshot of Moving Average
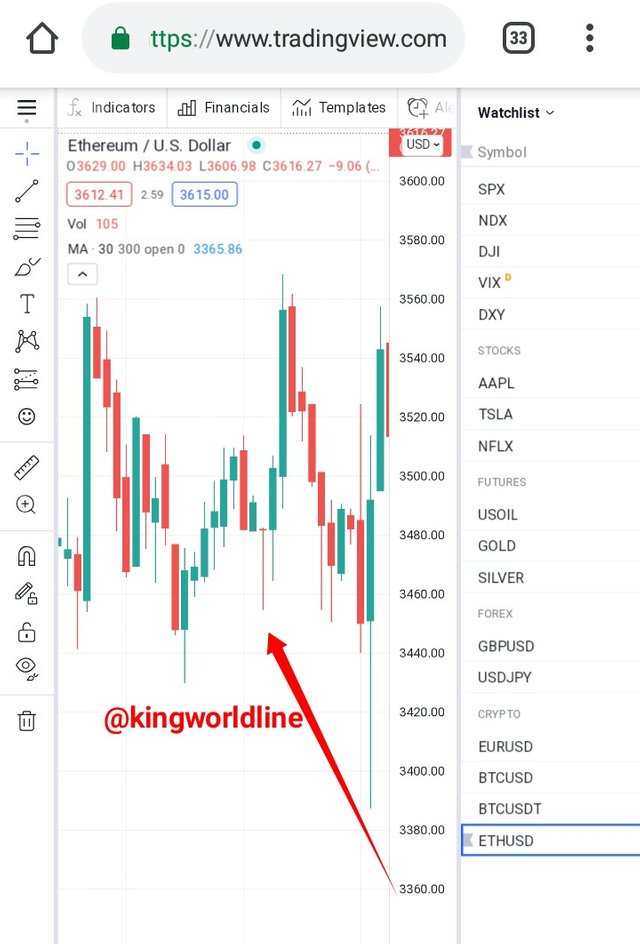
Volatility Based Indicator:
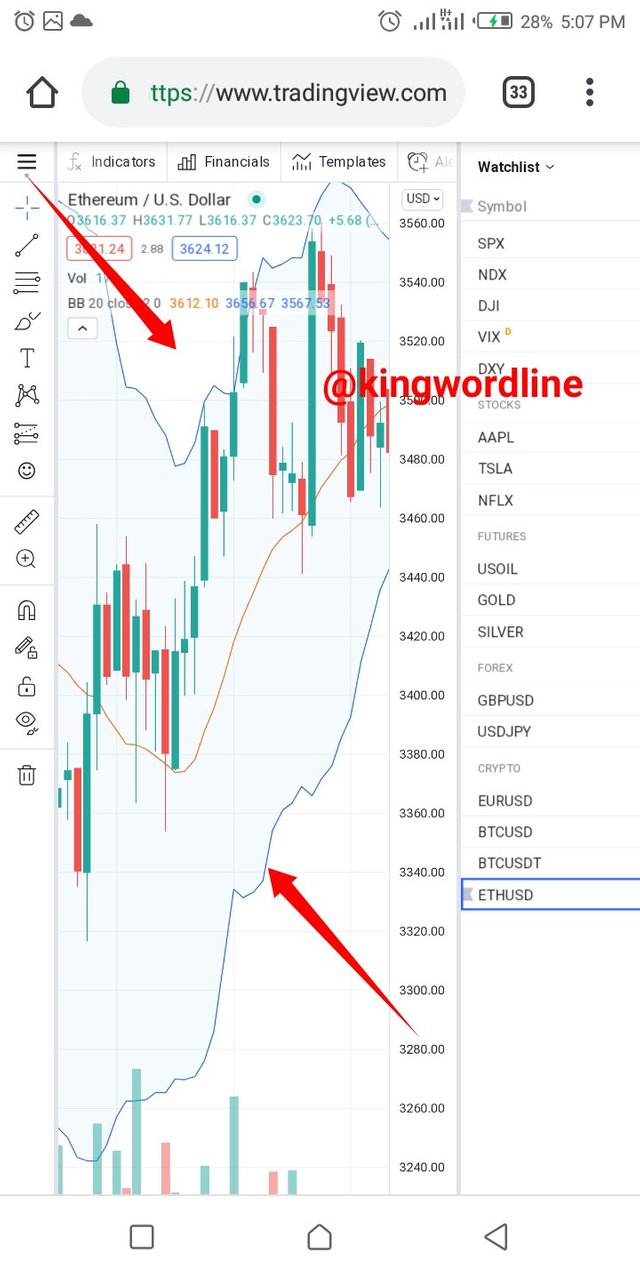
Volatility based indicator estimate the of high and low volatility in prices on a chart. Volatility is the measure of degree at which price moves over a period of time on a chart. Low volatility means little movement of price within an expected short term swing while high volatility means sudden movement of prices with in an unexpected long term swing. Examples of volatility based indicator are÷
Bollinger Bands
Kelther channel
Average time range (ATR)
Donchain channel
Screenshot of Bollinger Bands
Momentum based Indicator:
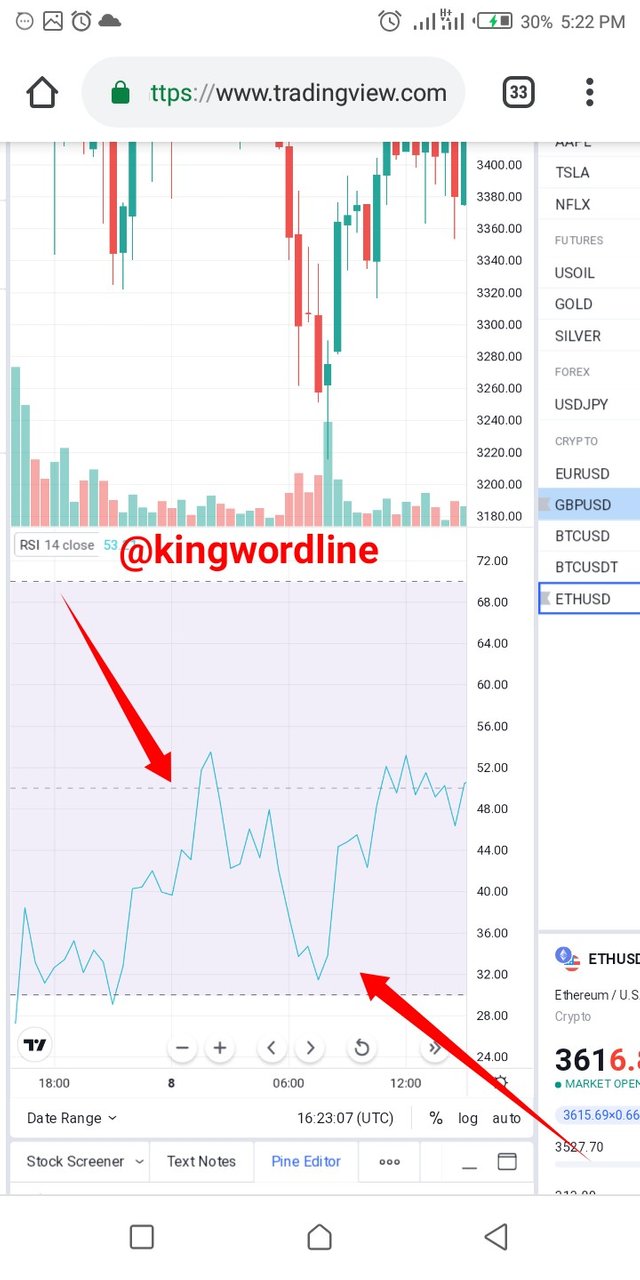
Momentum based Indicator is an indicator that determines the rate at which price changes. It is an indicator used by traders to determine at what spot pint a price goes up and comes down. Momentum based Indicator when combined with other technical indicator will help yo determine the movement of prices and the direction of the movement of prices on a chart. Examples of momentum based Indicator are÷
Relative strength index(RSI)
Price rate of change(ROC)
Stochastics
Screenshot of RSI
b) Briefly explain the reason why indicators are not advisable to be used as a standalone tool for technical analysis.
Technical indicator tool being one of the technical analysis tool to determine the movement of prices may not be advisable to be used as a standalone tool for technical analysis because it may not give the accurate edge in trading of signal of prices in the sense that sosrt from technical indicators we have other technical analysis tool like trading to time market and lagging vs leading indicator. They can be used to determine the financial markets, determing the limit and stop in prices, the advantages and disadvantages in the financial markets.
c) Explain how an investor can increase the success rate of a technical indicator signal.
An investor can increase the success rate by having the understanding that those who were successful in technical indicator were long term traders not short term traders that is they chart from a minute to day to week and to month chart.
An investor can increase the success rate of a technical indicator signal by proper application of the categories of technical indicator signals in an analysis and remember the main aim of an investor is to make profit, for him to make profit he needs to have a deeper understanding of the categories of technical indicators signal.

Conclusion

Technical indicators being one of the technical analysis tools is an essential tool that guides a trader on how to make profit and also on how to do when there is in increase or decrease in price in the market.
Moreover, technical indicators may not give the perfect analysis when it is stand alobe but with tge inclusion of other technical analysis tool a trader will be able to have a deep understanding of how movement of prices works that is when a price will trend up when it will trend down and when it will be stable.
Thank to professor @reminiscence for this eye opening lecture.
#reminiscence01-s4week2 #cryptoacademy #reminiscence01 #nigeria #indicators #technicalanalysis