
Source

1. Discuss in your own words Trix as a trading indicator and how it works

The Trix indicator which is short for Triple Exponential Average is a tool for technical analysis that is used by technical traders as a way of helping them determine percentage changes in the moving average thereby helping them in several ways including the ability to recognise oversold and overbought areas of the market. There is a triple in its nomenclature which signifies the fact that the smoothing of the moving average has been exponentially done three times.
The indicator can be used as a momentum oscillator whereby it gives positive values to signal regions of overbought or overvalued market and identifies regions of oversold or undervalued market with negative values. It was created by Jack Hutson in the 1980s with a view to using it as a way to unravel the rate of change that has occurred in a moving average that has been triple exponentially smoothed.
There are three major components to the indicator. These include:-
- The Trix line
- The zero line
- The percentage scale
How It Works
The indicator is very useful for the identification of markets that may have either entered oversold or overbought regions. Also, it serves as a momentum indicator. Just like a lot of other oscillators that are used for technical analysis, the Trix indicator moves around a centre zero line. The indicator uses the percentage scale to give values that can interpret market conditions. When the indicator gives an extreme positive value it can be read as an overbought market. When it gives an extreme negative value it can be read as an oversold market.
While using it as a momentum indicator you can read positive values of the indicator to mean that there is an increasing momentum. Conversely, the momentum should be read as decreasing when the indicator gives a negative value. Usually, the Trix crosses above or below the zero line to give buy or sell signals respectively. Furthermore, there could be a resultant divergence between the price action and the Trix indicator which could mark an important turning point for the market.

2. Show how one can calculate the value of this indicator by giving a graphically justified example?

The calculation of the Trix indicator follows a simple strategy. Normally, the 15 period is used even though this can be altered based on personal preference and experience with the indicator. To calculate the Trix indicator one should follow the steps below:-
You should choose the number of periods (n) that you wish to include in the indicator. This will depend on the time frame on which one is trading.
To create the EMA 1 the n-period of an exponential moving average is calculated with the use of closing prices
Once the EMA1 has been calculated you can then calculate
Obtain EMA 2 by calculating an n-period moving average of the EMA 1. This process is the double smoothing.
Once the EMA2 has been obtained you can then calculate the EMA3 by obtaining an n-period exponential moving average with the use of the EMA 2. This process is the triple smoothing.
From the results obtained you can calculate the Trix indicator with the formula below:-
Trix = (EMA3 [today] - EMA3 [yesterday]) / EMA3 [yesterday]
Assuming that:-
EMA3 [today] = 106
EMA3 [yesterday] = 102
Trix = (106 - 102) / 102
=> 4/102 = 0.039215686%
Therefore, Trix value will be approximately 0.0392%
How to configure it:-
In order to be able to configure the indicator I have to first of all add it to a crypto chart. I can do this on the tradingview.com platform. To do this I visit the tradingview site and select a crypto pair of my choice. Once on the chart:-
- I clicked on Indicators
- On the search bar I input Trix and the select the first indicator that pops up
- This automatically adds the indicator to the chart as is shown. To configure it's settings I click on the settings tab on the indicator.
- From there I am shown different options to configure the indicator.
The two most important configurations are inputs and style. With inputs you can change the length to any desired choice of length and also choose the time frame over which the indicator should work. With style you can choose the colour of the Trix line and the colour of the zero line as well.
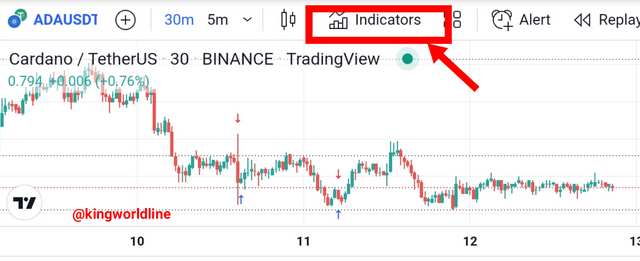
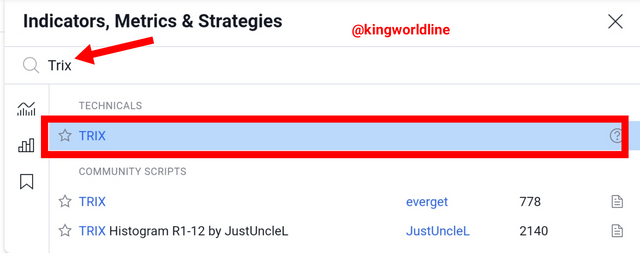
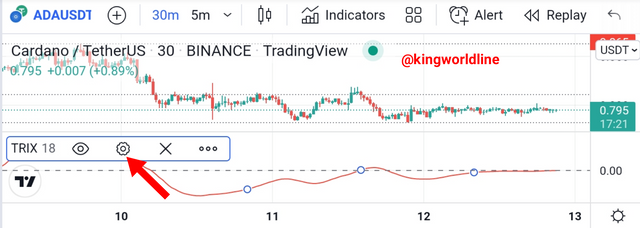
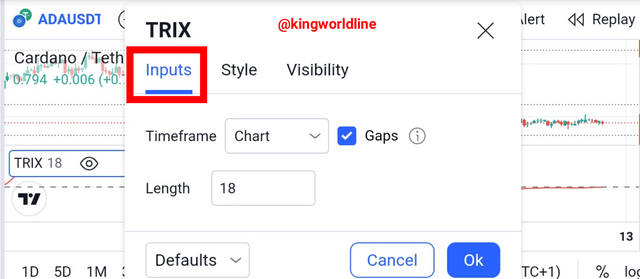
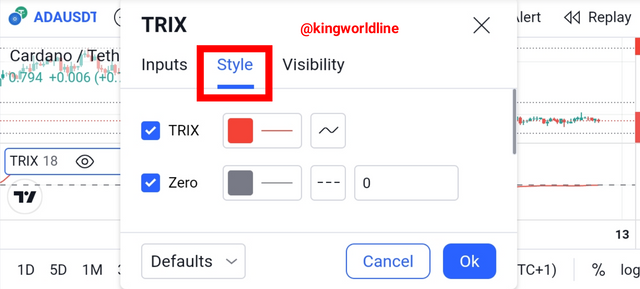
Is it advisable to change its default setting?:- (Screenshot required)
The default setting of the indicator is 18-period length. Whatever time frame or period that is chosen would be considered when the smoothing of the average is being done. When a longer period of time is chosen it would give signals that are much smoother. This means that less signals would be obtained and this increases the chance of filtering out false signals with the disadvantage of possibly missing out on smaller trend moves.
On the other hand using a shorter period of time or learnt would mean that the indicator has a less smoothened graph that gives out more signals. This is likely to catch every single move of the markets no matter how minute but with the disadvantage that it could potentially generate more less reliable or false signals.
Nevertheless, with the use of the indicator with other suitable indicators as would be examined later it is possible to still use it over a longer period of time. For beginners it would be more helpful to stick to the default setting. However experienced traders who may understand how it works in combination with other indicators may still decide to use them over a longer period of time because of more experience.

3. Based on the use of the Trix indicator, how can one predict whether the trend will be bullish or bearish and determine the buy/sell points in the short term and show its limits in the medium and long term. (screenshot required)

Normally, analysts make use of the indicator by relying on it to interpret either buy signals or sell signals. Sell signals are created in bearish markets while buy signals can be obtained in bullish markets. So, using the indicator to determine how an upcoming trend could be bullish or bearish relies on identifying how buy or sell signals are obtained from it. Various signals for bullish and bearish trends can be obtained by looking at the relative positions of the Trix indicator to the zero line.
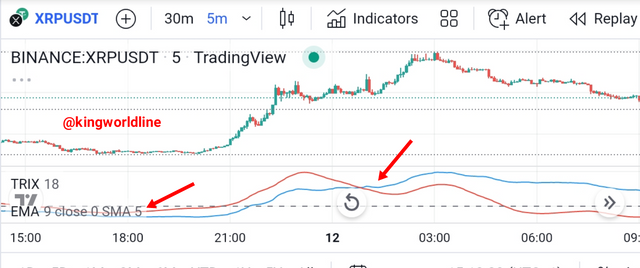
There is a centre line which has a zero value. This is the zero line. The movement of the Trix above the zero line from below signifies that the impulse in the market is progressing and this is a bullish signal which portends an uptrend. Equally, the movement of the Trix indicator below the zero line would mean that impulse is reducing and it is a bearish signal portending a downtrend. So, the crossing of the tricks in the ghetto over or below the centerline communicates the sentiment in the market.
Source
In the image of the XRP/USDT chart on the 5 minute time frame shown above you will discover that the Trix line crosses above the centre line sometime after 18:00 hours as an indication of the market entering an uptrend. At around 06:00 hours you will discover that the Trix line crosses below the zero line showing that there was already a downtrend but this signal lags as the new trend started earlier.
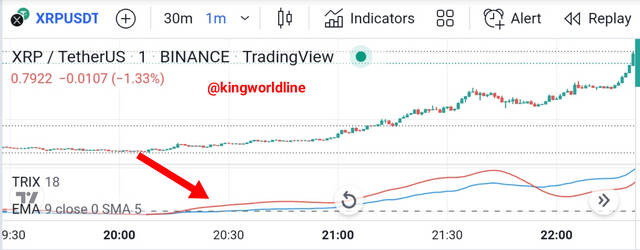
In order to use Trix indicator for short-term trading, an age long effective strategy involves the incorporation of a 9-period exponential moving average overlaid on the Trix indicator. To use this strategy you would interpret the crossing of the Trix line below the 9 period EMA which is the signal line as a bearish indication. When the Trix line crosses above the signal line it would be viewed as a bullish signal.
Source
In the image above of the XRP/USDT on 1 minute time frame, you will discover that the Trix line crosses above the blue coloured EMA signal line and this was the beginning of an uptrend in the market. This crossing would be a signal to go long. Again, you will discover that when the market was switching to a bearish sentiment the Trix line crosses below the signal line. This can be interpreted as a switch to the bearish side and an opportunity to go short on the asset. You will discover that this is a reliable combination because the crossing occurs early enough such that you don't get late into the new trend.
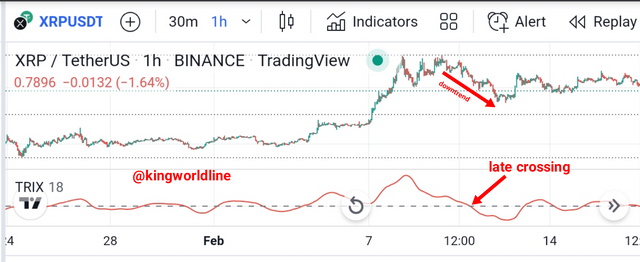
Using just the Trix indicator in the medium-term and long-term is not a reliable venture. The image below will give us a clear explanation.
Source
From the image above on a 1 hour time frame of the same crypto asset you will discover that before the tricks line crosses below the centre line the downtrend indicated was already coming to an end. Hence, using this indicator on a long time frame alone will not give us a good and timely entry signal.

4. By comparing the Trix indicator with the MACD indicator, show the usefulness of pairing it with the EMA indicator by highlighting the different signals of this combination. (screenshot required)

Some people consider the Trix indicated to be quite similar to the MACD indicator. However, there is a primary difference between the outputs obtained from the Trix indicator to that of the MACD indicator. The outputs of the Trix indicator have been made smoother as a result of the use of exponential moving average which has been smoothed thrice.
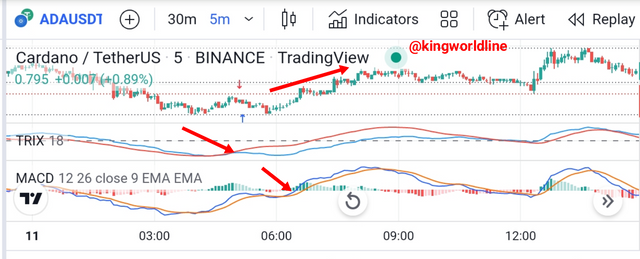
The MACD is a trend following and momentum based indicator and can be combined with the Trix indicator to get early and sure signals of a developing new trend. Equally, it could be informative in helping you close a trade whose trend may just be about to reverse. First, we are going to be on the lookout for the crossing of the MACD after reaching extreme levels. Concurrently, the Trix indicator should cross the signal (9-period EMA) line as a confirmation.
Source
In the image above of the ADA/USDT crypto piar you will discover that the Trix line crosses above the 9-period EMA or signal line and also above the centre line of the Trix indicator as a sign that the momentum and trend had changed to an uptrend. At the same time there is a MACD crossover in which case they MACD line moves from beneath and goes above the signal line of the MACD. Equally, the volume of the MACD increases as a sign of increasing momentum which births the uptrend. These confirmatory crossovers is the collective signal for a buy entry.
In the case of a sell entry the reverse scenario is created.

5. Interpret how the combination of zero line cutoff and divergences makes Trix operationally very strong.(screenshot required)

A notable landmark usually occurs with the indicator when a separation is created between it and the price action; this is called a divergence of price and the indicator and could potentially signal a market turning point or an imminent price trend reversal.
Divergence is a phenomenon that would be observed in a situation whereby the price of an asset creates a high and a new maximum but the lines of an indicator creates a high and a new minimum instead. It could also be the other way around where the price of an asset creates a high and a new minimum while the lines of the indicator creates a low and a new maximum.
Whenever this occurs it usually creates a signal that the current trend is about to give way for the opposite or new trend. A bullish divergence is created when the price of the asset creates a minimum while the indicator creates a maximum. The maximum created by the indicator shows that the downside momentum was decreasing.
A bearish divergence is created when the price of the asset creates a maximum and the indicator itself creates a minimum. The indicator not validating or corroborating the price but creating a minimum goes to show that momentum to the upside is decreasing. Consequently, it could begin to increase to the downside thereby signalling a trend reversal.
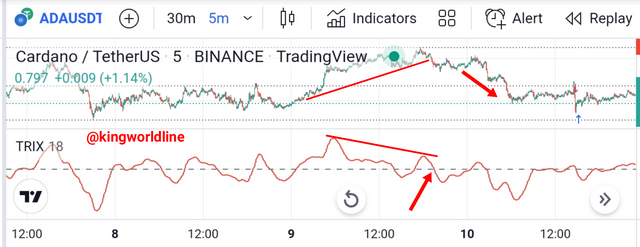
The cross of the zero line together with the cross of the Trix line and the signal line creates a collective confirmation of a trend change. A situation whereby a bearish divergence is created signalling imminent bearish reversal and the Trix line crosses both the signal line and the zero line and goes below these two would confirm that indeed a bearish trend has begun.
For a bullish divergence the reverse is the case. The Trix line has to cross above both the signal line and the centre line or zero line as a confirmation of an incoming uptrend.
Source
In the image above a bearish divergence is created. At the same time the Trix line crosses below the zero line as a confirmation of a possible incoming downtrend. Actually, there was a slight market correction before the downtrend eventually set in as indicated by the arrow pointing downwards.

6. Is it necessary to pair another indicator for this indicator to work better as a filter and help eliminate false signals? Give an example (indicator) to support your answer. (screenshot required)

The Trix indicator can be aptly paired with some other notable indicators including the Moving Average Convergence Divergence(MACD) and the Relative Strength Index(RSI) in order to filter out false signals. Since the professor @kouba01 has explored the use of the indicator with the Aroon indicator in his lecture I will examine how it could be also used with the RSI.
The RSI has the ability of measuring the power of a trend as well as indicating the momentum behind it. Combining it with the Trix indicator would give signals for both sell and buy trades that are excellent. This is so because the RSI can function especially even in a range-bound market and filter out false signals that may be given by the Trix in that situation.
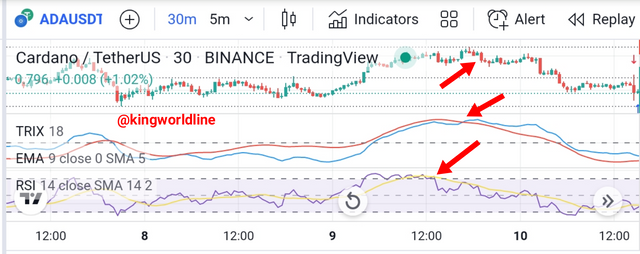
In a situation whereby both the indicator and the RSI enter regions of overbought or oversold then you can consider either going short or long respectively as there is a very strong likelihood of possible. However, before going long or short you should carefully ensure that the Trix line records a crossover with the 9 period EMA line or signal line.
Source
In the image above you will discover the very interesting role the combination of the RSI with the Trix indicator plays in giving early signals and filtering out a potentially false signal from using the Trix indicator alone. First, both the RSI and the Trix indicator were in the overbought region. The Trix line crosses it's signal line indicating a switch of trend. At the same time the RSI line moves quickly below the 70 line and the SMA of the RSI goes above the RSI line further confirming a change in momentum and trend.
Source
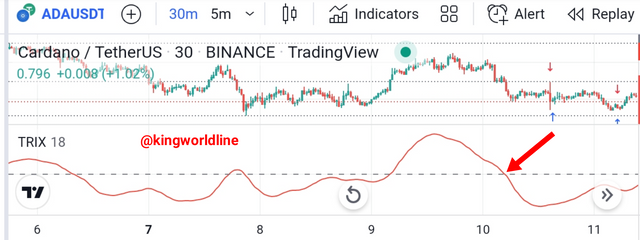
In this same instance using the Trix indicator only without a 9-period EMA attached to it and without the RSI as well you will discover that the only signal for this particular change in momentum the Trix indicator would have offered would be the Trix line crossing below the centre line. Unfortunately, this action happens as at the time the downtrend had already lasted for long.

7. List the pros and cons of the Trix indicator

Pros Of The Trix Indicator
There are some quite important advantages that are associated with the Trix indicator which makes it suitable for trading even in the cryptocurrency market. Some of these advantages include:-
The indicator has the ability to filter out market noise by making use of be calculated triple exponential average
The ability of the indicator to carry out this market filtering strategy makes it able for it to remove short term market cycles which could be minor and may falsely indicate premature market market trend change.
The indicator could very aptly be of use for the indication of either overbought or oversold market conditions
The indicator also has the ability to help traders determine the underlying momentum in the market.
Cons Of The Trix Indicator
As much as the Trix indicator comes with quite a good number of merits there are equally some demerits or downsides associated with it. Some of these disadvantages of cons of the Trix indicator include:-
The indicator cannot be used for the trading of ranging markets. This is due to the fact that the entwining of the EMA often gives false crossing signals that are not followed by huge price moves.
The oscillator may not be able to eliminate impulsive moves that are quite unrelated to the activity of historical price action.
Actually, this indicator is not considered to be the best when looking for an instrument for technical analysis that will help you gauge the current market price especially when intending to use it alone.

CONCLUSION

The Trix indicator has the ability to combine signals for both trend and momentum. While the triple smoothed moving average has the ability of covering the trend, there is a one period change in percentage that helps in measuring the momentum. The indicator has the ability of giving out various signals that can help determine the best chances of profiting from either buy or sell positions.
Interestingly, the indicator also has the ability of delivering signals of divergence between the market price and the indicator itself. These divergences when created are always important points of possible market turn and could potentially give an early signal of an impending change in the ongoing trend of the market.

#kouba-s6week3 #cryptoacademy #club5050 #nigeria #trix #trading #indicator