Good day everyone. It is my pleasure to welcome you to my homework of week 2 of season 6 on the topic of crypto trading with moving averages, which was taught by my dear professor @shemul21, am @kingworldline.


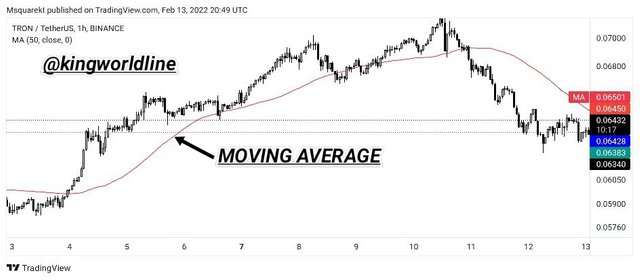
I can say that the moving average is known to be a technical indicator which tracks alongside the trend of the market in accordance with the price fluctuation, meanwhile this indicator is the mathematical expression of the average movement of price within a specific period of time. This indicates an irregular oscillating line on the price chart which actually defines the trend in the market between the bullish, bearish or sideways trend, the resistance, support and the trading opportunity involved.
Hence the moving average indicator operate in two ways based on the price action on the bullish and the bearish, meanwhile the MA defines the bullish trend defines the based on when the bullish trend line cross below the price movement which means an upward trend
Meanwhile the bearish can equally be defined as a bearish trend when the trend line is set to cross above the price movement no which shows a downward trend.
Hence the indicator is useful based on identifying the market Trend, trend formation, in identifying an entry and exit point.


Hence as regards to the questions above there are three main types of the moving average which are the simple moving average, the exponentials, weighted moving average.
Therefore on this aspect is known as an indicator (trend line) that follow the track of the price fluctuations which is determined by the buyers and sellers, meanwhile this can done mathematically with the help of the average closing price alongside with the time interval, hence the moving average covers every single price point, meanwhile the sole moving average is in proportion between the closed candlestick and that of the adjusted average.
Simple moving average can be expressed mathematically based on a simple calculation as;
The Simple Moving Average known as SMA is equal to SMA=P1+P2+P3+.... Pn/n
Therefore have P as the price at a specific time and n as the number of periods.
The simple moving average is known by its act of false signal elimination caused by the price, and it's graphical view of the market, meanwhile is as well shows the trader some critical points to pick out opportunities
Hence based on the trading system as regards to the indicator, that is 50, 100, 200 which shows the candle sticks at a long term which represent the higher while that of 8, 10 and 20.
This is a kind of indicator with common similarity with that of the simple moving average with a difference based on it means of calculation, hence this can be calculated from the recent price action change, meanwhile this is technically used by investor in making analysis on determining the price action an as well the areas of the support and the resistance as well.
Hence the mathematical expression can be written as having Exponential moving average known as EMA
Having EMAc = [ ( Cp(s/1+n]+[1-(s/1+n)]
Having
EMAc as Current EMA
Cp as Current price
EMAp as previous day EMA
s as the smoothing factor
And n as period ( number of days)
Meanwhile the recent price data is added in the market, hence the EMA is interested in the descent data while that of far gone days are less important. The EMA is always faster than that of the SMA in term of the price movement.
Meanwhile as the same with the simple moving average the EMA based on the period, the EMA is independent of the period setting used as regards to the using the higher periods like 50, 100, 200, while the intra- trader uses the EMA setting with little period like that of 8, 18, 21 EMA
The weighted moving average known as the WMA is also another type of Moving Average which is at the interest of the recent price point than that of the far previous data, hence the weight is quite the same with that of the EMA but with the difference base on calculation, meanwhile having each of the candle multiplied with the reference to the weight factor which gave the WMA indicator the recent price point, having the WMA in sum total of 1 or 100 as well.
Hence the weight moving average is expressed mathematically by;
WNA= P1n+P2 (n-1)+...On/[n*(n+1)]/2
Where;
n= number of periods
P= price point
Hence as it is in weight moving average, so in others in terms of there use, they are used in identifying trends, trend reversal and as well the resistance and support point, meanwhile the period is also independent of the kind of period used as regards to the 50, 100, and as 200 while the intra-trader can use the use the 8, 18, WMAs.
Meanwhile below are the major differences of the moving average between the simple, exponentials and weight moving average.
SMA
•Therefore the simple moving average known as (SMA) is to be calculated based on the average price of a given period of interval.
•In trend identification the SMA is ideal for for long term trend because of the previous price changes
• The SMA is quite slow to price due to the application of the average smoothing.
EMA
• Based on price change, the EMA is faster than that of the SMA due to the difference in their recent price change entries.
• Due to the fact that EMA is used in terms of figuring out short term, hence is priority to that of the price change as well.
•The EMA is calculated based on their recent change in price at specified period of time in a way that it can lay more emphasis on the previous data.
WMA
•The WMA is used in recent price points in place so that the weighted can be applicable to that of the recent price in place to keep data of moving average smoothing.
•Hence this is ideal for that of the short term trading based on the priority to that of the recent price point.
•The WMAs are faster in terms of price to that of SMAs and that of the EMAs due to priority over the recent price point.


Therefore the moving average is known by its means in determining the entry and the exit point, hence based on more illustration as regards to figuring out the exact point of entry and exit point using the MA.
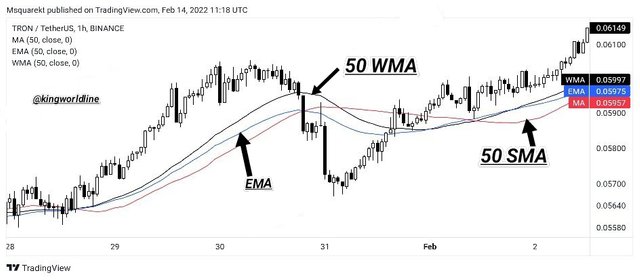
Combining the moves in order to make a good decision over the market, we can use SMA, WMA and the EMA all together in a chart.
In the chart above we observed that 50 WMA is quite closer to the price than that of 50 EMA as shown in the screenshot above.
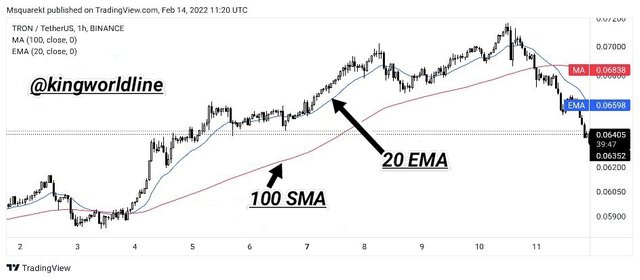
Meanwhile adding another Moving Average in terms of determining the point of entry and exit, hence adding up the 100 SMA and 20 EMA to the chart actually defines the dynamic support levels and the resistance level where we can buys and sell respectively as soon the price gets to closer to that of the moving average.
Mainly looking at the chart above, I have it that the price is an uptrend as the price is seen to be 100 SMA showing that the buyers are dominating the market than that of the sellers at a specified time also having the 20 EMA of price retracement keeps the market moving in bullish trend.
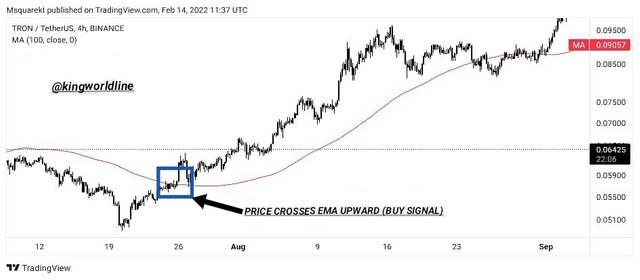
Hence demonstrating the entry point of the moving average with that of screenshot below
We can observe that the price action initially is a down trend which actually forms the low highs and lower lows, at a point there was a bullish trend where the price moves above the MA which show that that buyer are already dominating the market over the sellers, hence at the point of the by cross of the price and the MA declares a buying opportunities while the exit point to take our profit should be at the point where the MA line approaches the price again in the bullish trend.
With the screenshot above we have a sell entry position where the price crossing MA forming a down trend at that point of price crossing above the MA is picked as entry point for sell when the exit point for this should be at apoint where the MA approaches the bullish trend.


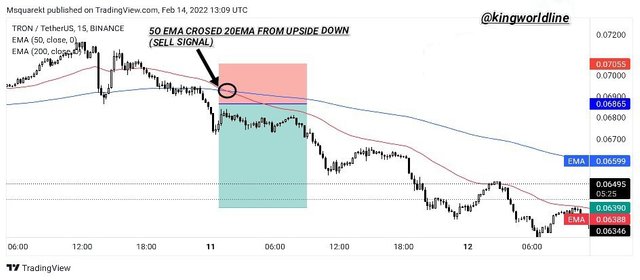
The cross over in moving average is technical means used in analysing assets in order to figure out clear trade signals, meanwhile this came as a result of two moving averages in combination to yield results.
Therefore the aim of this two moving average is to determine the point that crosses each other at first and second which could be at the upward direction which signifies buy and the downward signifies sell.
Hence the main reason for this strategy is to identify the point of entry and exit in the market.
Considering the sell signal on the charts shown below is 50 EMA crosses the 200 EMA showing that upside down which
show the sellers have taken position.


Hence the moving average actually has a lot of benefits that trigger the traders to adopt using it in making entry and exit in trading, hence aside the benefit, there are Limitations it has which are as follows.
• It some time can give out false signal whenever there are some sharp fluctuations in the price movement.
• Meanwhile it does not take date into consideration unlike the data which is inclusive in the mathematical calculation of the average data.
• Data used for the MA can be changed which can cause a false signal.
• Meanwhile there are some lag in these indicators which causes late signal in trend reversal.
• The MA heavily rely on the past historical price data for calculation.
• The moving average performs well in trend in the market and does not perform well on the sideway market.


In conclusion the moving average known as the MA is a nice technical tools adopted by the trader in carrying out some technical analysis based of making prediction over the entry and exist from the market, identification of the support and the resistance level and the entry and exit point, hence this actually keeps the trader in alignment base on his prediction and tell the trader what to do at a particular point in time.
Hence I was able to carry out the usefulness of moving average and as an indicator and the type of indicator base of their individual differences which are all users in making technical analysis over trading, I was able to make some entry and exit point based on my screenshots using the Moving Average and as well the strategy involved and it's limitations as a indicator.
Special thanks to my professor @shemul21 for this wonderful lesson.
Thanks for reading through.
#shemul21-s6week2 #cryptoacademy #club5050 #moving-average #nigeria #trading
