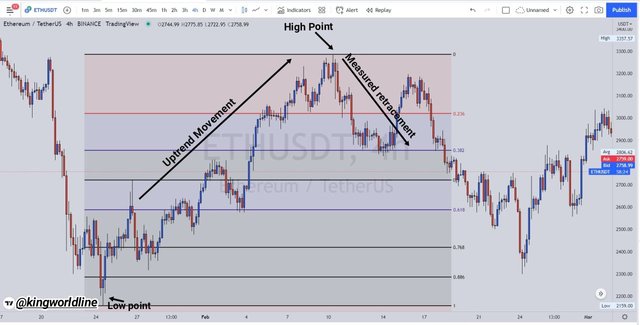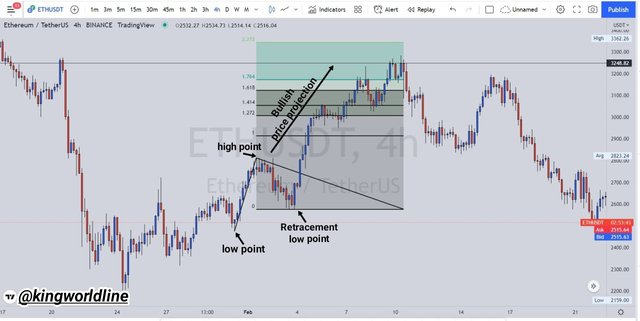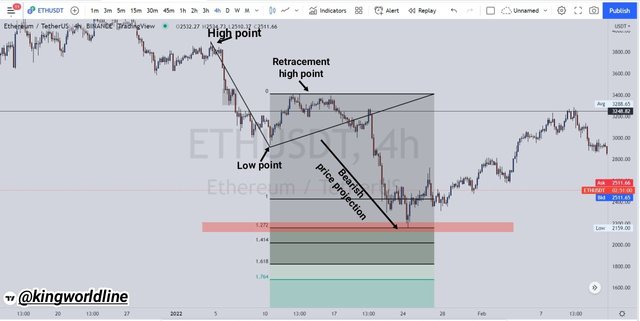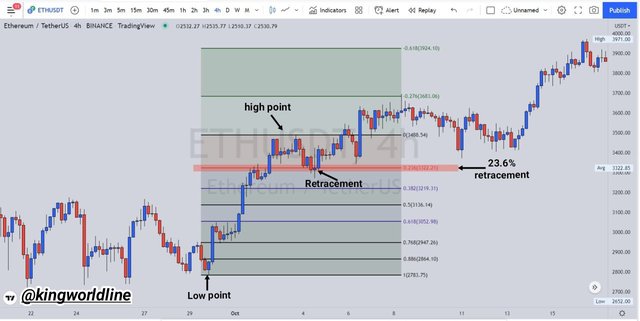
This another week of cryptoacademy I welcome everyone to my homework from the topic "Fibonacci Tools "which was taught by my dear professor @peleon53.


FIBONACCI RETRACEMENT
Therefore the Fibonacci is a pattern on its own which occurs in a natural mood, taking account of the following in living things like the shape of a leaf, the spiral shell of a snail etc. Hence the Fibonacci is a mathematical presentation which uses Fibonacci number, hence this numbers defines the the sequence of the created from that of the observation gotten from the natural things, hence they are noted In a mathematical format with aid of a number which are equal to the sum of a two number before it, starting from the number zero 0, 1, 1 ,2, 3, 8, 13, 21, 34, 55, 89, 144.….. to infinity.
The Fibonacci retracement level is known as those levels which are obtained from the Fibonacci sequence ratio, hence all this is used by the trader in figuring out how deep the retracement of the resistance and support is. Hence the most well recognized and we'll use Fibonacci in trading is the following be percentage 23.6%, 38.2%, 61.8%, 78.6%. Meanwhile the 50% is included but is not recognized as one of the Fibonacci levels due to the fact that it is not obtained from the sequence, hence the 50% is regarded as level equilibrium in the market.
Hence the Fibonacci retracement tool includes the the horizontal lines drawn diagonal which actually associated with high points and low point in the market structure, hence to carry out the fibonacci retracement plots as regards to the price action actually demands for intellectual understanding of the price movement and as well the market structure.

THE FIBONACCI EXTENSION
The Fibonacci extension as regards to trading are the outstanding levels which are calculated from the Fibonacci sequence ratios meanwhile this are mostly utilized by the traders in place to determine the the point at which the price movement can attend to take out profit, hence the Fibonacci extension are in line with the continuation of a trend along side with their price level, hence in the Fibonacci extension the most recognize level are the 61.8%, 100%, 161.8%, 200%.... Infinity
Hence the below screenshot is how to apply the Fibonacci extension to a chart, first visit the web address Tradingview on the displayed page select the Fibonacci extension at the left hand side of the tool chart column,

FIBONACCI RETRACEMENT CALCULATION
Hence to calculate the Fibonacci retracement are as follows!
Having the formula as R1 = X + [(1 - % Retrace 1/100) * (Y – X)]
PARAMETERS
Having X = Initial value of the price where the Fibonacci Retracement begins.
And having Y = Maximum value of the price where the Fibonacci Retracement ends
Therefore the following below is the retracement values which are
The
The % Retrace 1 = 23.6%
The % Retrace 2 = 38.2%
The % Retrace 3 = 50%
The % Retrace 4 = 61.8%
The% Retrace 5 = 78.6%
Then calculating for that if the Retracement 1 (R1) with the expression of R= X+[(1-% Retrace 1/100)*(Y-X]
As shown below on the screenshot a regards to the calculation
Having X as 2,783.75 USDT
and Y as 3,488.54 USDT
Then having the following as
R1 = 2,783.75 + [(1 - 0.236) × (3,488.54 - 2,783.75)].
R1 = 2,783.75 + (0.764 × 704.79).
R1 = 2,783.75 + 538.45956.
R1 = 3,322.20956 ~ 3,322.21 in 2 s.f.
Thus for the %Retrace 4 which is 61.8%, with this expression of R = X + [(1 - % Retrace 4/100) * (Y – X)]
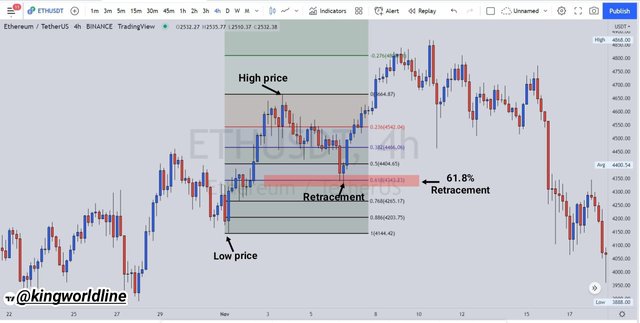
Then having X = 4,144.42 USDT, Y = 4,664.87 USDT
Therefore R4 = 4,144.42 + [(1 - 0.618) × (4,664.87 - 4,144.42)]
R4 = 4,144.42 + (0.382 × 520.45)
R1 = 4,144.42 + 198.8119
R1 = 4,343.2319 ~ 4,343.23

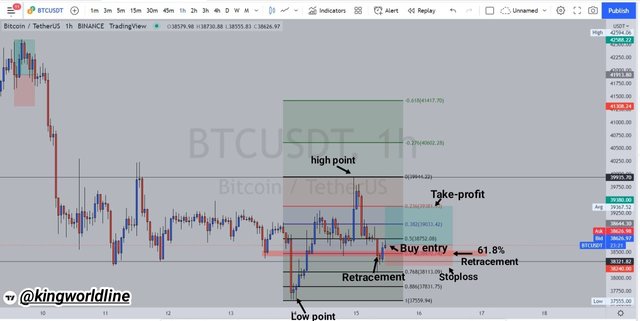
Hence for the execution as regards to the question I will be using My Binance account for this trade on the BTC/USDT on 1 hour time frame, meanwhile on the chart I have the high to be $39,944 22 and the low price to be 37,559.94, I used Fibonacci retracement to l calculate and as well to measure the extent of retracement,
At the chart I observed a bullish engulfing candle, then i was able to figure out the additional pressure from the buyer then I place to buy $38, 644.30 with my stop loss at 38,240, with take profit above my entry price at $39,380.00, hence this trade was executed on future with 10X leverage.

SCREENSHOT FROM BINANCE EXCHANGE


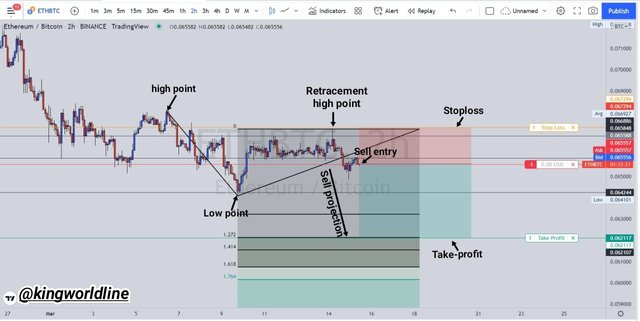
On the chart above is a chart of ETH/BTC on a 2 hours the frame, on the chart the trend was actually a downtrending market which actually has the formation of the lower highs at 0.069000 with a lower low point at the 0.064101, as based in the screenshot has a pressure building towards the bearish side, then I now observe the market is pushing down by the seller I now make an entry at $0.065588 alongside with my stop loss at $0.067294, then I take up my profit at $0.062117, below is the tradingview paper trading.

The truth have to be told, many and including me don't trade with this Fibonacci retracement or it's extension, although is important in its own based on using it in indication of different levels of price retracement, and also it is used to determine the Support and the resistance in the market, also in confluence trading it actually indicates the point of setting profit, stoploss and it as well reduces exposure to risk and as well maximize profit.
I was able to carry out some trade on my demo and real account as regards to the Fibonacci retracement
Thanks for reading...
Cc: @peleon53
Am: @kingworldline
#pelon53-s6week4 #cryptoacademy #club5050 #trading #fibonacci #nigeria
