
Crypto Academy Season 6 Week 4 - Psychology of Trends Cycle.
Hello my fellow steemia, is another week at cryptoacademy, I hope you guys are enjoying the world of crypto trading, meanwhile this week is the 4th week of the season 6 in cryptoacademy am @kingworldline.
This week I will be reporting the assignment given by my dear professor @reminiscenece01 with his topic on "Psychology of Trends Cycle."


Dow Jones theory this a well recognized theory in the world of finance in term of buying and selling in the trading sector, hence this is a postulate called Dow Jones theory of trend which stated that the market can either be bullish trend or a bearish trend, when is it is consistently forming the series of the higher highs and higher lows meanwhile this theory was initiated in 1897.
Hence this theory was the basic foundation behind the technical analysis, because the technical analysis is the concept behind determination of the trend direction, hence this theory is in accordance with the demand and supply and as well the fundamental news in the world of trading. Hence the theory is used to run technical analysis of the past, current and future state of the market alongside the price action direction.
Based on this theory, it actually has three main trends which are the primary, secondary and the minor trend. Hence according to these postulates, the primary is made to last for months and as well years, while the secondary is main to last for some weeks to a few months while the minor is main for some days, hence with this different interval trader can as well find opportunities and take advantage of it.
With this ideology, postulated from Dow Joe theory, I can say it is necessary in technical analysis because it is the concept behind technical analysis, hence without technical analysis it will be so hard to determine the future of the price actions, hence Dow Joe theory is necessary and acceptable in the world of trading.


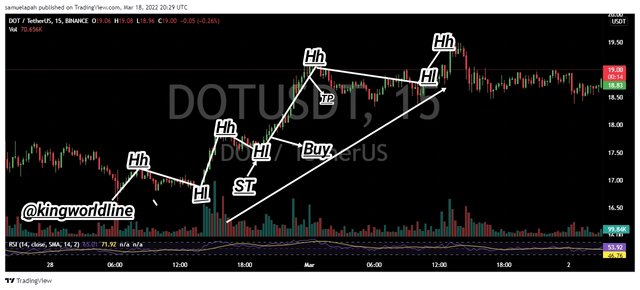
Hence in trading the price action moves in a sinusoidal form which forms a full circle, meanwhile this cycle can be a bullish trend or a bearish trend, hence the bullish maintain the formation of the higher highs and as well the higher lows.
Hence on the aspect of the bullish trend is controlled and formulated by the buyers meanwhile in the other region the sellers are the one in charge of the trend in the bearish order, hence when ever the buyer buys they make such entry in order to make profit they sell it off whenever the supply are much that is when there is less pressure from the buyers, hence the same to the buyer who sell off in other to make profit whenever there is much pressure from the buyer and less pressure from the
Sellers, hence the buying and selling are the basic foundation behind the accumulation and distribution, hence the following is explained below.
ACCUMULATION PHASE
The accumulation phase is the phase of the market that takes place on the bullish side of the trend which is known as the lower part of the trend, hence whenever there is downtrend means that the more is a higher pressure from the seller than the buyers, again whenever the market seem to be lacking momentum and pressure, the buyer start starts selling off their asset accumulated giving room and opportunity for the seller to take charge and domination of the market which result to the change and direction of the trend from the buyers to sellers.
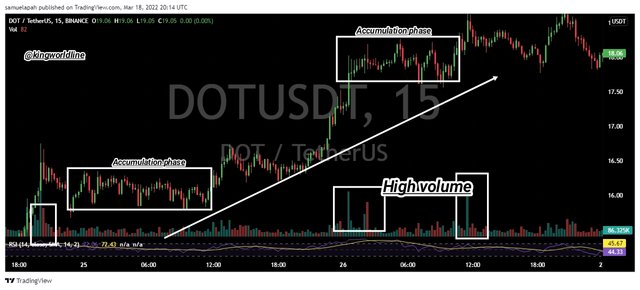
So at some point of this challenge which fall in between the bull and bear, creates the room known as the Accumulation phase, this is came as result of the of the buyers increasing the price and decrease of price by the sellers respectively which last for some period of time before the buyers over power the sellers in beshooting up the price towards the bull side.
Hence this accumulation phase is being carried out by the big and experience investors or professionals in the market, they shoot the market up and close their sell position with another tricks with the aim to deceive the retailer to fall victim of their tricks in order to sap their stake, which result as another little ranging before executing the sell order. As shown below.
Therefore on the Screenshot above is the chart of the accumulation carried out the big man and the retailers,
Hence since all this takes place on the bullish side, it can't be balanced without having the bearish side as well, which balances the movement of price in a circular form.
THE DISTRIBUTION PHASE
The distribution phase is the opposite of the of the accumulation phase which takes place on the bearish side
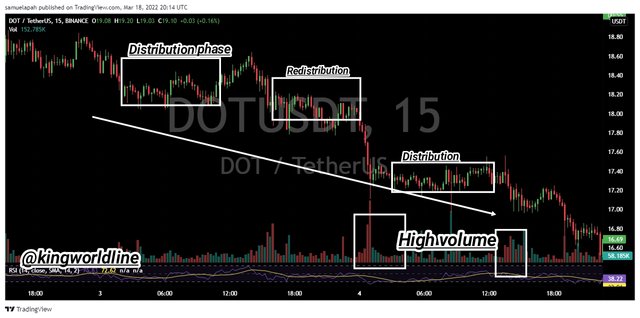
This came to exist due to the involvement of the professional in the market, hence this occured at the point where the the professionals bought at the tip end of the bearish trend which closes the buying positions, due to the position and the assets they has in the market, then the market will start experiencing a slow movement which makes the retail trader to start closing their various positions at loss, hence the formation is called the side market, hence the aim of the big player to sap the stake of the retailer as income as they play his tricks with traps.
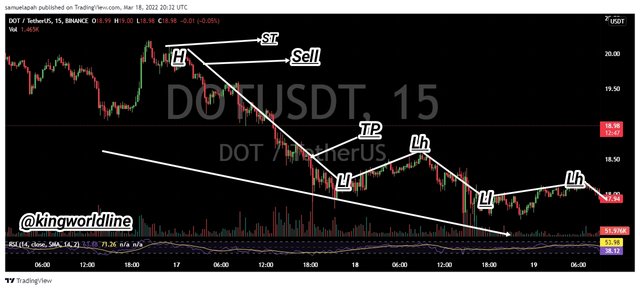
Hence on the Screenshot above, the distribution phase is displayed with the head to head battle with buyers and the sellers, and also there is break out of price in the distribution zone due to the high selling pressure on the bearish trend, at some point the professionals open a sell orders which slow down the trend of the market, there by slowing down the the market activities towards the down trend hence is known as redistribution which allow seller which didn't start at the beginning of the trend to keep on the trend.
Hence the breakout shown on the above distribution zone causes the downward trend as shown on the above screenshot.


Therefore in the financial market with regards to trading , there are three basic well identified formation of price towards the market structure. Which are the following.
• The Bullish Trend
• The Bearish Trend
• And The Sideway Trend.
The Bullish Trend
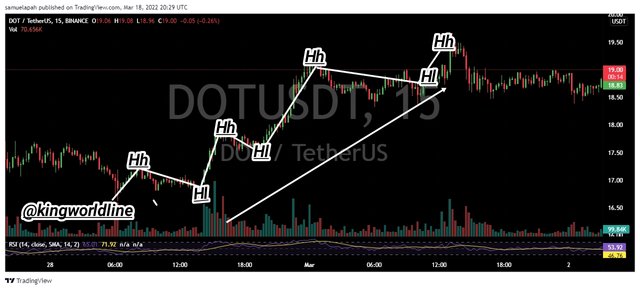
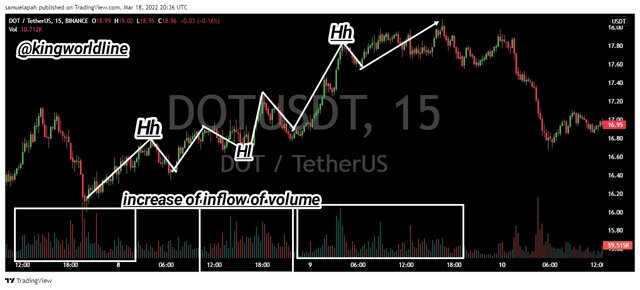
Whenever an asset is on the bullish order implies that the price tends to be rising with a series structural set up of higher highs over a period of time and as well higher lows, hence when the bullish order is in place means that the demand is more than the supply, meaning that the buying pressure is more than the selling pressure.
The Bearish trend
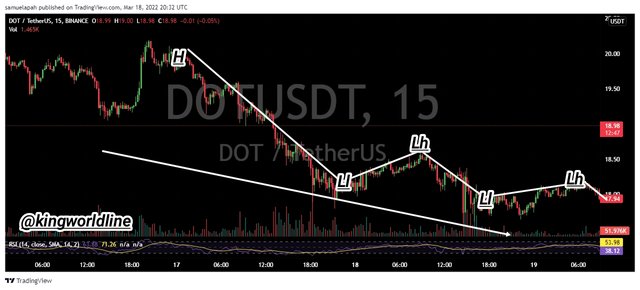
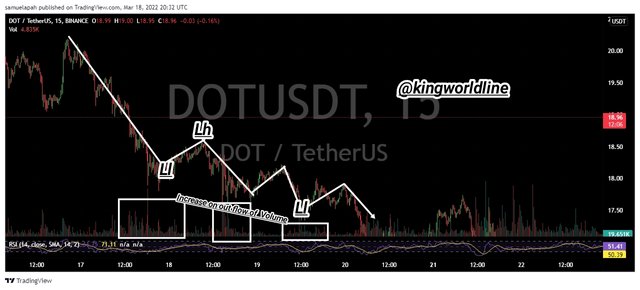
This takes place whenever the price of an asset falls in price over a certain period of time with the formation of a series of lower highs and lower lows with supply more than the demands meanwhile this happens whenever the selling pressure over-power to the buying pressure in the market.
The Sidway Market
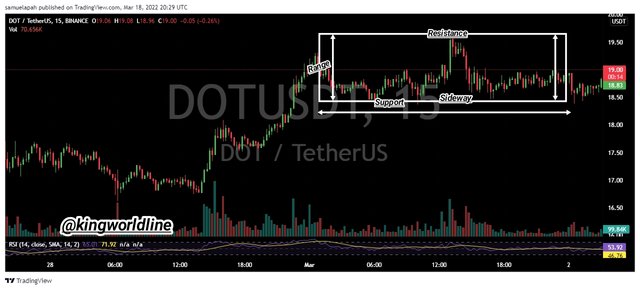
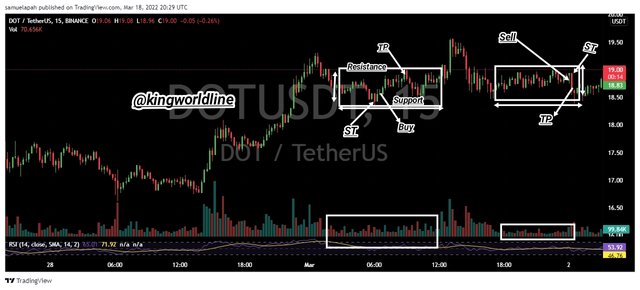
This is known as the phase which is manipulated by the professionals in the market, hence this characterize with it's low volatility and as well the volume. Meanwhile this takes place during the accumulation or during the distribution phase, as shown on the Screenshot we can see the rebouncing of price in range of the support and as well the resistance for a while before breaking neither the support of the resistance, hence this repeat itself in the end of a trend of the middle of the trend.
How To Identify Phase In The. Market
Therefore to identify the current phase which is the trend, this can be done with the use of the trend line and can be useful in determining the trendline in the market, the use of market structure is another means of carrying out this identification of trend, also the use technical indicator is another means of identification of trends, hence all these method were various method of carrying out the phases identification, they are all effecient in their various dimensions in terms of trends identification.


Therefore the internal happening in the market is the reflection of the price actions on the chart.
Hence the volume indicator shows the internal internal reaction of buyers and the seller in a chart as bars, hence this volume indicator is so essential in determine the reaction of buyers towards the sellers vise visa, hence all this reaction are indicated with greens and the red bars where by the red is for thee seller and green is for the buyers
•The Uptrend
On this case of this uptrend in the graph there has higher maximum and as well minimum in the volume bar, with green as coloration scheme of the bar and the green indicating the buying in the market, hence with this colour scheme indicates when the market is up, with a clear chart of the view of the current, past trend in as an uptrend.
The Downtrend
Hence on this is the opposite of the uptrend, hence on this the graph will has the lower minimums and as well the lower maximum with a coloration of red, hence having the market as a downtrend in the chart or graph, this can be confirm with the coloration which is red, that signifies the down trend. Therfore this gives us the trend of what is market is all about at a point in time towards the dowwn trend.
This Sideline
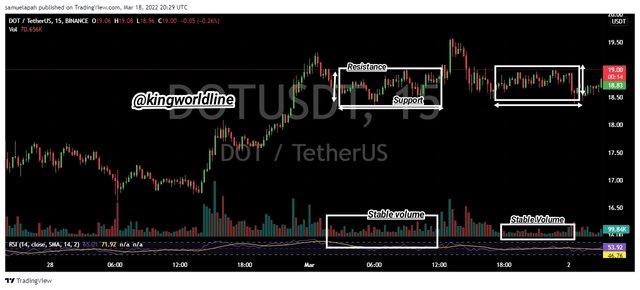
Hence on the lateral trend, we can observe a rebounce of price within the boundary of the support and the resistance where the price action is seem to be equal between the buyers and the sellers, hence this shows that price is stable with the help of graph with an intention to breakout on the bearish or the bullish side.


Hence below are trade criteria for the three different phases of the market.
The Bulllish Trend
•The price must be an uptrend which should should be series of higher highs and as well higher lows, hence they should be an increment in volume towards the uptrends..
• Have patient for the retracement of the opposite side of the main trend to take place, at this lowest point execution can take place.
The Bearish Trend
• The price must be a down trend which should be a series of lower highs and lower lows with increment in the volume towards the bearish side.
• Exercise patience for the retracement of the opposite of the main trend to take place, at it's highest point, execution takes place to sell which in the bearish pattern.
The Sideline Market
Base on the case, since the price action is in between decisions within the boundary of the resistance and support range, is very dangerous to place a trade because there is no trend indication in the bullish or the bearish side therefore the price can break out any time which could favour you or go against you, hence on this case it is recommended to trade with proper risk management or wait for the breakout before execution.


Buy Position
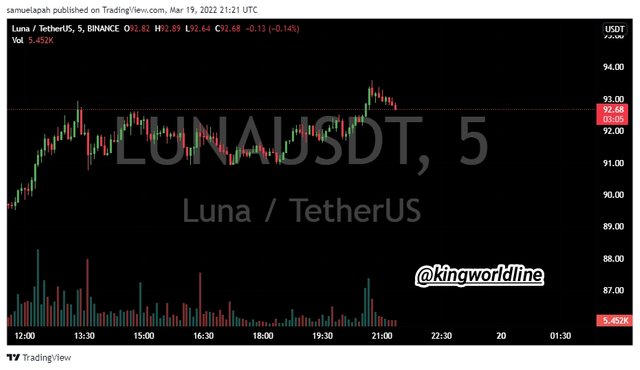
Hence the screenshot is a chart of LUNA/USDT on 5 time frame, viewing at the chart is actually an up trend base in the structure of the market meanwhile the price keeps on the formation of the higher highs and as well higher lows.
At a point I have to allow a retracement towards the the low of the same trend, then at that point I open a buy order the following parameters
• Entry = $93.23
•Take profit = 92.95
Sell Position
On the phase is the sell position , then below is a screenshot below of LUNA/USTDT with a time frame of 15 Minutes.
With close observation we can attest that the market is on the going down.
Then excute to sell with following parameters.
•Entry = $93.04
•Take profit = $93.23


In the world of trading, technical analysis cannot be forgotten. Technical analysis is very important in making analysis before making any entry and as well exit from the market.
Hence with assistance of the technical analysis a trend can be define which actually tell us the future of an asset.
Hence in the post I was able to explain the Dow Jones theory and as well its importance towards trading, I was able to discuss the accumulation and as well the distribution phase alongside with their relevant Screenshot and how they can be figured out on a chart.
Meanwhile I was able to execute a demo trade based on the lesson taught by my professor.
Thanks for reading...
Cc: @reminiscence01
Am: @kingworldline
REFERENCE: ALL SCREENSHOTS ARE FROM TRADINGVIEW
TRADINGVIEW
#reminiscence01-s6week4 #cryptoacademy #club5050 #trading #trend #nigeria



Hello @kingworldline, I’m glad you participated in the 4th week Season 6 at the Steemit Crypto Academy. Your grades in this Homework task are as follows:
Observations:
No chart markup for the buy and sell trades.
Recommendation / Feedback:
Thank you for participating in this homework task.
Downvoting a post can decrease pending rewards and make it less visible. Common reasons:
Submit