Is now the last assessment and teaching for the season from my dear professor @sachino08 on the topic of "Reading special bar combination" is quite interesting, thanks is my pleasure to be part of this assessment, am @kingworldline.


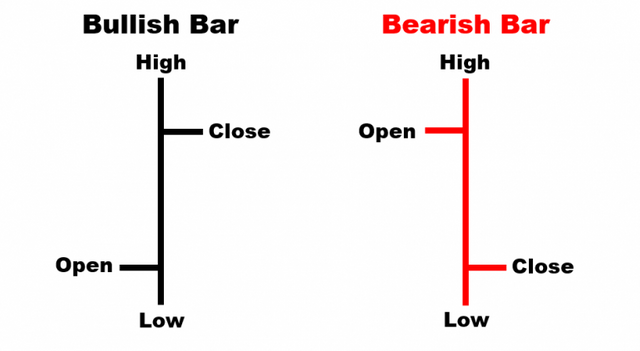
The price bar are known as the trading metrics which assist in figuring and understanding the market chart in order to strategize base on your technical analysis on reading and figuring and interpreting out the state each bar movement, hence this can be used to figure out trends of the market on a chart, main looking at the below chart are four different part that the price bar actually has as am shown below.
Then base on the screenshot shown above are the bullish and as well the bearish including including the four component which made up the bars which are as follows (open, close, low, high)
The OPEN: The horizontal line found at the left hand side of the bar is known as the opening price of any particular asset.
Then CLOSE: Hence this is a horizontal line at the right hand side of the bar which signifies closing price of a particular asset.
THE LOW: In this case, this is the bottom part of the bar which actually signifies the day-high price of a particular asset.
THE HIGH: In the other way round this is the upper part of the bar which signifies the day-low price of a particular asset.
Therefore the following procedures are the means to add the price bar on the trading chart.
Is very simple on trading view, hence this can be done by visiting the trading view web address TRADING VIEW Then after the page home page that has the various features shows up then select 'window' which shows up the bars as shown on the below chart.
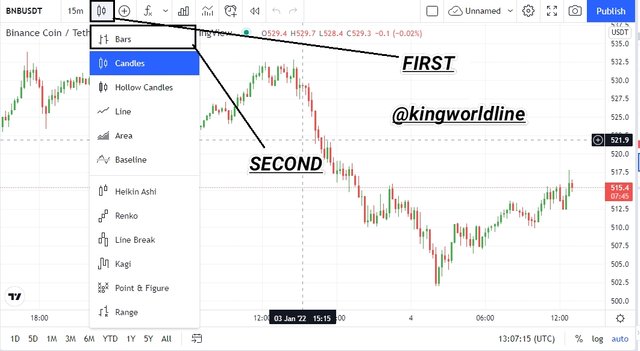
This is the main chart of currency pairs chosen alongside the bars in it.
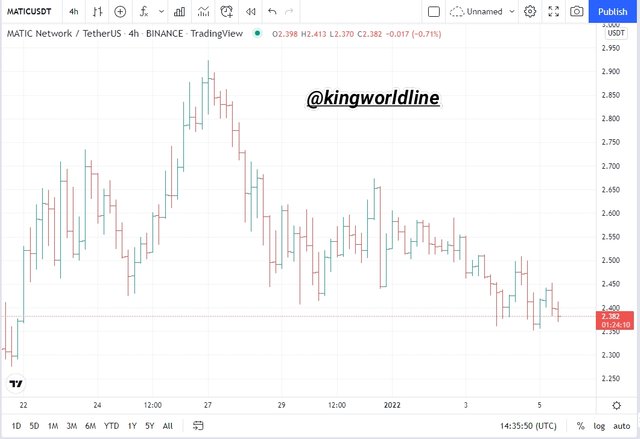


IDENTIFYING AN UPTREND
Therefore based on the screenshot shown above, the uptrend can be identified by the formation of the higher high and higher low which forms in series, meanwhile some time it can be interrupted by the activity of the low high, hence uptrend is caused by the activities of the buyer mostly with little interruption of the seller on the uptrend
Based on the observation on the chart they are formation of the higher high and as well the higher lows on the chart meanwhile this are shown with the price bar in identifying the trends
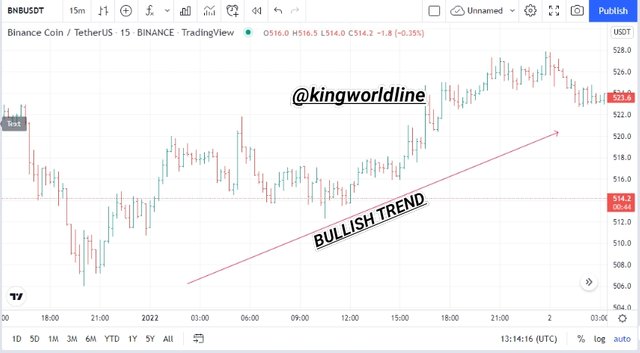
IDENTIFYING AN DOWNTREND
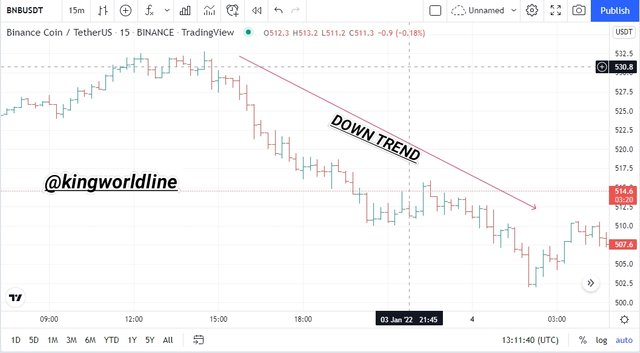
In this case it is known that the sellers are the one that determine the down trend, meaning that the sellers are one dominating and as well taking charge in the market which is known to be the opposition to the buyer in uptrend as well.
Then these can be identified by having the formation of the lower lows and the lower highs.
Hence all these identify the downtrend of the market with the price bar.


The concept behind this is that there must be two criteria to take place before we can get our bar combination: spending the day inside meanwhile is expected that the new day high should be lower than the previous day high and the new day low should be higher than the previous day low which is certain.
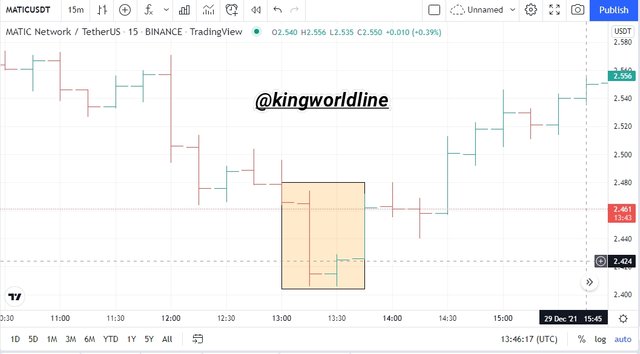
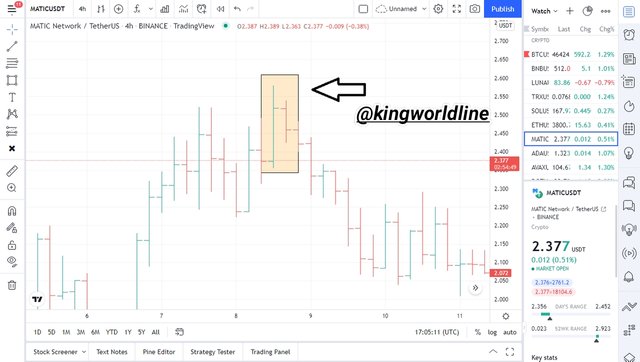
Hence with the two images above shows and as well illustrates the the basic criteria which show that the new day is quit inside the the previous days high-low bar range which is important in indication of the bar formation, that means the both side which are the buyer and the seller are in between decision of what the future holds for them which enhance them not to buy either to sell.


Based on this case as regards to the above question, there are two criteria which are obtainable which are; that the opening of the new day bar should be at low and the low should be at high alongside with the previous day bar.
And in the other way round the new day bar should be at high and the close should be low along side with the previous day bar
The open of the new day bar is at the high and the close is at the low in relation to the previous day bar.
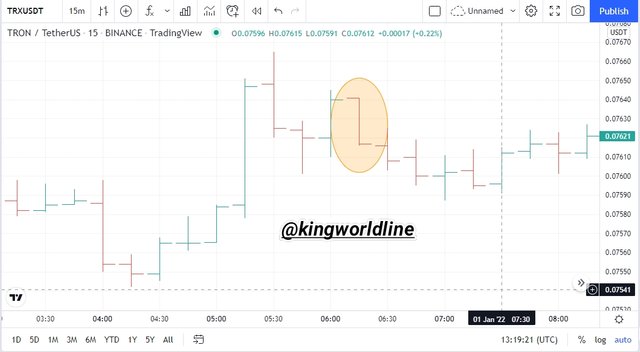
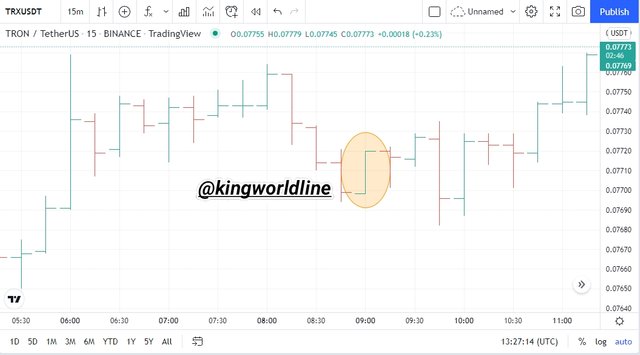
Hence examining the image above, the two images illustrate the and show the right condition for the bar combination for figuring and getting the outside day as well.
Hence the first condition shows that the market is in the bullish trend which is formed by the formation of the higher highs and higher low as well meanwhile the seconds condition I have show and as well indicates the the bearish trend which is formed by the formation of the lower lows and as well with lower highs, therefore this helps to confirm the trend in continuation.


Therefore with the bar combination we can figure out whether the market will continue dominating or not based on its current trend, hence they are things to rely on in order to figure this out, meanwhile I will explain both sides of the uptrend and as well in the downtrends below.
UPTREND
These based on the bullish movement of the price, once there is open and close of bars near to that of the high therefore we should note that the trend can continue on it trend and in the other way round once we notice that the open and close are near to that of the low, we have to expect an uptrend reversal.
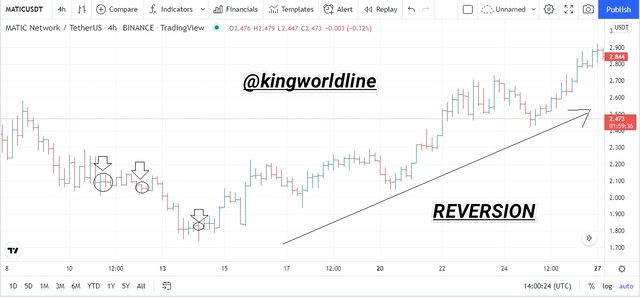
Mai looking at the screenshot above, we can equally observe a perfect illustration of the above said on the up trend.
DOWNTREND
As regards to the down trend actually refer to to the downward movement of the price , then judging based on the bars, we have it the stick open and close which is near to the low that we should expect the continuation of the trend meanwhile if the the ticks of the open and close is near to that of the high we should expect trend re reversal in the other direction.
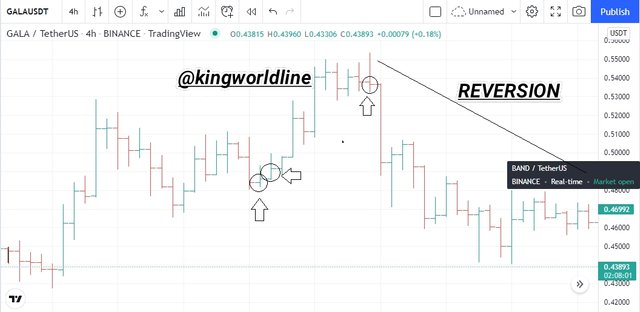
Then with the screenshot above has the perfect illustration as regard to the above said on the down trend


Here i rest the solutions for the assessment which was given by my dear professor @sachno08 who has done well in his thought in 'Reading the various bar combination' which actually assist and help in making good decision in trading, meanwhile the use of the bar combination are used to determine the future whether the trend will continue or reverse however is necessary to keep and abide to the lay down condition needed in carrying out this while trading.
Therefore this has shown how useful the bars are, meanwhile is left for us to apply it while we trade, and this is fantastic on its own because I found it so interesting. Thanks to my dear professor once again @sachino08 for this wonderful lesson and happy new year.
#sachin08-s5week8 #cryptoacademy #club5050 #nigeria #trading #pattern #chart
