
Source

Hello everyone, I feel happy and elated participating in this week's lecture as delivered by professor @abdu.navi03. I am @kingworldline and enjoyed every single bit of the lecture which showcases the awesome combination of the Relative Strength Index (RSI) and the Ichimoku Cloud.

1-Put your understanding into words about the RSI+Ichimoku strategy

The Relative Strength Index (RSI) is an indicator used by technical analysts as a momentum indicator. It is instrumental in giving measurement of the magnitude of recent changes in the price of an asset as a way of determining whether such an asset has entered either overbought or oversold conditions. The indicator functions as an oscillator and is displayed below the price chart as a line graph that moves from one extreme to another extreme in an upwards and downwards oscillatory emotion. It has readings that range from 0 to 100 and was originally created by J. Welles Wilder.
Traditionally, the movement of the RSI is interpreted to mean that when its values have reached 70 or above it would be an indication that the price of such an asset has been overvalued which is an indication of overbought conditions. Consequently, a corrective pullback or even a general reversal of the price trend should be expected. When the reading is at 30 or below it will be an indication that the price of the asset has been undervalued or has entered oversold conditions. A corrective pullback and or trend reversal could also be expected.
The Ichimoku Cloud is a technical indicator that works by outlining levels of support and resistance, gauging the momentum behind the price action and also giving signals that can be used for profitable trading. Ichimoku Kinko Hyo which is the Japanese translation simply means one look equilibrium chart. It is so called because with just a single look at the indicator displayed on the chart a range of information can be obtained by the trader.
The indicator is made up of 5 plots or five lines. These include the Tenkan-sen, the Kijun-sen, the Senkou Span A and the Senkou Span B. However, in this combined system of indicators RSI and the Ichimoku for trading we are most interested in the two lines that constitute the cloud of the Ichimoku system. The two lines are the Senkou Span A (the upper boundary) and the Senkou Span B (the lower boundary).

Source
In trading, the ichimoku is instrumental in providing information on possible future resistance and support levels, not just where the levels are currently. During an upward trending market the Cloud always appears green and the Senkou Span A would be above the Senkou Span B. The Senkou Span B appearing above the Senkou Span A indicates a trend which is predominantly downwards. In this case the colour of the cloud would be red.
In combining these two indicators, the intention is to look for areas of confluence that would be of help in helping traders obtain more refined entry points. The RSI does not have the ability of tracking and indicating the trends in the market. It merely tells you when the trend may have been exhausted or approved exhaustion point. However, the Ichimoku has the ability of tracking the trend and using the colour of its cloud as well as where it appears to tell you the trend in the market.
Equally, combination is important because the Ichimoku cannot communicate or display the inflow or outflow of traders. But the RSI can do this for us by either telling us when an asset has received an inflow of traders by forming a double top indicating that the price is about to push upwards and higher. The RSI will tell you in these extreme conditions of either overbought or oversold that traders are about to enter in the opposite direction helping you to enter at the start of the trend. Equally, it will help you go all the way as you are not expected to close until it begins to indicate signal of exhaustion of the new trend you caught at the beginning.

2-Explain the flaws of RSI and Ichimoku cloud when worked individually

Both the RSI and the Ichimoku Cloud come with varying degrees of flaws and or limitations when used in isolation for trading. This is not quite surprising as no single indicator has it all, after all. Consequently, combining the RSI and Ichimoku comes with a desired advantage we seek. However, using them individually has some flaws or limitations which I will discuss shortly.
Flaws Of The RSI
One of the major flaws of the RSI when it is used individually for trading is that it does not function properly and cannot be reliable during trends. It only communicates to us the state of the price of an asset or that it is overbought or oversold but may not be able to help us understand the price moves should such an asset continue trending higher or lower above or below the extreme point. This means that it cannot adequately tell us what price is doing above or below these extremes and it may not be able to tell us the exact time the trend begins to fail though we have been informed of the trend's extreme movement.
Again, the RSI does not have the ability to tell us the volume in the market. We could try to make a guess of this by trying to follow the twists and turns of the lines of the RSI but this may not present a signal which can be adequately relied on to make any serious trading decisions.

Source
In the image above you would notice that the RSI indicates overbought condition for the crypto asset. Strictly following this indication could make a trader to open a short position considering the fact that the price has traveled extremely upwards based on the signal. Unfortunately, the price chart creates a pattern which only shoots further upwards while the RSI continues to indicate and overbought signal.
Flaws Of The Ichimoku Cloud
The Ichimoku Cloud on its own when used alone has the limitation that it would identify a trend late. Just like every other moving average, it is a lagging indicator and does not have the ability to identify the top or bottom of a trend which would reverse imminently. You are expected to take entries when the price breaks above or below the cloud. However, before this happens the trend would have moved considerably in that same direction.
Again, resistance could be broken and price would move above the cloud but no trend may be established in that direction presenting a false signal.

Source
From the image above you would observe that by the time resistance was broken indicated by the breaking of price action above the cloud it can be observed that the price had even moved considerably in the upwards direction. So, we would have missed out in entering the trend early. However, the RSI can tell us when the price becomes overbought and if the RSI line begins to move immediately below the 70 mark then we may be sure - with confirmation - that a reversal is taking place.

3-Explain trend identification by using this strategy (screenshots are required)

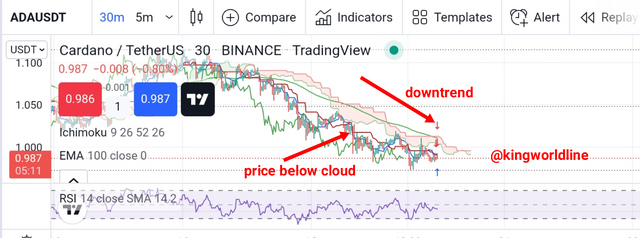
When trying to identify trends with this trading combination there are some things we should keep in mind. When RSI gets up to 70 and even 80 it is an indication that there is very strong buying pressure in the market. This signifies an uptrend which has become very strong. Usually, at the beginning of this strong uptrend or in the course of an uptrend the RSI would create a double top. However, we should not forget that the RSI fails to identify the volume in the market even in this case.
The Ichimoku comes in at this juncture and can be used to determine the volume in the market. When the price of the asset is trading above the Ichimoku Cloud the asset can be said to be in an uptrend. To identify or determine the volume in this situation we should consider the size of the Ichimoku Cloud as it signifies the underlying volume in the market. So, with the use of the RSI we can rightly identify the dip or the tip of the price. Then we would buy at The dip and sell at the tip.
Source
Additionally, the RSI can be used to determine when to exit the market as it can equally signal an imminent reversal of a trend. This could be the case in a situation whereby the lines begin to move below or above the 50 middle-mark creating points for exit.
In the case of a downtrend we should be looking at the RSI getting as low as 30 and even 20 as an indication of strong downtrend. Since it creates a double top in the case of beginning uptrend it would create a double bottom in the case of beginning strong downtrend. Equally, the size of the Ichimoku Cloud would indicate the underlying volume.

4-Explain the usage of MA with this strategy and what lengths can be good regarding this strategy (screenshots required)

It could become necessary to use moving averages additionally with this trading combination. The major purpose behind this is to filter out false signals. Hence, it may become needed to increase the quality, credibility and reliability of signals obtained. Either an EMA could be used or an ordinary MA can go. However, we should be careful to use an MA length that is not low considering the fact that the MA which is in the Ichimoku trading system is already of low length.
So, a length of let's say 85 or thereabout or more could be helpful. However, this would still depend on your trading style. The major use of the MA with this system is to help identify and confirm the actual trend in the market. Using a longer length MA like 200 and above could be more suited for swing trade as it is a slower-moving MA. Conversely, a shorter length MA like 85 could be suited for intraday trading since it is a fast-moving MA and indicates the trend earlier.
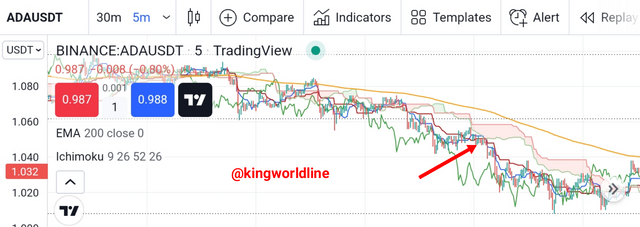
When the moving average is falling with the price of an asset trading below it, it usually signifies the presence of a downtrend in the market. If the moving average is rising with price trading above it, it normally signifies that there is an uptrend in the market.
Source
From the images above you will discover that in a downtrend the Ichimoku Cloud is usually red and the price trades below the 200 EMA which I have combined with the system and which signifies a downtrend. Equally, in this downtrend the price trades below the MA of the Ichimoku Cloud. Whenever the price makes a pullback above the MA of the Cloud but does not go above 200 EMA it signifies that a downtrend is still in place nevertheless. The reverse is the case for an uptrend.

5-Explain support and resistance with this strategy (screenshots required)

In using this strategy to identify areas of support and resistance the two indicators cannot act simultaneously. While the Ichimoku Cloud is used to identify support and resistance levels in a trending market the RSI is used in the case of a ranging or sideways market to study and understand levels of support and resistance.
In Trending Markets
In a trending market the green cloud
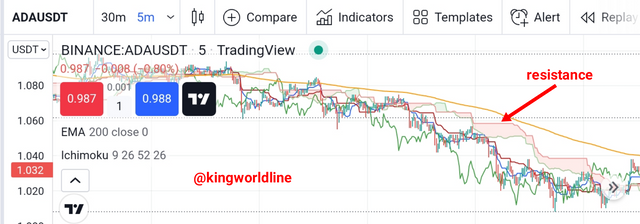
would indicate support levels while the red cloud of the Ichimoku stands for levels of resistance. Usually, anytime the price breaks below the green cloud or above the red cloud it would mean that the underlying downtrend, uptrend or pullback have ended respectively. Furthermore, anytime the price drifts away from the cloud it signifies that the trend is becoming stronger. Conversely, whenhen the cloud constricts and the price moves closer to it, it would signify a weakening trend due to exhaustion.
Source
From the image above you will discover that there is the presence of the red cloud which serves as a resistance level. When the price breaks above this cloud it signifies a break of the resistance level.
In Sideways Markets
In the case of a sideways orange in market the ichimoku would not be of use in identifying either support or resistance levels we would surely have to rely on the rsr to do the work when the RSI enters overbought condition this level or points of the RSI corresponds to the resistance of the price action on the other hand when the RSI enters oversold region this level of point of the RSI indicator to support level of the price action.

Source
These levels are clearly shown in the image above where above 70 signifies overbought and below 30 signifies oversold. However, to get more success with this particular style we should consider shortening the trading range to 60 and 40 for overbought and oversold respectively. This will equally be more helpful in the case of intraday trading and scalping.

6-In your opinion, can this strategy be a good strategy for intraday traders?

I do actually believe that the strategy would personally be suitable to me as an intraday trader. In fact, I feel very excited about it and can't wait to try it out. With this strategy it is easy to identify the direction of the trend and the combo makes it possible for me to actually get a confirmation of the real underlying trend based on a confluence of indications.
Furthermore, the strategy serves to equally inform me of important areas of support and resistance. However, I would be careful to minimise the trading range to 60 and 40 when trying to use the RSI to identify support and resistance in a ranging market considering the fact that my intraday strategies do not permit holding positions for too long. The strategy is a complete strategy and provides all the necessary rudiments needed by any trader no matter the kind of market involved.

7-Open two demo trades, one of buying and another one of selling, by using this strategy

In this section I am going to be analysing my desired crypto pair on the tradingview platform. Equally, I would be making use of a trading view paper trading to demonstrate undertake a demo trade with the aseet.
Buy Entry And Exit:-
Source
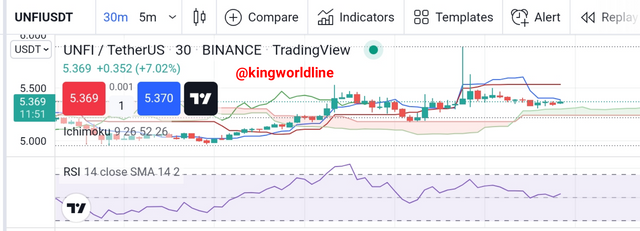
To make my buy entry I considered a few things:-
- The presence of the green Cloud signifies that the price is trading upwards
- Equally, the price had come close to the Cloud signifying a pullback but the RSI was still above the mid-mark showing that an uptrend was still in place and not a reversal since RSI had not gotten to the overbought region
- I took an entry here with the intention of buying at support
- I put my take profit and stop loss orders in place as shown below
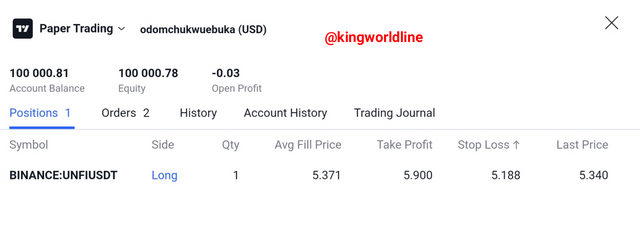
Source
Sell Entry And Exit:-
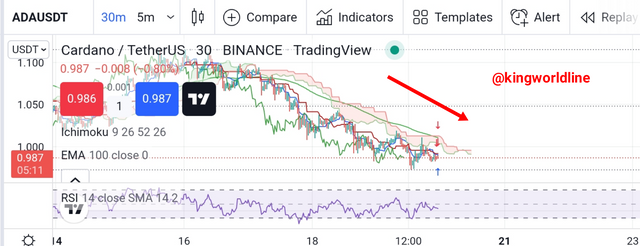
Source
To make my sell entry I considered a few things:-
- From the crypto pair chart you will discover that the asset is in a strong downtrend as indicated by the presence of red cloud
- Equally, I am using the hundred periods EMA for confirmation of the trend and the price trading below both the hundred periods EMA and the low length MA of the Cloud equally shows that the two MAs have been respected and price is really downwards
- The RSI had moved below the 50 middle-mark signifying increased strong downtrend
- At this point I took my sell entry and put both my stop loss and take profit in order as shown below
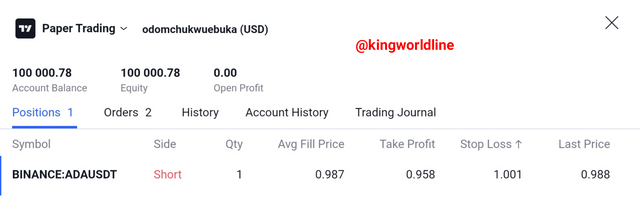
Source

CONCLUSION

The combination of the ichimoku Cloud and the RSI in a system of trading is very interesting because it has the ability of using one indicator to make up for the shortcomings of the other indicator. While the IRS does not have the ability to predict trends the ichimoku can make up for that through the ichimoku cloud
Again while they smoking cannot track the inflow or outflow of 3 days into the market the RSI has the ability to give us this information the entire system is a great combination that works in a few years to identify trend showcase resistance and support levels and also give good confirmations for trade entry.
