Is my pleasure once again to part take on my dear professor @allbert home work again of which he thought us on the Trading with Accumulation/Distribution (A/D) Indicator, so interesting, thanks to this fresh knowledge, I hope will find my work so interesting, I welcome every one.
Am @kingworldline.
1- Explain in your own words what the A/D Indicator is and how and why it relates to volume. (Screenshots needed).

Accumulation/Distribution indicator well known as the A/D indicator which is developed by trader by name Marc Chaikin which was formally known as "CUMULATIVE MONEY FLOW LINE before renaming it Accumulation distribution meanwhile this is a indicator in the trade chart which calculate the entry and and the exist of values with respect to the volume measurement, mean while as the name implies the accumulation and distribution, accumulation signifies that asset are being trapped without investing while the distribution show that the asset are being invested which implies to have the accumulation and distribution which determines the uptrend and the downtrend of a market which are now expressed technical on a trading chart with help of a trend line and price line floctuating on it's volumes.
The basic important of this particular indicator is to shows the strength of the trend based on internal happening within the market cycle showing buy and sell reaction as reflection on the chart, this siginal a trader when to purchase and when to exist from the market.
Accumulation and distribution indicator are related to volume, mathematically when we talk about accumulation we are refering to volume in one way or the order, in order to show the available in a given volume, hence distribution is acknowledge with reduction in volume of the accumulated. therefore the relationship of this two entity (A/D) shows and signifies the rate of volume which is directly proportional to a given volume, hence the acummulation and distribution indicators indicates the level of liquidity or stock in the market.
Based on technical point of view, the A/D inducator signifies the volume of stock in the market and it's availability, which determine the proper time for a trader to enter and exist the market.
Hence the reason for the relationship between the Accumulation and the Distribution Indicator with volume is due to the fluctuation within the accumulation and the distribution range which is determined with the relationship of the accumulation and distribution with the volume which determine the value in order to ascertain the current trend.
2- Through some platforms, show the process of how to place the A/D Indicator (Screenshots needed).

Then to show how to place the A/D indicator, I will sample this in two platform, one on Iqoption and the other on trading view.
IQOPTION
Iqoption i downloaded the application which can also be access through web address Link, then once the platform opens. I Choose cryptocurrency of your choice.
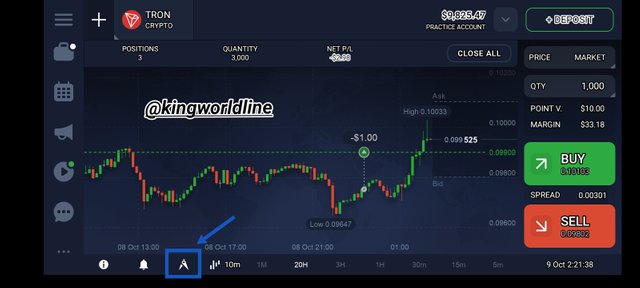
Then below the chart you see an icon as shown in the screenshot, click on it.

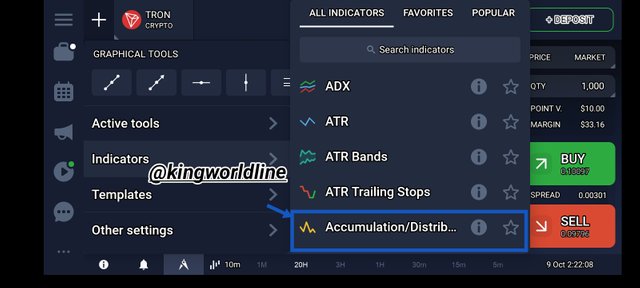
Then a drop line option will show up, showing you options then click on indicators as shown on the screenshot below.
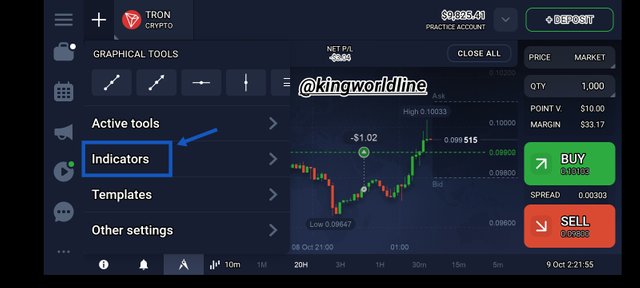
Then from the option shown from the option, select Accumulation/Distribution and select the thickness of the trendline.
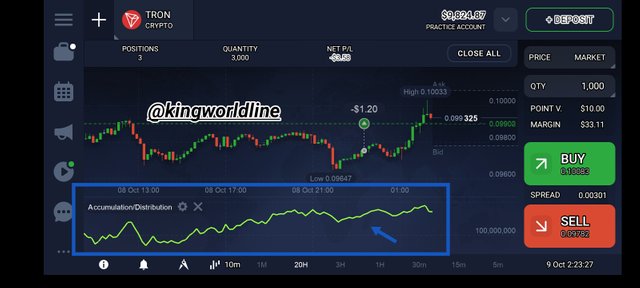
Then go back on the chat it will show up as shown on the below screenshot.
TRADING VIEW
On trading view I used the web address Link to apply the A/D indication .
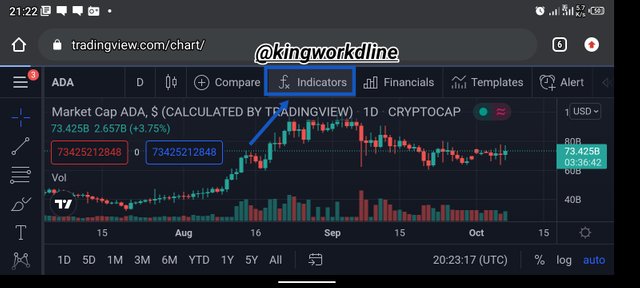
First i visited the web address above and search for a currency or click on the three small bar line by the left hand side as shown on the below screenshot.

Then locate the fx indicators at the top bar and click on it, a drop line options will show up, showing you accumulative distribution.
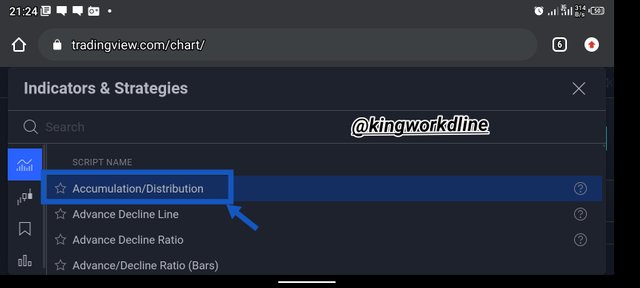
Then go back on the chart it will now show up as shown on the below screenshot below.
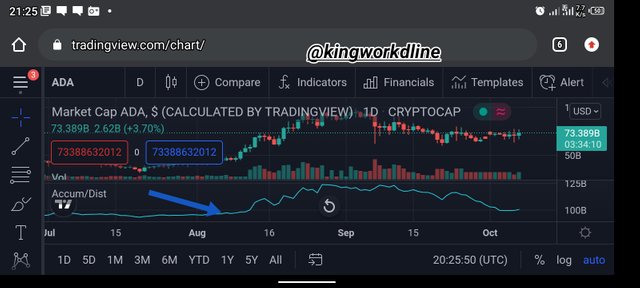
NOTE THAT ALL SCREENSHOT FROM THIS PART ARE ALL SITED FROM THE BELOW LINK
IQOPTION
TRADINGVIEW

3- Explain through an the formula of the A/D Indicator. (Originality will be taken into account).

To explain the formula made for the Accumulation and distribution indication known as A/D, then I will try to explain the basic component of the A/D where by we has the following;
•Money flow Multiplier will be represents with (MFM).
•Money flow Volume will be represented with (MFV) .
•And the Accumulation distribution line will be represented as (A/Dline).
•Therefore to calculate (MFM) we can have
(MFM)=(closing price - Low price) then we will now deduct it from the (High price-close price) which I will divide it with (High price-Close price) in order to get my Money flow Multiplier known as the A/D.
•To calculate for my Money Flow Volume (MFV) I will use money flow multiplier (MFM) then multiple the Volume which gave me my Money Flow volume for that period.
•Therefore for the case of the Accumulation/ Distribution indicator (AD), to get this done I have to add up my previous period A/D with my current Money Flow VolumeVolume (MFV) in order to get my Accumulationand Distribution.
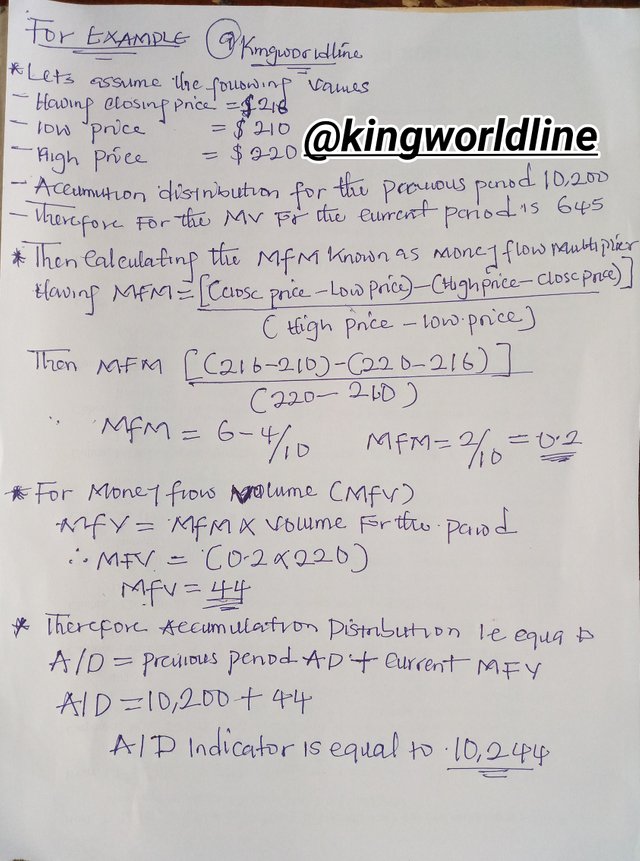
Reference: My personal writeup

4- How is it possible to detect and confirm a trend through the A/D indicator? (Screenshots needed)

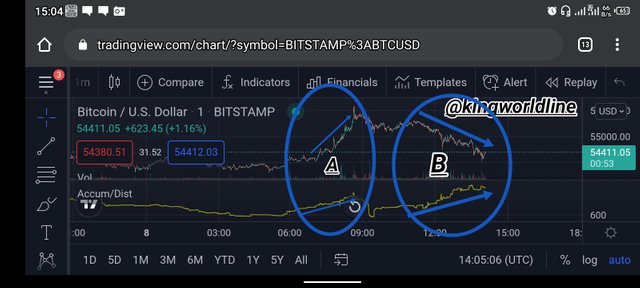
Link
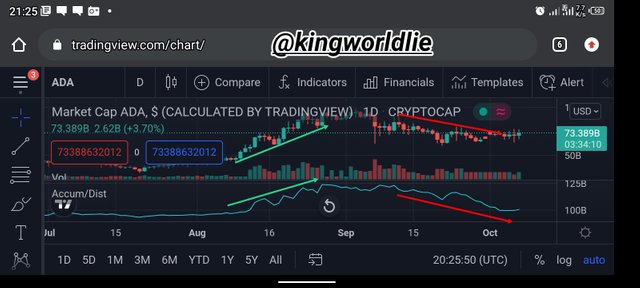
As I have on the above screenhot above on the part A, therefore the way out to detect trend is when we observe a continues pile up of the candle stick or price at the same order in a particular direction as I have in the above screenshot on part A as the bullish trend, meanwhile to have it on regard Accumulation distribution indicator is when we observe that the Accumulation distribution Indicator is at the same trend, as according to the chart above I have the ACCUMULATION and the candlestick trend or price moving up in the same direction, therefore with compliment of the candle stick trend price signifies holding in the market which shows a comfirmation of action of the trend on a bullish trend while reverse of this could lead bearish along side with the DISTRIBUTION confirmation. Therefore holding Accummulation causes the bullish trend while releasing of our asset causes the bearish trend which is the distribution.
At the B part of the screenshot of the trend of the show different and another kind of confirmation, this is not showing ACCUMULATION and the candle stick trend at the same direction, meanwhile at this part is showing converging trend between the ACCUMULATION and the candle stick trend which signifies that the bullish trend will soon end.

5- Through a DEMO account, perform one trading operation (BUY or SELL) using the A/D Indicator only. (Screenshots needed).

There for to perform this buy and sell I will be using my Iqoption demo application to carry out this.
Stage

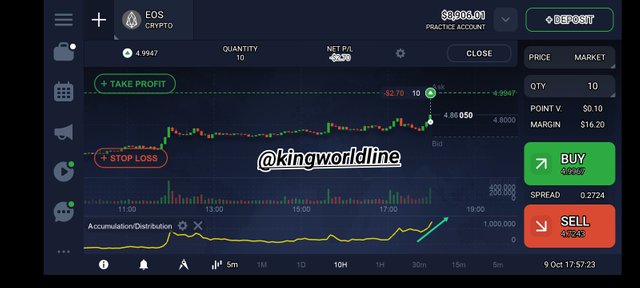
Therefore I log in the Iqoption then I proceded by choosing my favourite currency Eos, main judging with the A/D, you can see is going up which signal buying period which is known Accumulation in the Accumulation Distribution
Hence since the A/D is telling us to buy i proceeded in buying the Eos as shown in the below screenshot.
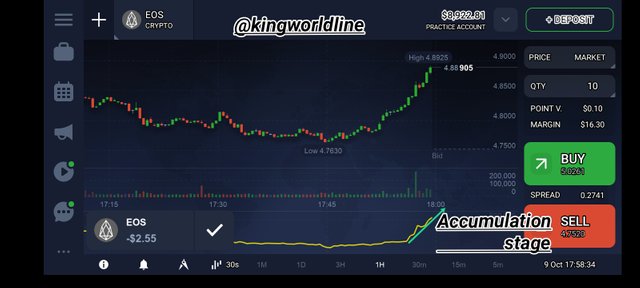

***NOTE: THAT ALL SCREENSHOT USED IN THIS PART ARE FROM THE BELOW LINK.
Link
6- What other indicator can be used in conjunction with the A/D Indicator. Justify, explain and test. (Screenshots needed).

In order answer this to be in alignment with A/D indicator I have to use the Exponential moving average known as (EMA) to proceed further in answering the questions.
Exponential moving average known as (EMA). This is a technical means of calculating the current reactions of the trader on the market over the buying and selling and as well the entry and exist from the market. Meanwhile this Indicator is used to confirm signals and as well to support market strategy.
Therefore this indicator shows some important signal while moving with the price flotuation signals, Hence when ever we have the shorter EMA moving across the longer EMA shows a sign of strong buying point which is known as the Golden cross signal. Meanwhile in the other way round when ever the short EMA gets across the long EMA, this shows or signify a strong selling point, which is known as the death cross, meanwhile this indicator move according and within the range of the support and the Resistant level in other to determine signals.
Therefore to justify and as well prove the Exponential Moving Average EMA, it can be calculates mathematically have the following into consideration.
EMA=Exponential Moving Average
Having K = as the weigthing factor of EMA
Therefore EMA = K( current price - previous EMA)+ previous EMA.
Hence for EMA21
K=2/(21+1) =0.090/1 ×100=9.0%
For EMA50
K50= 2/(50+1)=0.039/1 ×100 = 3.9%
Therefore this show us the weight of 21 days EMA on the recent price which gave us the 9.0% as the weight placed.
Where as in the 50days EMA of the 50% has 3.9% weight being placed as well.
This now tell us that the EMA calculated or gotten from the short days shows that they are more in charge of the of the price change than that of the longer days.
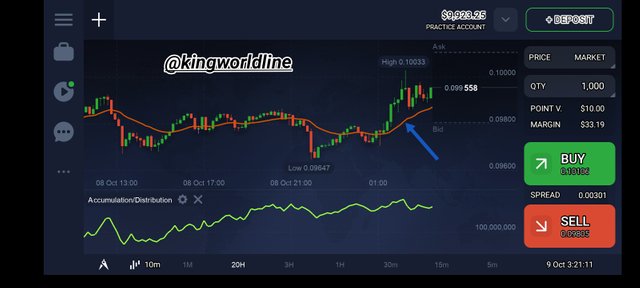
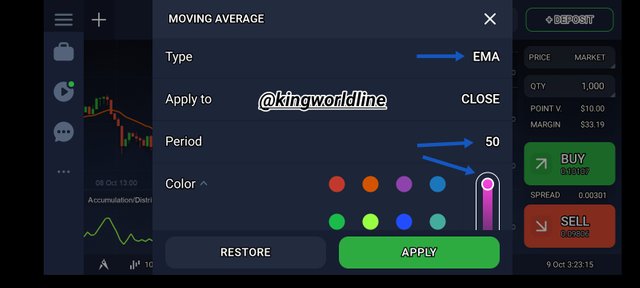
In order to test run how this work, I used my Iqoption for this, then I proceed in opening the application and step down with the following screenshot accordily.

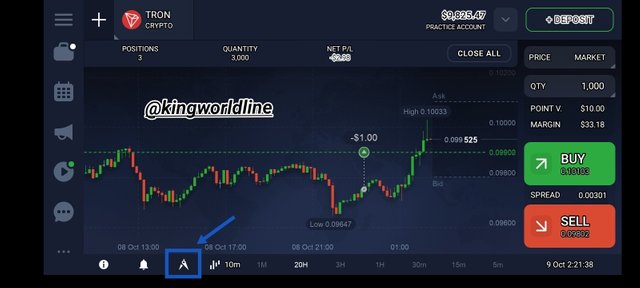
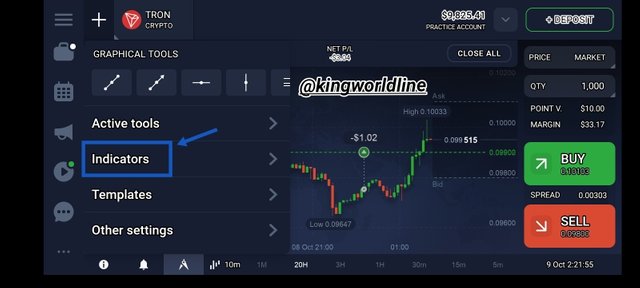
EMA 21DAYS
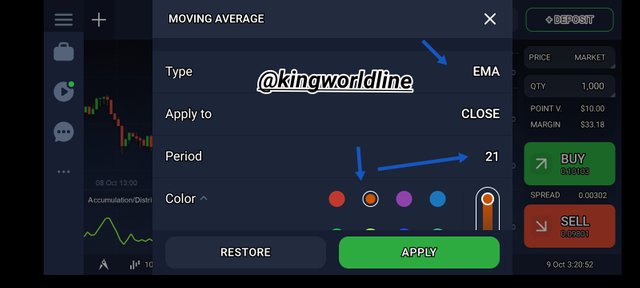
EMA 50DAYS
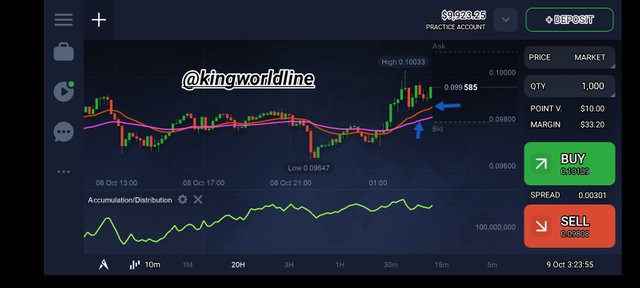
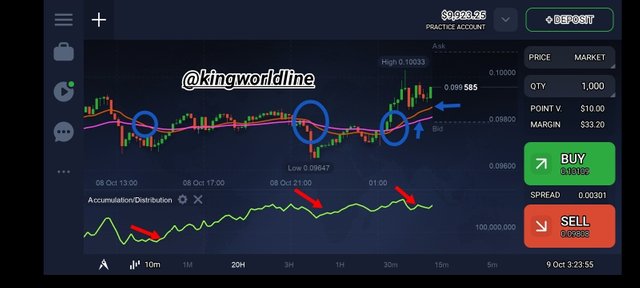
Then I found that where there is a crossing of the pink colour 50 days EMA over the Brown color which is the 21days EMA signifies exist (To Buy)from the market while the other way round where ever the 21 days EMA goes across the 50 days EMA signifies entry (To Sell) with respect to my charts.
NOTE: THAT ALL THE SCREENSHOT FROM THIS PART ARE SITED FROM THE BELOW LINK
Link

Conclusion

Accumulation distribution as an Indicator has It role to play in determining the current happening in market which is being shown or drafted in form of chart, this accumulation Distribution known as A/D which uses a single line to represent the flextible nature of the trend which is being determined with what the trader are doing the market.
Therefore base on my own findings and understanding is that this A/D indicator is not actually efficient enough to stand on it's own in terms of determining when to enter and exist a market, meanwhile in regards to that other indicator such as the Exponential moving average is a match to the A/D to use in cross checking the happening around the market.
In general indicators has special impact in determine the Next in a market meanwhile all of them are technically incline.
MY REGARDS TO
@allbert
Thanks for this lesson.
