Hi everyone, Good . Today I am going to write an article on the third week to complete the homework given by the professor @stream4u, so welcome and happy reading for all.

Introduction:
Analyzing trade patterns is a part of technical analysis that most traders cannot master at first. As the follow-up and trading in the markets requires time and experience to be well absorbed. However, you can use graph pattern recognition programs to explain where the graph pattern originated, which greatly increases the level and speed of learning. With practice and experience, you can get to know them on your own in real time as well as trade opportunities that open up for you faster.
What Is A Chart Pattern?
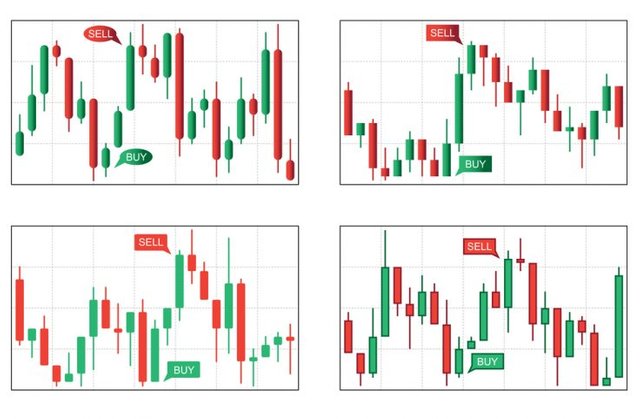
A chart pattern is a graphical structure of price action that repeats from time to time. In other words, graphic patterns, or price patterns, are a graphic representation of buying and selling pressure in the market. Where the shape of the candlesticks is what distinguishes each style from the other.
Chart patterns are representative of the histogram, and there is a story behind each chart that expresses what is actually going on. For example, if we see a long upper wick at the top of a bullish trend with a high volume, then we realize that there are a lot of profit-making processes, and we can expect that the speculators are on their way to start appearing.
What Is A Price Breakout?
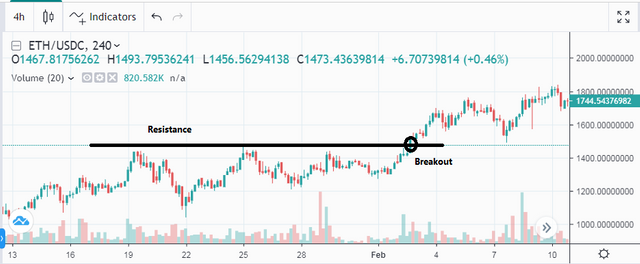
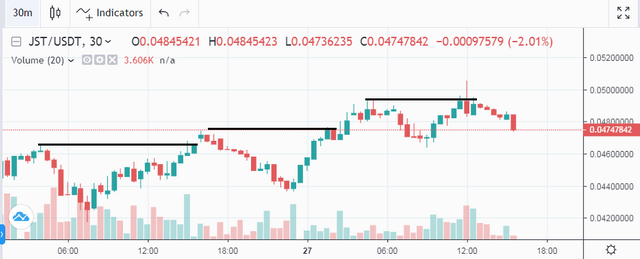
It is said that there is a breakout when the price crosses a significant level. However, not all breakouts are created equal. There are preconditions for a breakout to be considered relevant: consolidation before the breakout, as well as a significant increase in trading volume, demonstrating the enthusiasm of investors to push the price as far as possible. Breakouts can be done up or down.
What Is A Continuation Pattern?
A continuation pattern is when a trend continues in the same direction after a specified price movement or consolidation phase. The general long-term trend should be assessed for traders to enter a long term trade. Ideally, the long-term trend will continue to build in strength after the completion of the continuation pattern. There are several continuation patterns including triangles, flags, pennants and rectangles.
What Is A Higher High Formation?
A higher high occurs when the price has closed higher from the previous day, this is a sign of confidence to traders and a possible upward price trend may continue.
What Is A Lower Low Formation?
A lower low occurs when the price has closed lower than the previous day's low, this is a signal of less confidence to traders and a downtrend in price may continue.
What Is A Reversal Pattern?
It is not difficult to guess what the reverse pattern means. It indicates that the trend may reverse once the pattern is completed. In simple words, if you notice a reversal of a chart pattern during the period of a certain rising trend, it theoretically indicates that the price will start moving downwards soon. If you see a reversal of a chart during the period of a downward trend, this means that the price will soon rise. Keep in mind that “soon” is an indefinite concept and that this is only a theory and should not be taken as reality.
What Is A Double Top Pattern?
In this pattern, which was formed as a result of price hikes formed over and over again, prices were unable to break it to further rises due to the strength of that resistance, and when these peaks formed, you see that prices will bounce back down and prices will experience a new level. It is known that the second summit may be less than the first summit Then you must take advantage of the price rebound for the benefit of your trade.
Here is the following form to clarify:

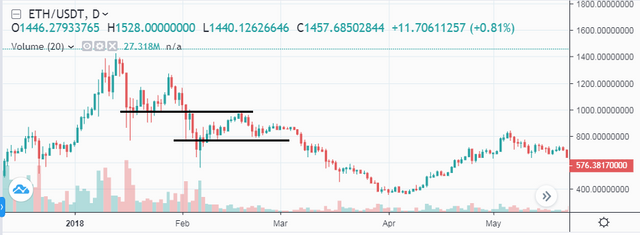
And in the above chart, you can see that two peaks were formed after a strong and continuous movement on the part of buyers, repeating one peak after the other. This is a strong sign of reversing the downward trend, because it tells us that the buying pressure is about to end.
Attention must be given to entering below the neckline in order to be sure of the awaited landing.

The downward trend has already been confirmed after the two tops were formed, and the break of the neckline made it clear that prices fell down, and strongly tracking the peaks could make you reap more profits in your trade, so pay attention to that.
What َIs A Double Bottom Patterns?
Double bottoms are also patterns to reverse the trend, but this time we are looking to go for the long term instead of the short. These formations occur when we reach the end of downtrends, then the bottoms are formed as in the following figure:

You can see the chart above and you see that after the previous decline, prices rose two lows that were formed because the price could not go below a certain level and that the bears 'ability had ended and the bulls' journey began to buy and confirm the trend after the neckline was breached and therefore buying is better above the neckline .
As you can see, the price headed higher after breaking the neckline and was the best buy after confirming the formation of the Double Bottom.

Note: Look for highs and lows, you will find opportunities to enter and increase your capital, but try to break the neckline to make sure of the signal in buying at the bottoms and in selling at the tops.
What Is The Importance of Stop Level(STOPLOSS)?
The management of positions by "stop loss" makes it possible to secure the capital of a wallet in real time.
While the analyst tends to follow his idea until a strong reversal signal, the trader, who cannot support a very unfavorable mark to market, is forced to cut his position (in the event that the latter does not not consider the markets as a vast casino) when the signal previously emitted is not confirmed. This notion of confirming a given signal and its corollary which is the stop loss can lead the trader to doubt his method.
Where To Find & How To Set A Stoploss?
When a sell signal is given by the crossing of a support zone (previous extreme, break of trend line, exit from configuration), a common phenomenon sees the initial acceleration movement retract so that the market returns to seek the trend line. If this last resistance holds, the signal is confirmed and the market develops a new downtrend. If the underlying crosses again below, the configuration is invalidated, and the stop loss activated.
Conclusion:
Chart-based trading is a technique or tool that you can use while trading to help you make better trading decisions and determine the most appropriate time during the trading of the market.
Chart patterns allow you to read chart charts and can help you identify profitable trading opportunities. It's also important to focus on one chart pattern at a time. You should take care to ensure that you understand all the information that the chart pattern shows you before committing to a trading position.
We should not be satisfied with trading based on chart patterns without paying attention to the rest of the market procedures. Then you need to have other supporting factors to validate the trading indicators; Otherwise, you will not be able to persist in the long run.

Cc:-
@steemitblog
@steemcurator01
@steemcurator02
@stream4u

Hi @kouba01
Thank you for joining Steemit Crypto Academy and participated in the Homework Task 3.
Your Homework task 3 verification has been done by @Stream4u.
Thank You.
@stream4u
Crypto Professors : Steemit Crypto Academy
Downvoting a post can decrease pending rewards and make it less visible. Common reasons:
Submit
Twitter promotion
Downvoting a post can decrease pending rewards and make it less visible. Common reasons:
Submit